


When alerts aren’t enough anymore
A decade ago, every company with a production database had a DBA on staff. Today, that’s no longer true. The rise of managed database services — Amazon RDS, Azure Database for PostgreSQL, Google Cloud SQL — has removed the operational overhead of running databases while also removing the deep expertise that came with it. Platform teams manage fleets of databases they didn’t provision, running workloads written by application developers who don’t think in terms of auto vacuum scale factors or WAL checkpoint intervals.
In the current day, modern engineering teams don’t manage one or two databases. They manage dozens, hundreds, or thousands of them, including an expanding and distributed fleet of purpose-built databases serving microservices, data pipelines, and AI inference workloads.
In these modern environments, traditional database monitoring creates a problem it’s supposed to solve—visibility with virtually zero context and no straightforward, systematic way of prioritizing or understanding the impact of issues. Alerts fire constantly. Dashboards fill up. On-call engineers get paged with a metric threshold breach and no context for what it means, how urgent it is, or what to do about it. Database administrators who once acted as subject matter experts on call are being replaced by platform teams and distributed ownership. There often isn’t a DBA in the loop when an incident happens. For developers, that means database issues increasingly show up as application problems that they’re expected to diagnose, even when the root cause sits outside their code.
The volume of signals has outpaced the capacity of teams to interpret them. Showing alerts at scale is no longer enough. You need answers.
Seeing that this principle has remained at the core of the Dynatrace vision since our inception, it naturally served as the driving force behind the recent enhancements of the Dynatrace Database App. We don’t just surface what’s happening — we analyze it, explain it, and recommend next steps to help you remediate issues efficiently, expand cost savings, and proactively optimize your digital environment. We call this approach analysis-first database observability.
Introducing analysis-first database observability
Dynatrace has always been built on the belief that observability data without analysis is just noise. That principle now extends fully to database monitoring.
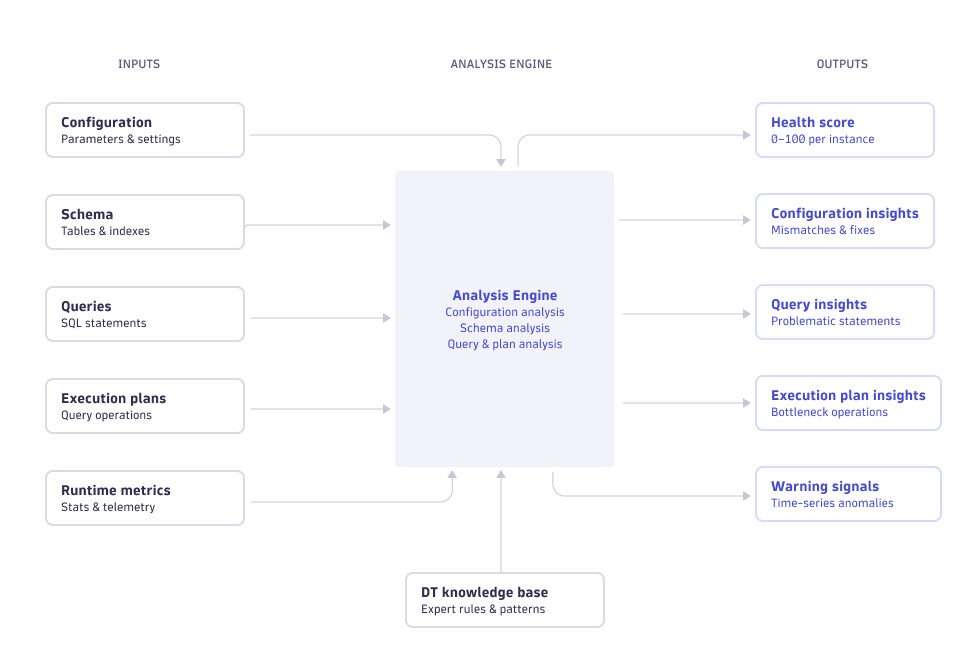
The Dynatrace Database App introduces a multi-layered analysis engine that continuously evaluates your databases across five areas:
- Configuration analysis: Is your database configured optimally for its actual workload?
- Schema analysis: Are there structural problems in your tables and indexes that are silently hurting performance?
- Query analysis: Which queries are problematic, and exactly why?
- Execution plan analysis: What is the database actually doing to execute a query, and where is the bottleneck?
- Health scoring: Across all the above, what is the overall health of each database instance, and where does it need attention?
The insights that the engine surfaces come with context: what the problem is, how severe it is, and recommended fixes. When you’re managing hundreds of instances, that can help engineers identify and prioritize issues more quickly and without needing a decade of database specialization experience to do so.
What’s new in the Dynatrace Database App
All new features in the Dynatrace Database App have been purpose-built to provide an even more comprehensive understanding of your various database instances and to enable greater operational efficiency, cost-savings, and reliability.
Health Score engine
The Health Score gives each database instance a single score from 0 through 100, (based on weighted checks) helping them prioritize investigation and decide which instances may need attention.
Query and execution plan insights
The analysis engine evaluates SQL statements in the Top Queries list and available execution plans against performance rules, then surfaces relevant insights, which helps teams connect performance issues to specific query behavior or plan operations.
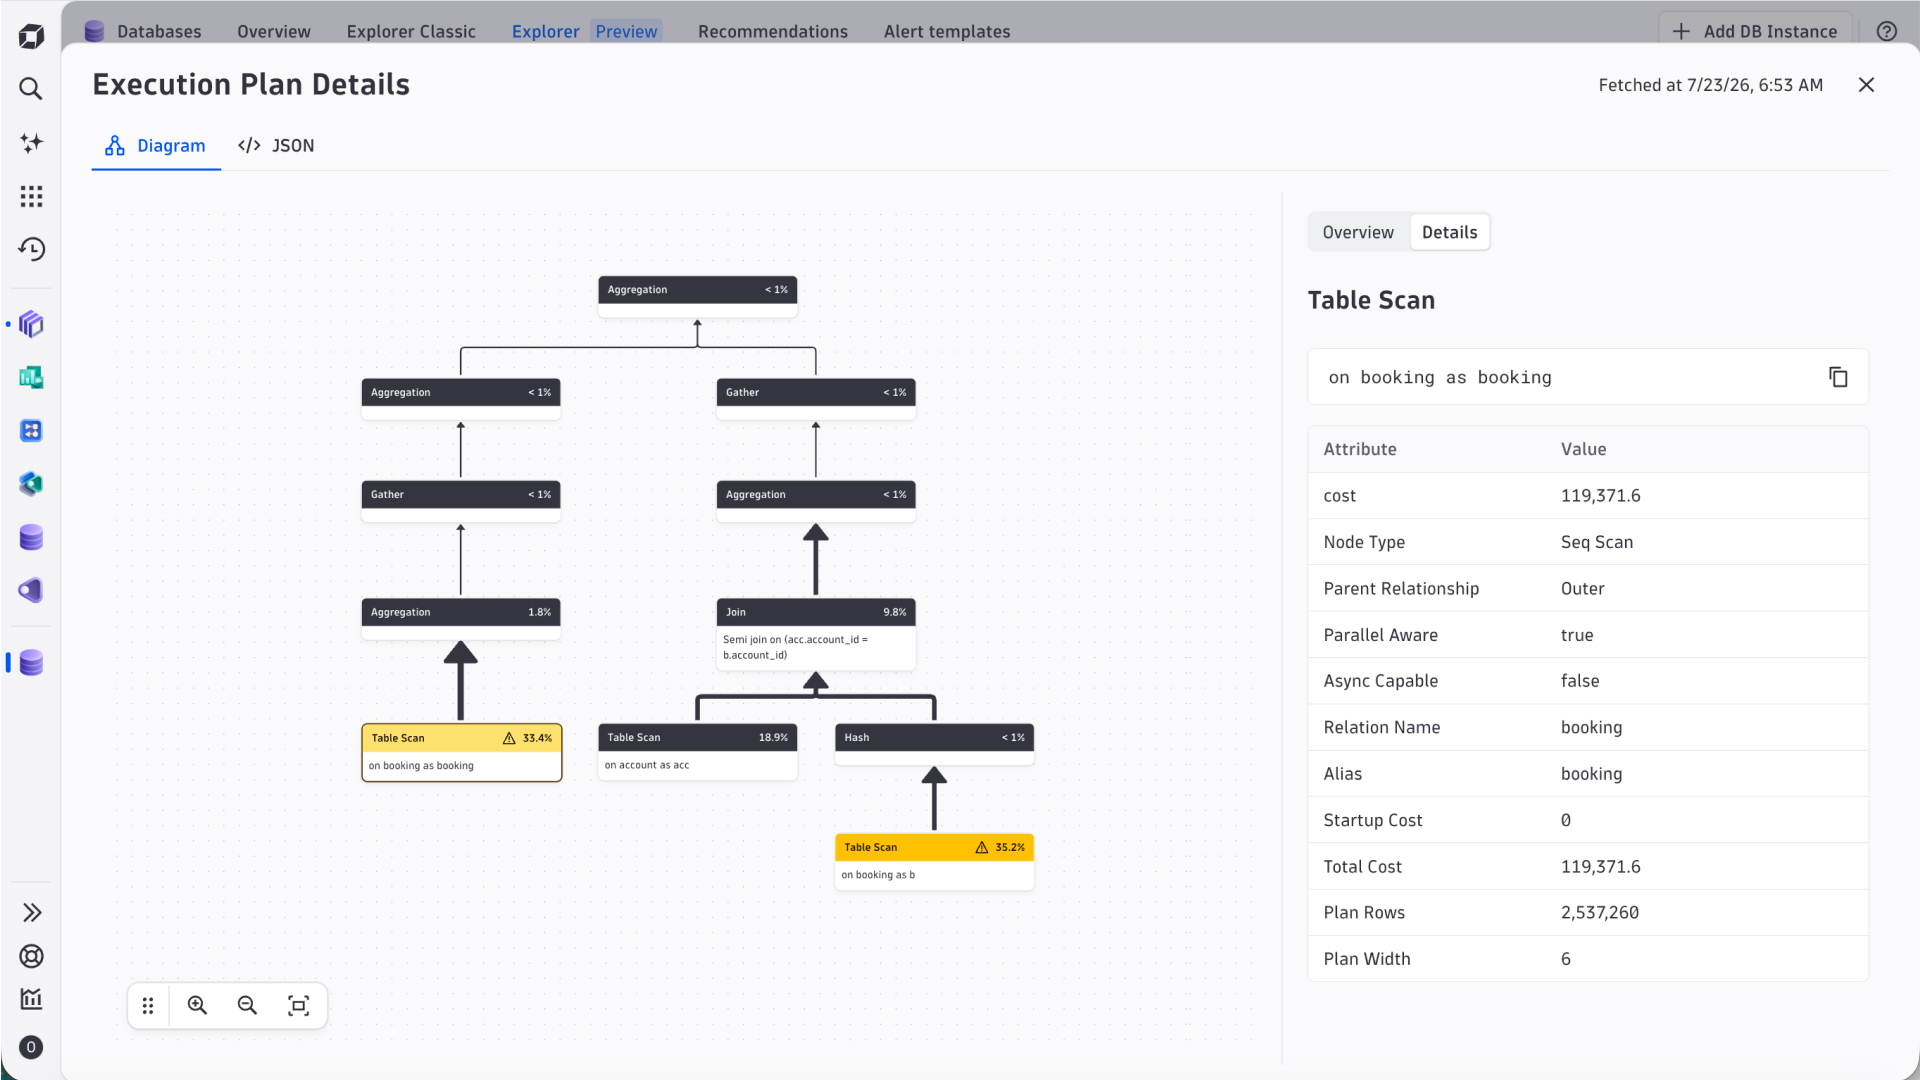
Execution plan visualization
The execution plan visualization presents raw execution plans as interactive tree diagrams. Dynatrace also normalizes plans from PostgreSQL, MySQL, and SQL Server into a common format, giving engineers a consistent way to review execution plans across supported database engines.
Configuration insights
Configuration insights evaluate database parameters against the instance’s workload and hardware profile, then surface potential mismatches. Each insight explains the parameter, why it matters, and which remediation step to consider.
Schema insights and warning signals
Schema insights identify structural issues in tables and indexes, and warning signals extend that analysis to time-series patterns. This enables teams to spot conditions that may warrant closer investigation.
Use case: Resolving a query performance incident in minutes
While the new features of the Database app certainly look great on paper, how can they actually be applied in real-world situations?
The scenario: A payment processing service starts showing elevated p99 latency. The on-call engineer gets paged. It’s 2 AM.1
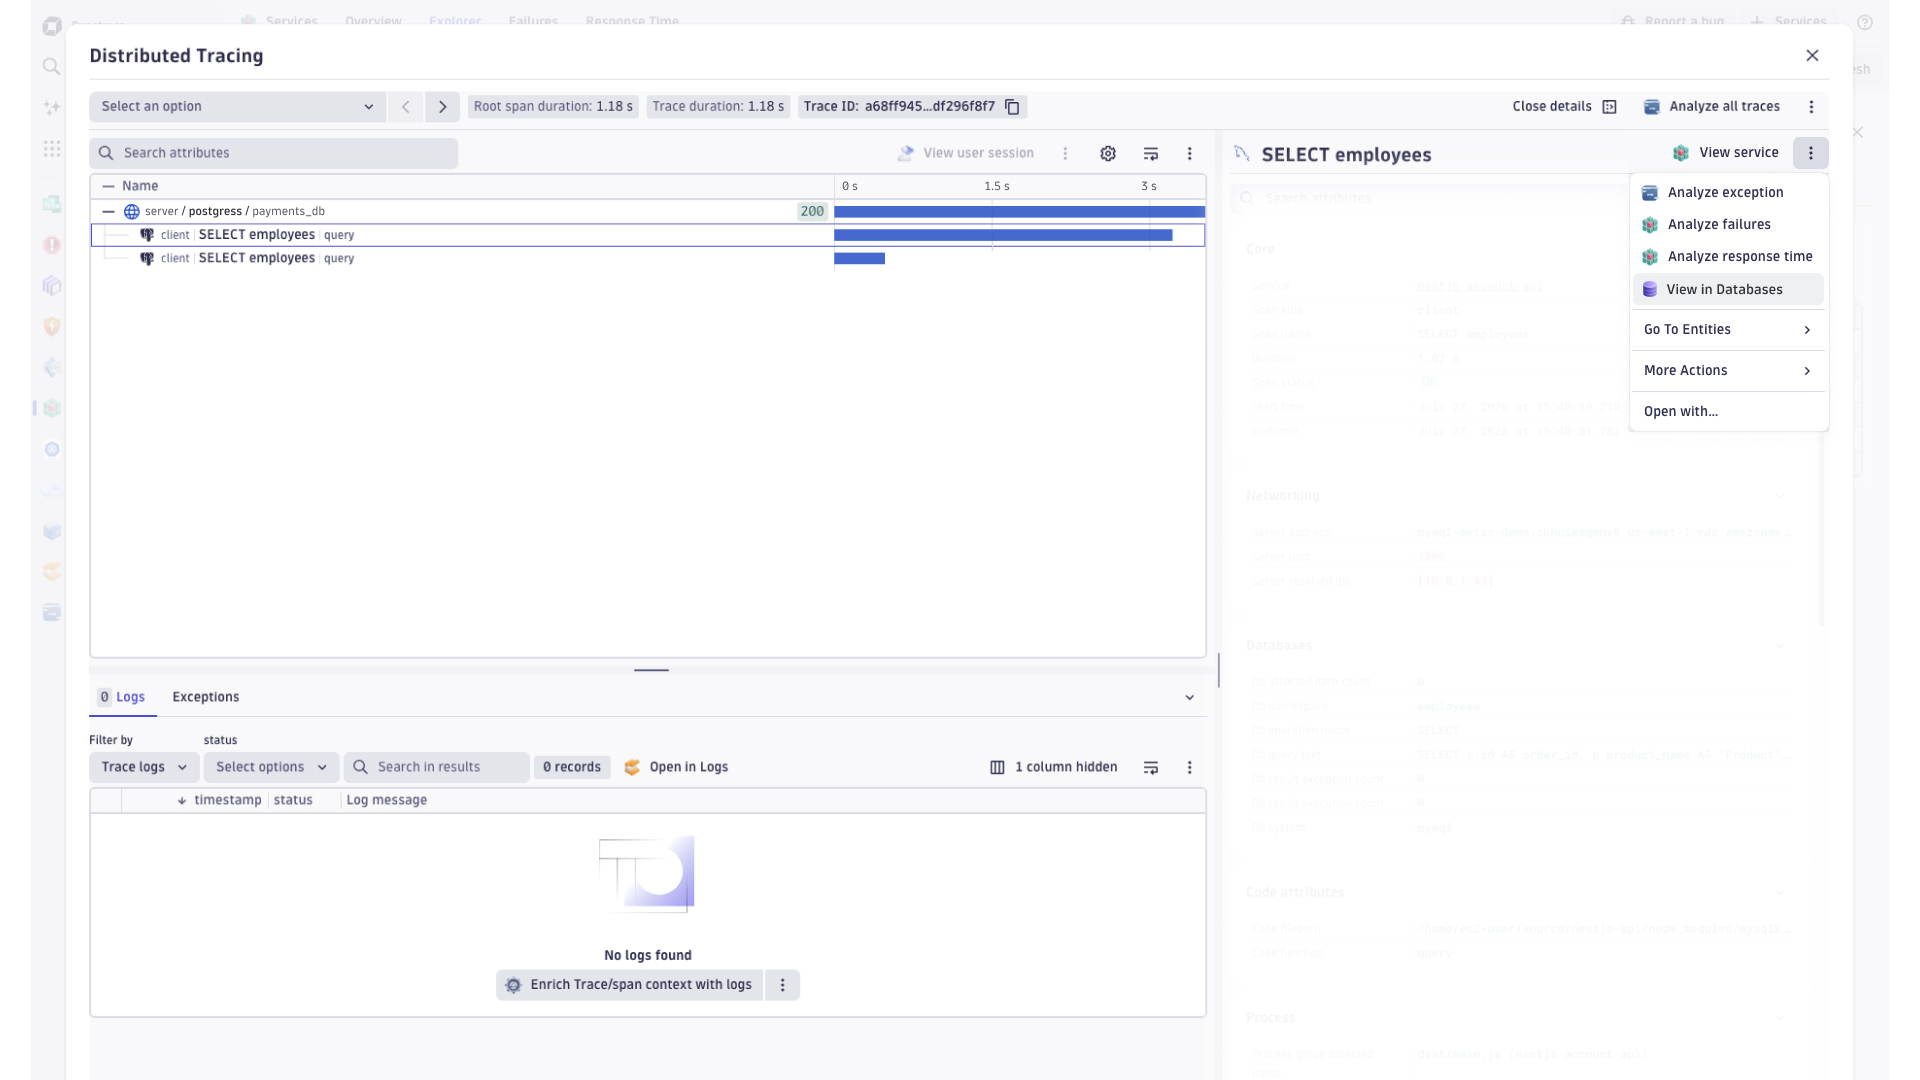
Step 1: Connect the symptom to the database
The engineer opens Dynatrace and finds the payment service in the service map. The distributed trace for the degraded endpoint shows a database span accounting for 3.4 seconds of a 3.7-second request. The span points to a PostgreSQL instance running the payments_db database. Such latency demands an immediate explanation: which query, why now, and what’s the fix.
Traditional monitoring tools weren’t built to answer those questions. They lack query-level granularity, execution plan context, and any sense of priority; leaving engineers to piece together the root cause manually. But that’s where Dynatrace comes in.
Step 2: Find the query
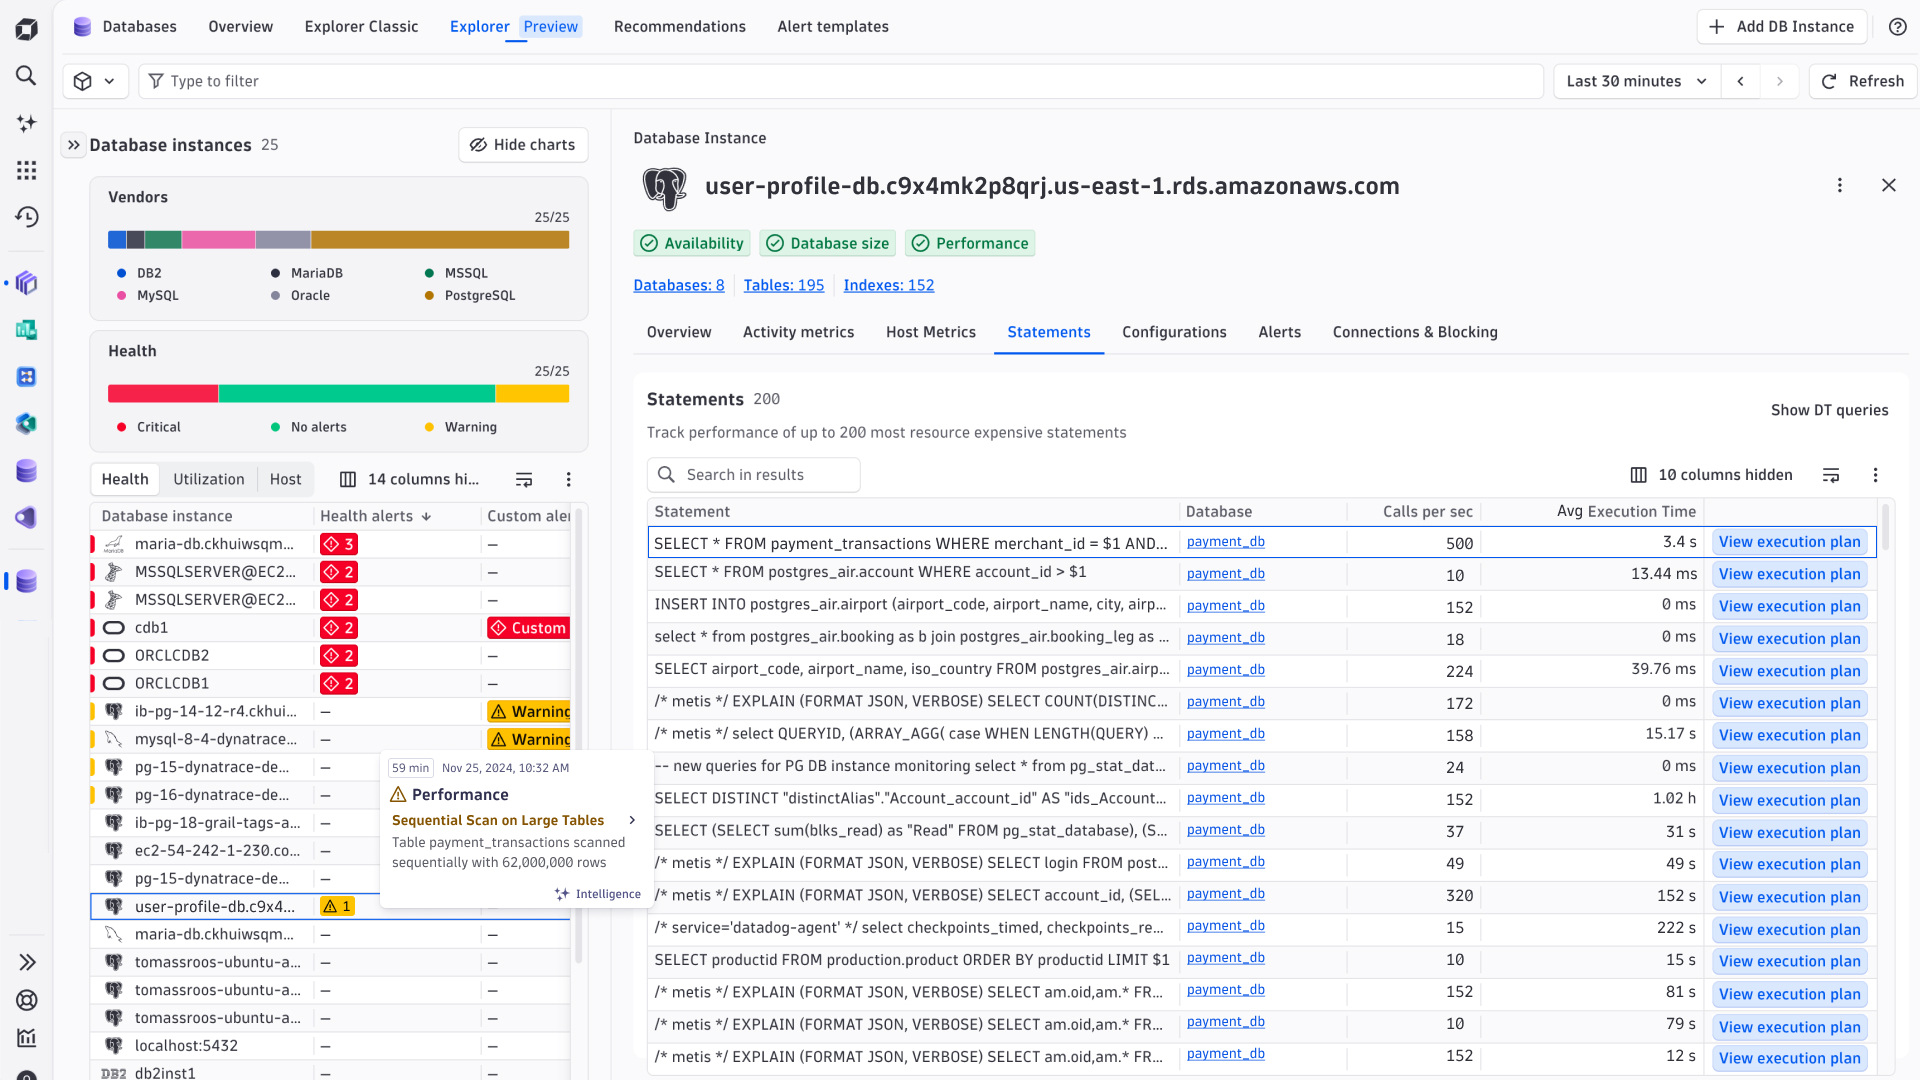
The engineer navigates to the Database App for the payments_db instance. The Statements tab loads immediately, sorted by total execution time over the last hour. One query is accounting for 71 percent of all execution time—a SELECT on the payment_transactions table — with 1.8 million calls in the last hour. It is clearly visible that call volume is up 340 percent compared to the prior hour.
Step 3: Read the execution plan
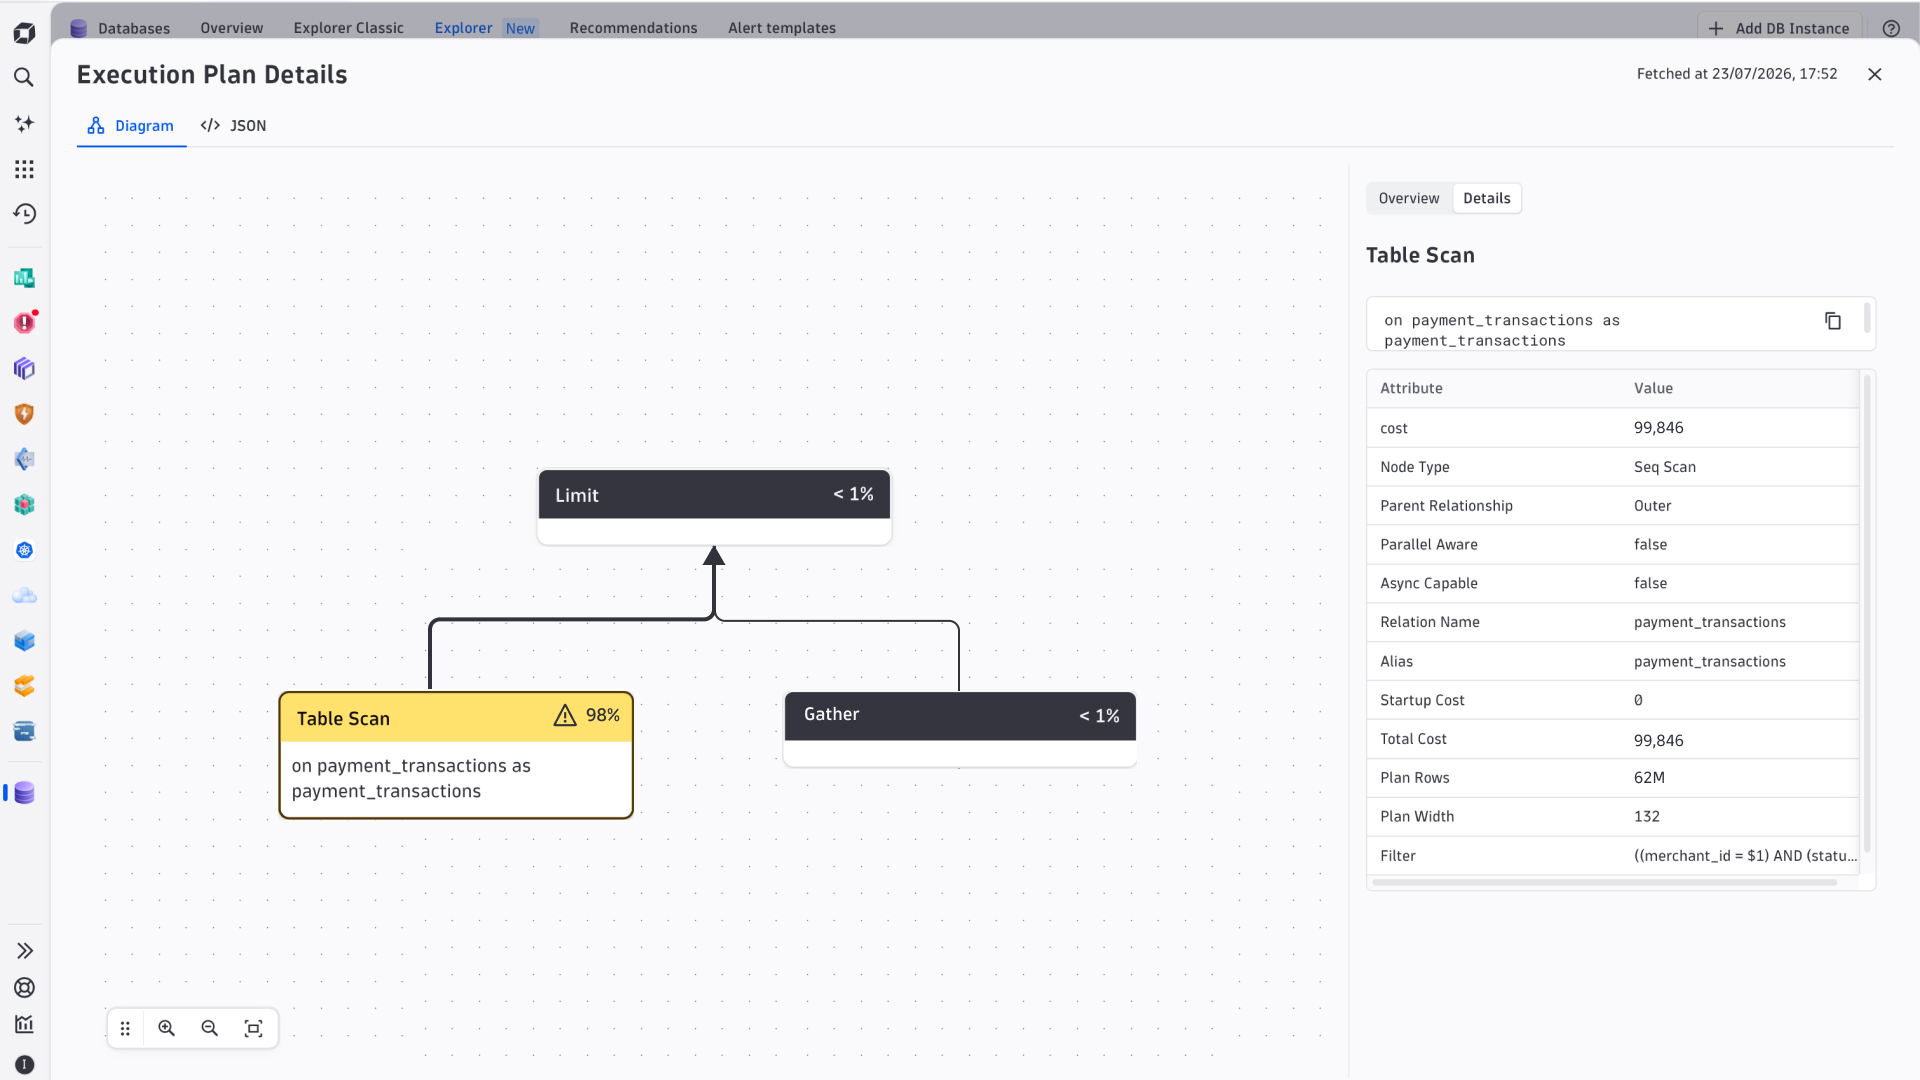
The engineer clicks the query and opens the Execution Plan tab. The visualization renders immediately. The plan has three nodes: a Seq Scan on payment_transactions, a Filter, and a Limit. The Seq Scan node is highlighted in red and accounts for 97% of the total plan cost.
Below the diagram, an insight is surfaced inline:
SEQUENTIAL_SCAN_ON_LARGE_TABLE · Critical
This query is performing a full sequential scan on payment_transactions (estimated 62 million rows). An index on the filtered columns (merchant_id, status) would allow the planner to use an index scan and dramatically reduce I/O.
Step 4: Fix it
The engineer clicks on the Summarize with AI button and gets analysis and suggested fix with reasoning from Dynatrace Intelligence. In this example it is to create a new INDEX:
CREATE INDEX CONCURRENTLY idx_payment_transactions_merchant_status
ON payment_transactions (merchant_id, status);
Within two minutes of the index becoming active, the plan switches to an Index Scan. In this hypothetical situation, average execution time drops from 4.5ms to 0.08ms. p99 latency on the payment service returns to 180ms.
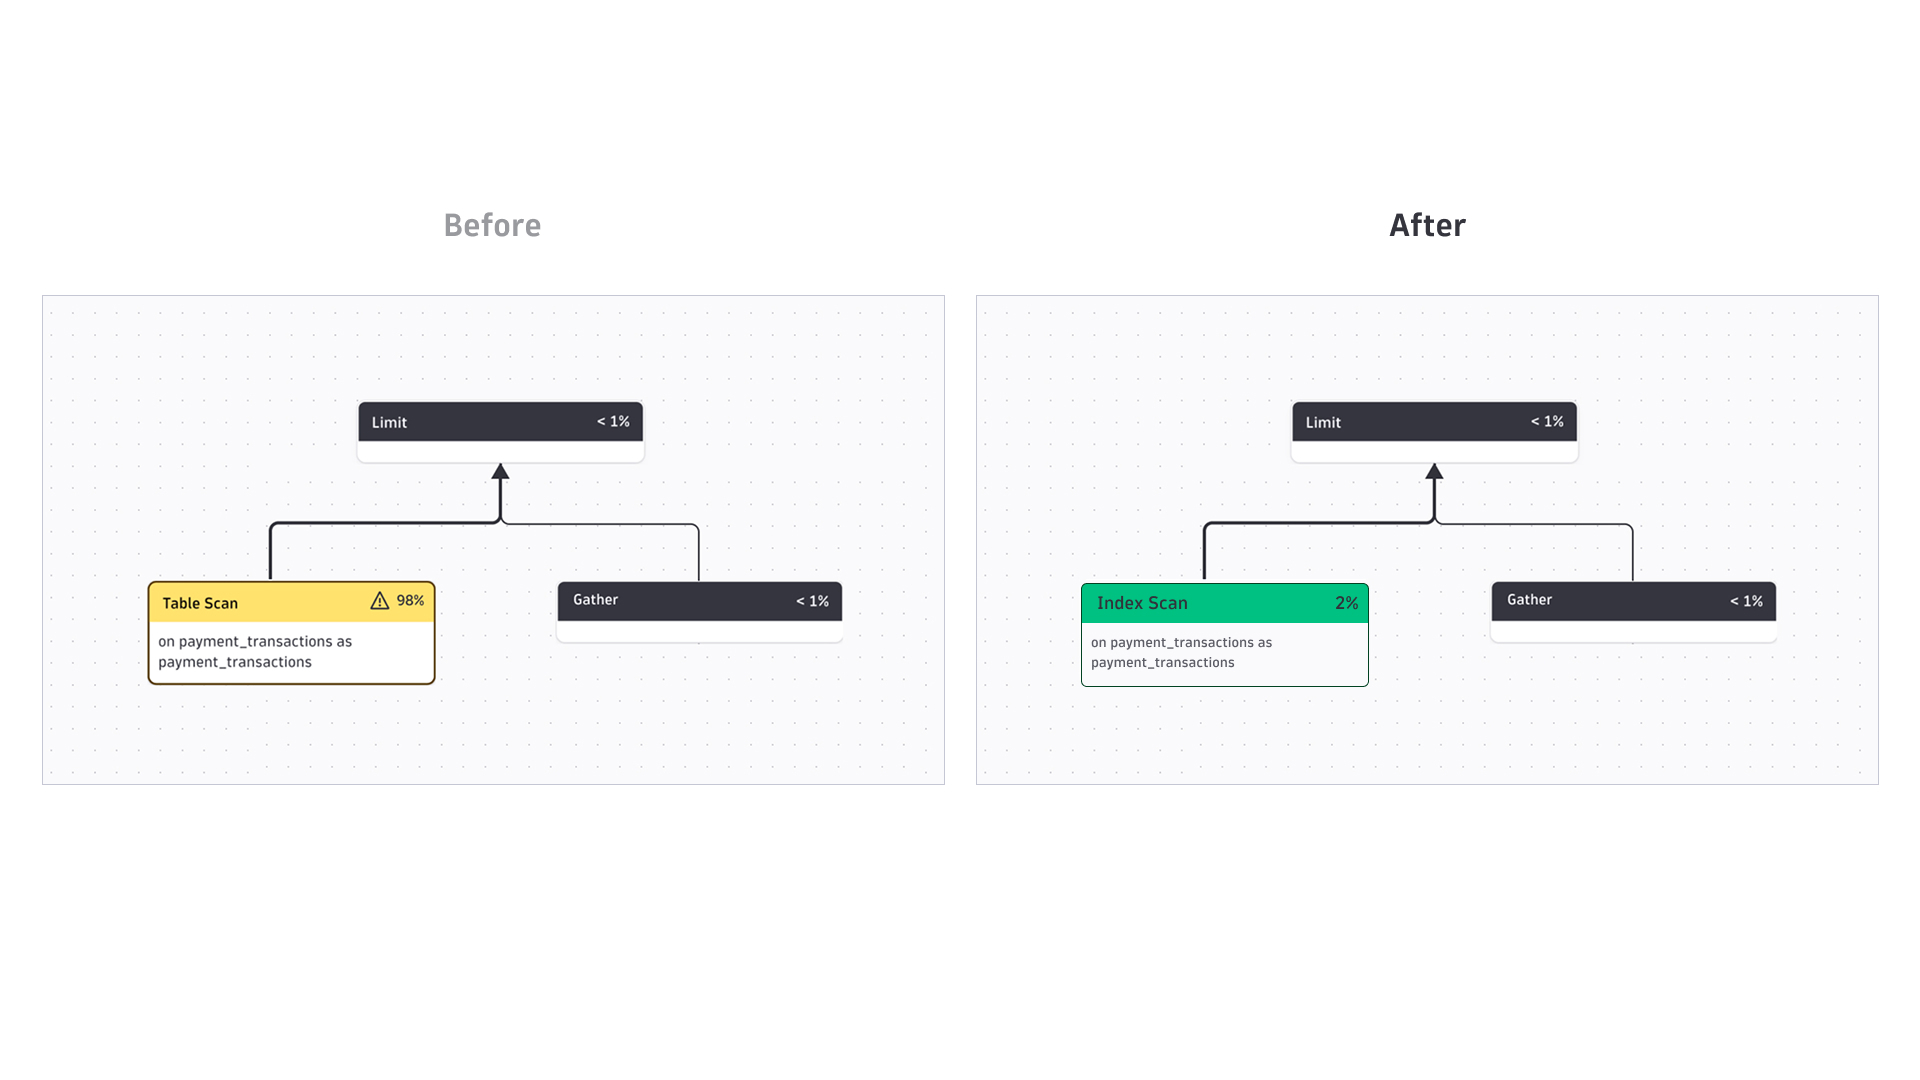
Total time from alert to resolution: 9 minutes. In this illustrative scenario, total time from alert to resolution was 9 minutes; actual results vary. The engineer had no prior knowledge of this specific database schema. However, with AI-powered analysis and suggested remediation guidance provided by Dynatrace, the engineer was able to more accurately and efficiently determine the best approach to preserve user experience and resolve the issue before significant business impact occurred. Dynatrace did all the tedious background work. Comprehensive visibility from Dynatrace put the necessary data in context and subsequently provided a deterministic solution that worked on the first try.
Built for the cloud-native and AI era
Closing The DBA gap in modern engineering
Given the current computing landscape in which there are fewer dedicated DBAs and an ever-expanding amount of database services, the potential for confusion and unchecked complexity has ballooned. Dynatrace Database App is built for this reality. The analysis engine encodes the judgment of database experts directly into the platform. You don’t need to know what transaction ID wraparound means to understand that your database has a critical problem and the command needed to fix it. This can save time and money, allowing resources to be redirected towards innovation and higher-impact initiatives across the organization.
AI agents are making databases ephemeral — and plentiful
AI agents don’t just query databases — they spin them up. A coding agent provisions a PostgreSQL instance for working memory. An orchestration agent creates one to track task state. When the job is done, the instance is torn down. Databases have gone from long-lived infrastructure to ephemeral, short-lived resources spun up and discarded within a single workflow lifecycle.
The operational consequence is scale. AI-powered workloads can spawn hundreds or thousands of instances where teams once managed dozens — each fully capable of developing configuration problems, table bloat, and slow queries on a compressed timeline. Traditional monitoring wasn’t designed for this. You can’t manually correlate alerts across instances that appear and disappear faster than a human can track them. The only approach that works is automated analysis that fires immediately, without setup — which is exactly what Dynatrace delivers.
Get started
Dynatrace Database App is available today for PostgreSQL and MySQL, with support for additional technologies coming soon.
Don’t let database complexity be the bottleneck that drags down the operational efficiency and business value of your organization — try Dynatrace today.
Ready to experience Dynatrace database monitoring for yourself? Explore the full capabilities today and see how effortless it can be.



Looking for answers?
Start a new discussion or ask for help in our Q&A forum.
Go to forum