
Dynatrace performs measurements of four basic types of host-level resources: CPU, memory, network, and disk. These metrics provide necessary insight into the health of each monitored host in your environment. These metrics are also used to generate resource utilization data, which is taken into account by the Dynatrace AI in analyzing events. The Dynatrace AI analyzes these metrics in combination with other data points and their respective correlations. In this way, the Dynatrace AI can identify the root cause of any problem. You can read more about resource events in Dynatrace Help.
It’s not uncommon to have a troubled service that’s hosted on a particular machine cause a shortage of host resources, which then impact other important services that are hosted on the same machine. Here’s an example of Dynatrace root cause analysis detecting CPU over-utilization as a consequence of a malfunctioning service that has caused other services operating on the same machine to also be negatively impacted:
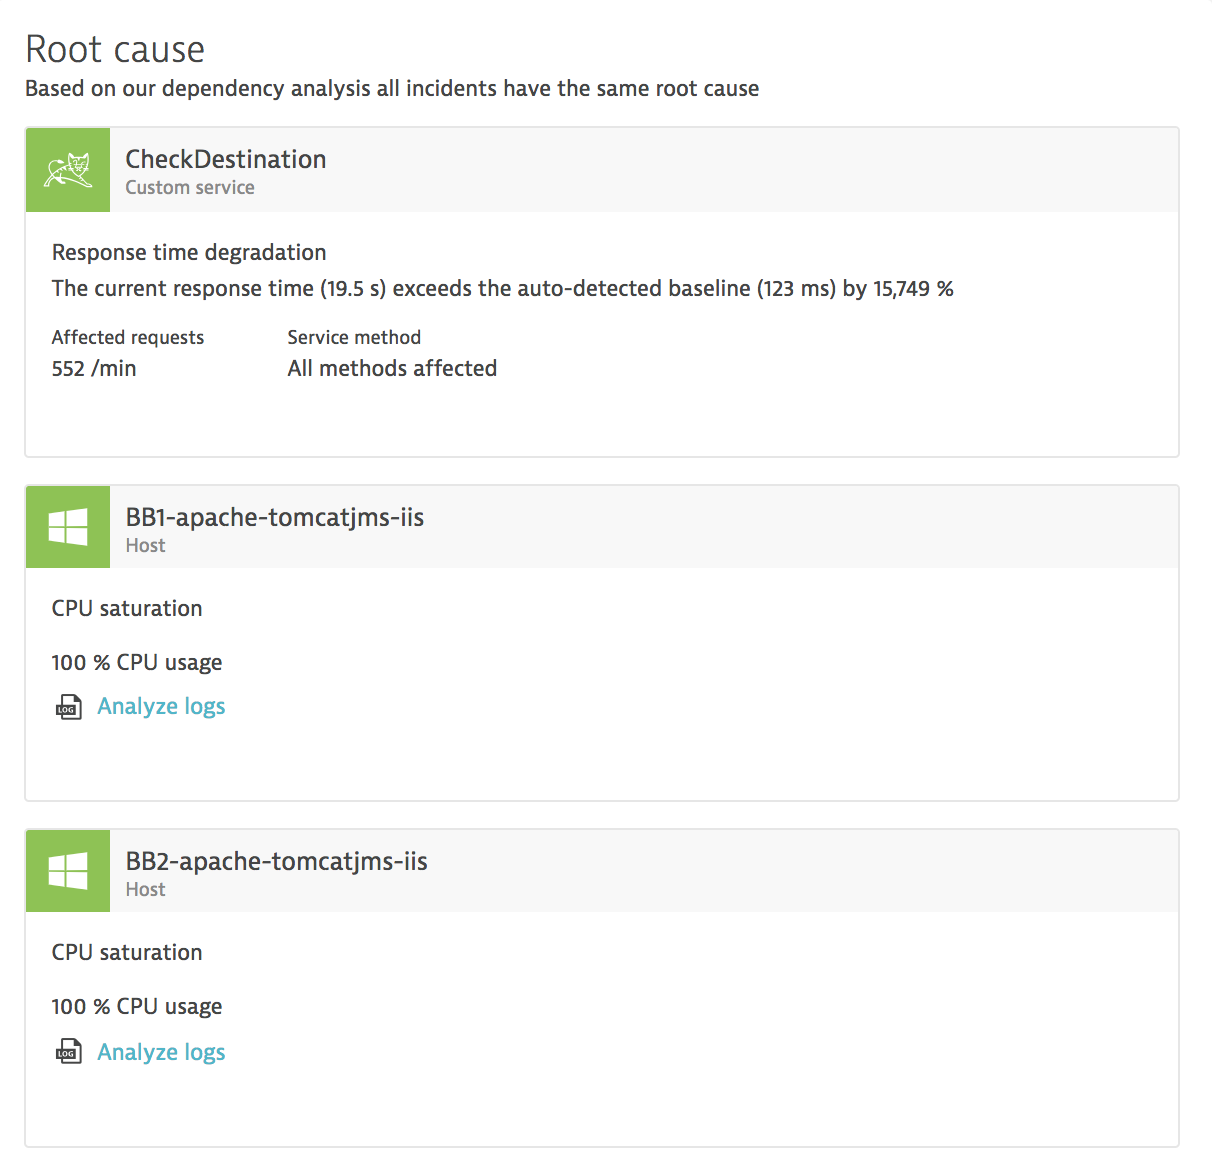
In such cases, more detailed analysis of resource allocation is often performed during problem resolution.
Naturally, the same type of resource shortage problems can also occur at the hypervisor level and impact all hosted virtual machines. This is why it’s important to understand how these resources are used and what the true resource availability is.
Introducing the ‘Reclaimable memory’ metric
The traditional approach to measuring memory at the host level is to split memory into two categories: used and free. This is a simple, yet powerful categorization. It helps in making sense of how much memory is still available for processes and whether or not there is a risk of disk swapping. It also makes it possible to observe growth trends in preparation for system scaling, etc.
However, the definition of used memory isn’t as straightforward as it may seem. Here’s a simple example of a situation that I’m sure you’ve encountered while using your desktop or laptop computers. Imagine you’re copying a large file from a USB drive of questionable speed to a fast local hard drive. The write operations to the local drive are performed by the system in parallel and have a negligible impact on the time taken. If the file is 3 GB, and the USB drive speed is 10 MBs, this operation will take about 5 minutes (3000/10 = 300 seconds, or 5 minutes). But only the first time. Consecutive copy operations performed to other local drives shortly after the first copy take a fraction of the original time, and the time bottleneck typically moves from read to write operations. Consequently, instead of 5 minutes, you only have to wait for around 15 seconds or so.
Why is this?
The primary reason for such a dramatic speed increase with subsequent copy operations has to do with system caching. The operating system knows exactly how much memory is used by all the running processes and how much memory is left. If there is free memory available, the OS uses it for system caches. While this memory is physically used, it simultaneously remains available for any processes that are in need of extra memory allocation. If such a malloc request is made, the system drops the caches and allocates memory to the requesting process.
So, in addition to used and free, we have a third category of memory usage: Reclaimable memory. This type of memory allocation is considered reclaimable because the system can easily reclaim it for other purposes.
With the release of OneAgent version 1.159 and Dynatrace version 1.160, we’re adding the Reclaimable memory category to memory utilization graphs for all monitored operating systems. Here’s what it looks like:
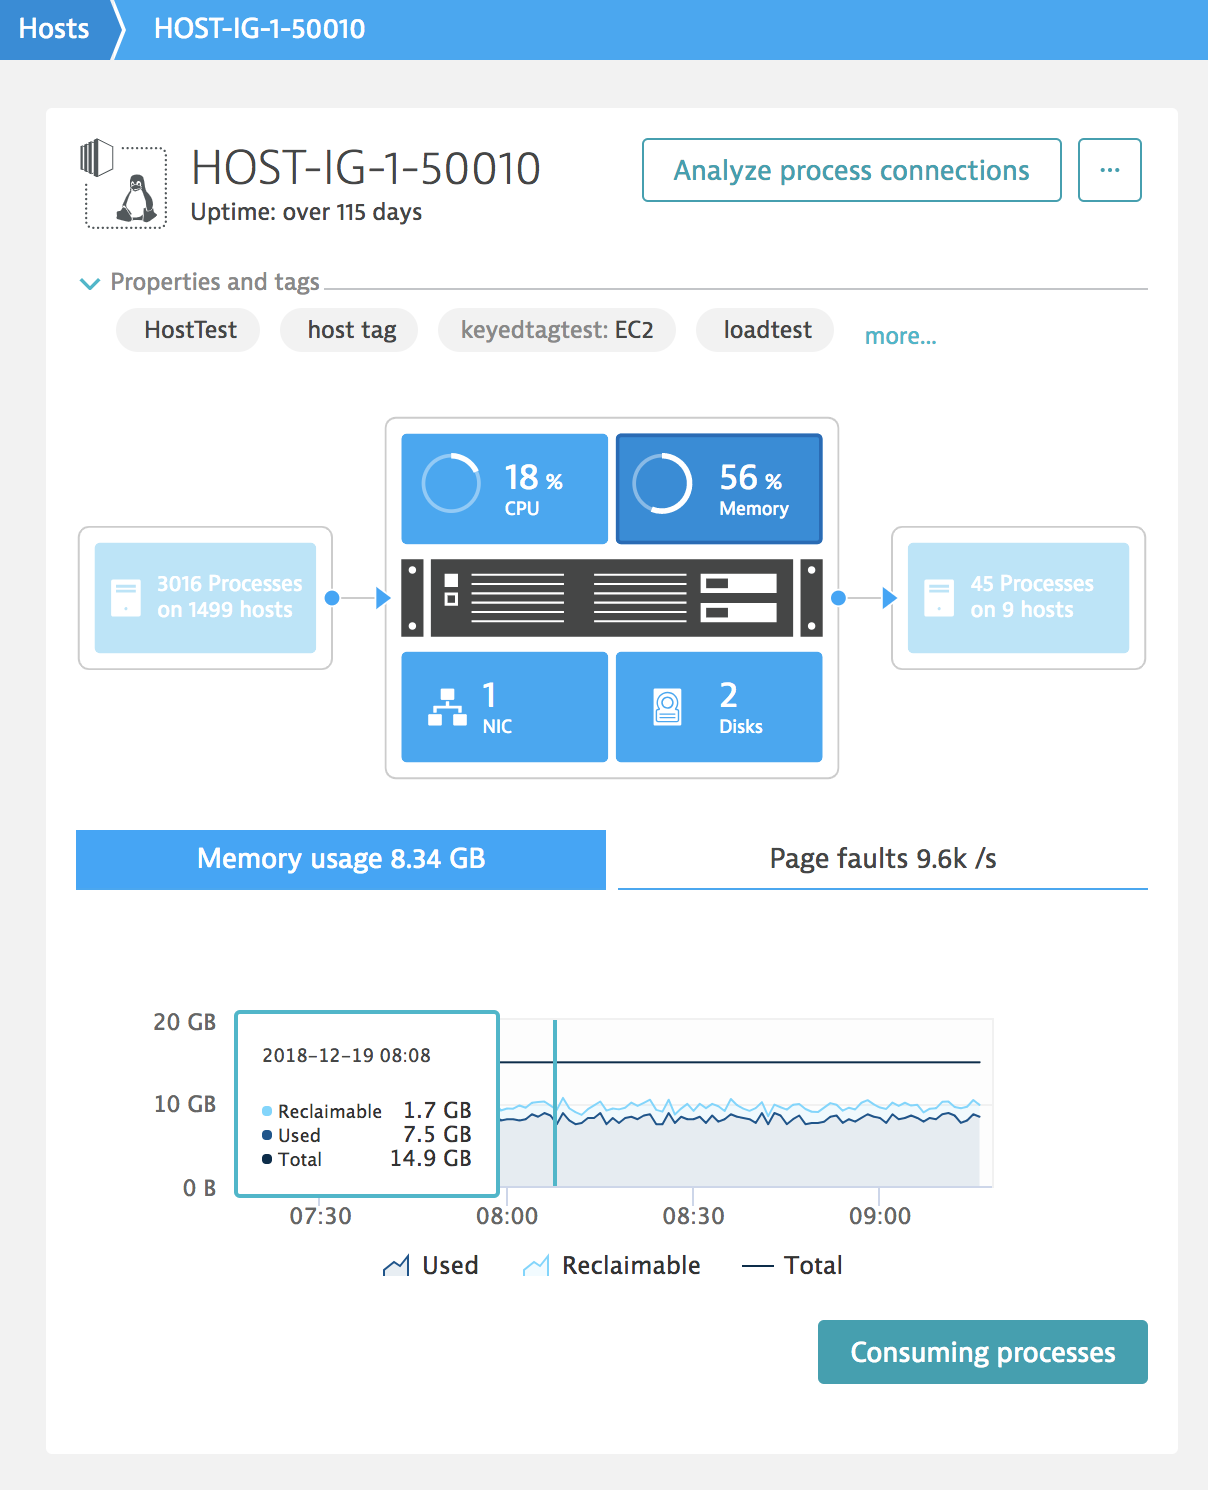
The Memory usage chart is a stack chart, so the total memory allocated by the system (and its caches) and all the running processes is the sum of reclaimable and used. The total memory seen by the system is depicted as a line over the stack graph. The difference between total and allocated memory is shown as the white area under the total memory series line and represents the free memory. At the same time the sum of free and reclaimable memory can be considered available memory for processes running on the system.
Where does this matter most?
If reclaimable memory is indeed truly and transparently reclaimable, what is the point of measuring it in the first place?
To answer the question, it’s important to understand how memory is provisioned on hosts. In the case of physical hosts, where the memory utilization represents the actual physical memory usage (the usage is literally mapped onto the electrical charge of physical memory cells), this metric is probably less useful.
But the percentage of physical hosts as compared to virtual machines is steadily shrinking. We see this trend in Dynatrace analytics. This shouldn’t be a surprise considering the growing footprint of cloud services.
The difference in case of virtual hosts is that the sum of memory configured per guest host (virtual machine) is often larger than the physical memory available at the hypervisor level. This mechanism is often referred to as virtual memory ballooning and is used in multiple virtualization engines, such as VMware, Hyper-V, KVM, and AIX LPARs.
In such cases, detailed understanding of actual memory usage, both by the processes and system caches, is important for correct resource management.
How is reclaimable memory calculated by system tools?
You may wonder how the measurements shown in Dynatrace analysis views correspond to what the built-in system tools return. To understand this, you need to understand how memory measurements are collected by system tools. Let’s take a look at how this is done on Linux systems:
labuser@ubuntu:~$ free
total used free shared buff/cache available
Mem: 8174316 226192 4287056 13204 3661068 7590064
Swap: 8388604 0 8388604
In case of Linux, used = total – free – buff/cache. Such a construction has historical reasons that date from before the Linux kernel was able to report on available memory. Here is a quote from the page man for the free command:
available
Estimation of how much memory is available for starting new applications, without swapping. Unlike the data provided by the cache or free fields, this field takes into account page cache and also that not allreclaimable memory slabs will be reclaimed due to items being in use (MemAvailable in /proc/meminfo, available on kernels 3.14, emulated on kernels 2.6.27+, otherwise the same as free)
It is similar if you read the /proc/meminfo directly:
labuser@ubuntu:~$ cat /proc/meminfo
MemTotal: 8174316 kB
MemFree: 4275912 kB
MemAvailable: 7588712 kB
And this is consistent with other commands such as top.
In comparison, used memory is calculated by OneAgent as follows: used = total – available. So, in other words, used = MemTotal - MemAvailable and consequently reclaimable memory is calculated as reclaimable = MemAvailable - MemFree.
So the used memory metric displayed in Dynatrace analysis views is not equal to the used memory metric displayed by system tools. At the same time, it’s important to remember that system tools report used memory the way they do due to historical reasons, and that this particular method of calculating used memory isn’t really representative of how the Linux kernel manages memory in modern systems. The difference in these measurements is in fact quite significant, too.
Feedback
The Reclaimable memory metric is available with OneAgent version 1.159 and Dynatrace version 1.160 for all OSs for which we collect system-level memory information.
Have comments or questions? Please reach out to us on Dynatrace Community, through Dynatrace Customer Support, or via your Dynatrace Account Manager.


Looking for answers?
Start a new discussion or ask for help in our Q&A forum.
Go to forum