

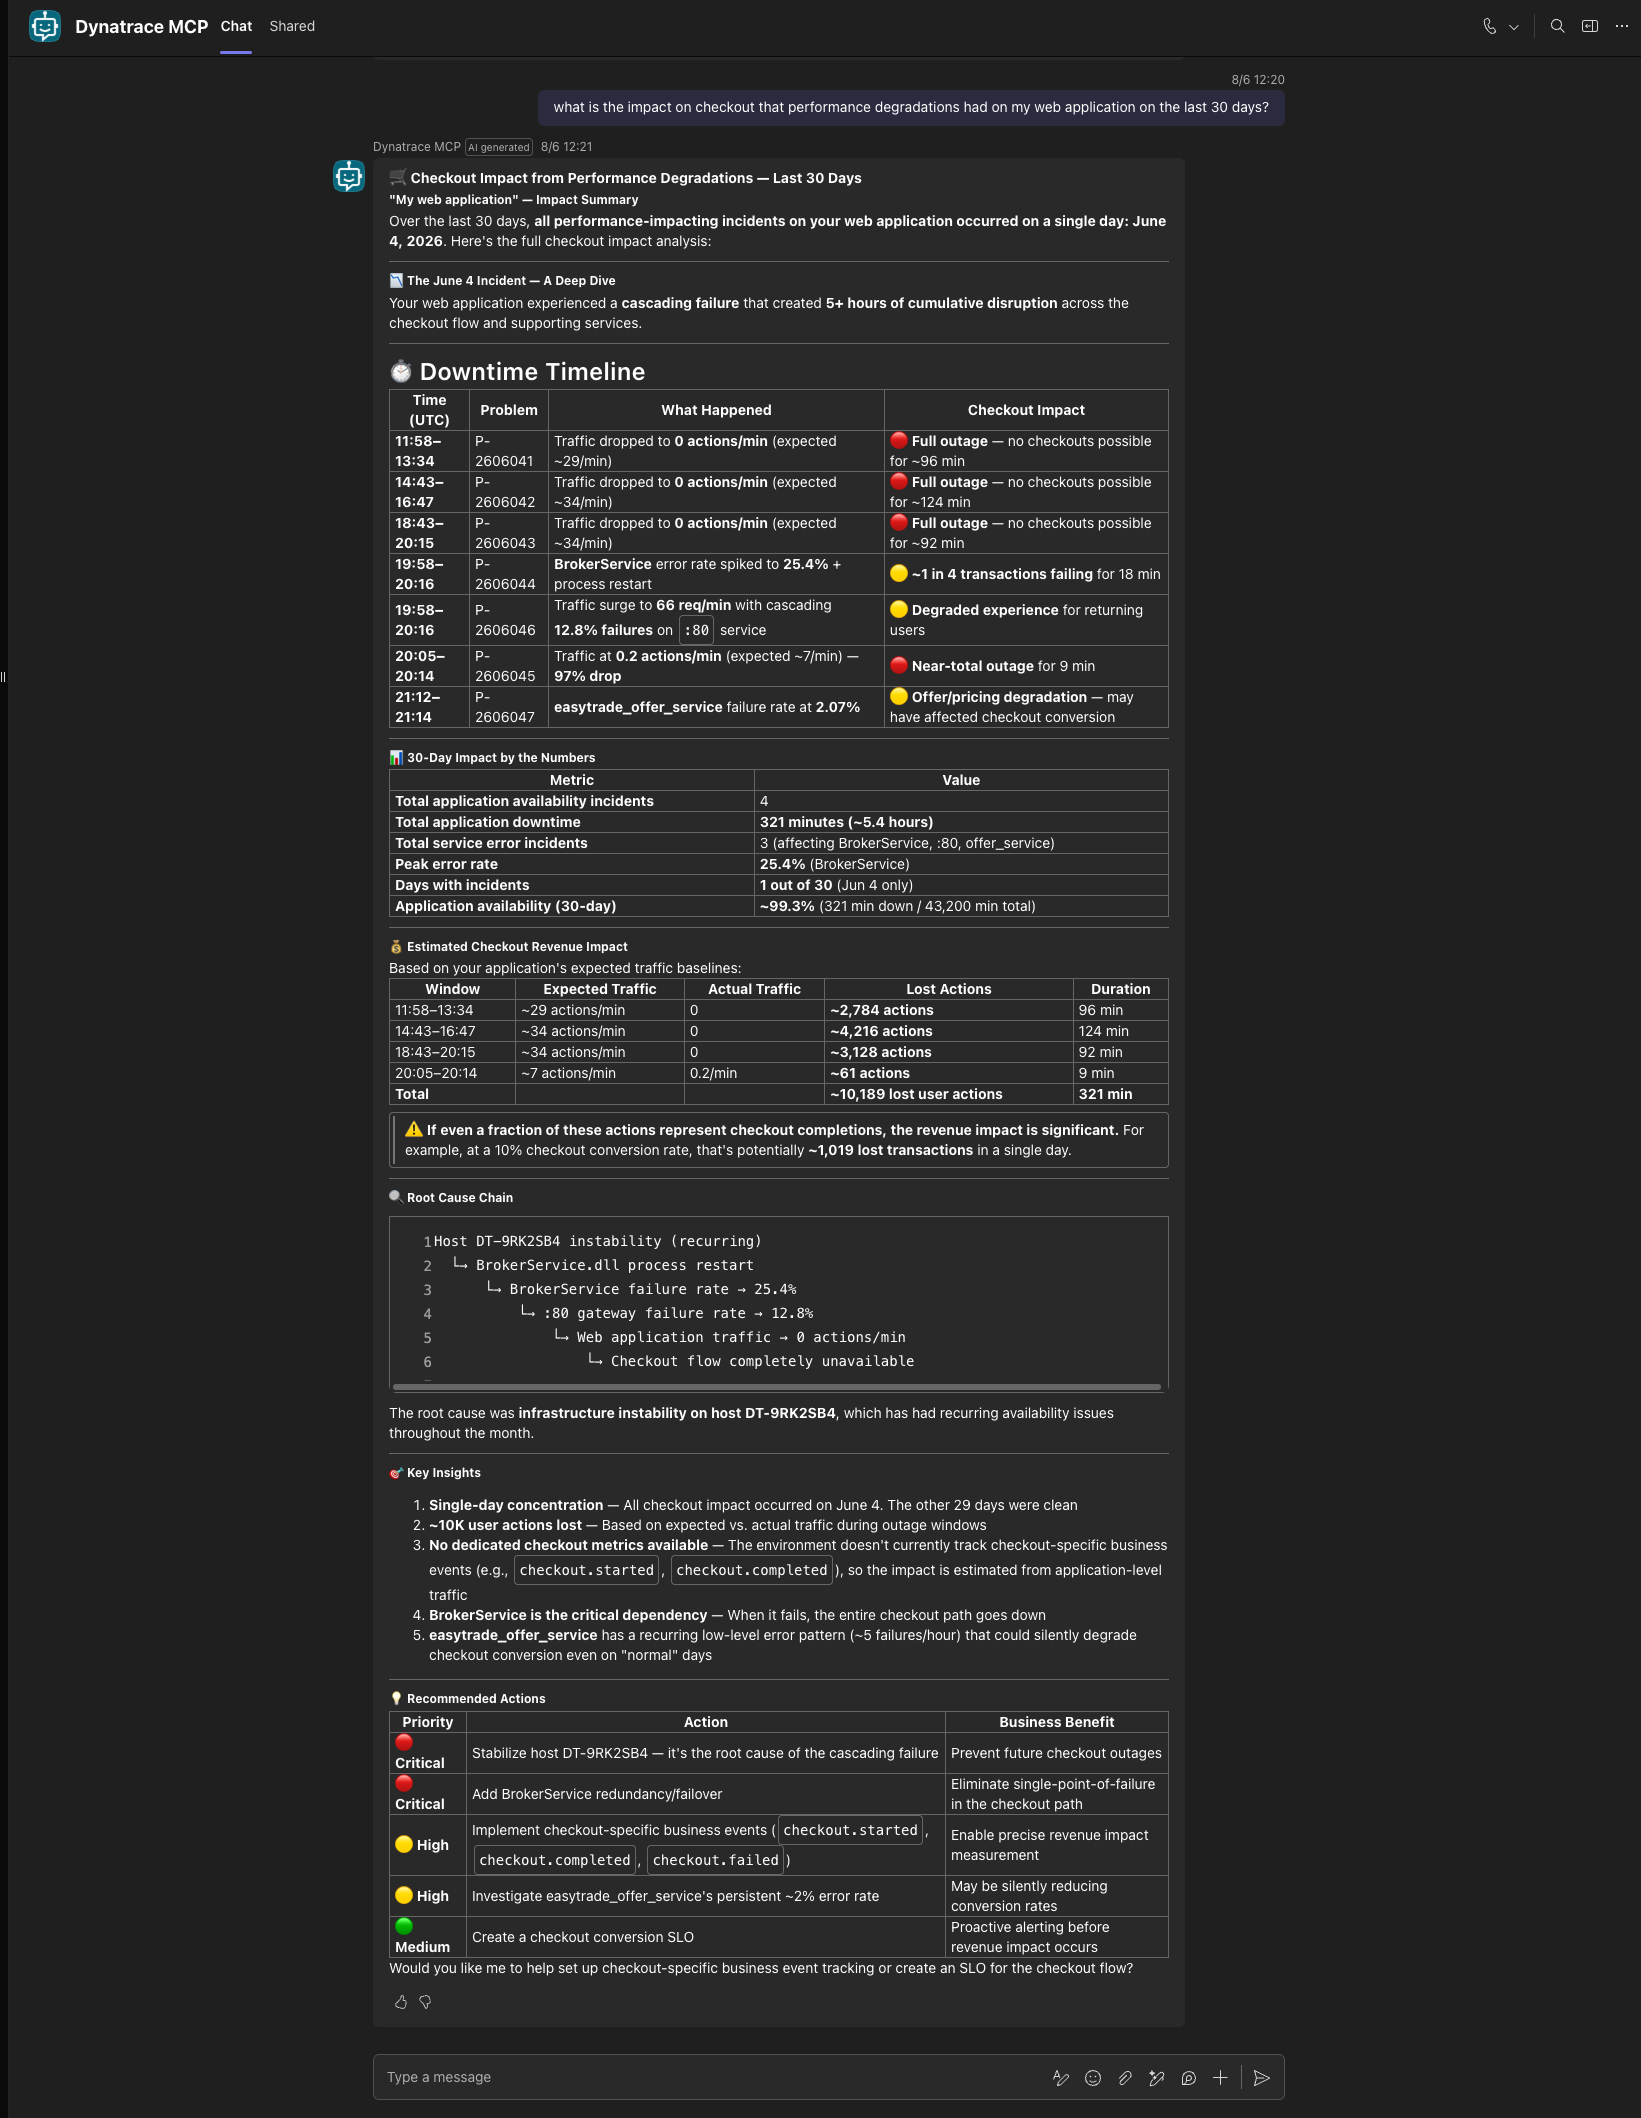
A product leader notices a dip in checkout conversions shortly after a release. So they ask on Microsoft Teams: ”Are customers abandoning checkout because of the new experience, or is something else going on?”
An engineer starts pulling together information from multiple places: deployment records, service health data, application performance metrics, and user experience telemetry. A few minutes and a dozen messages later, the team is still assembling context before anyone can answer the original question.
This kind of back-and-forth is common in modern software organizations. The data and expertise are there, but business users — the people who most need answers about customer experience, business processes, and revenue impact — typically can’t get those answers without routing through someone with access to the right tools.
Dynatrace Business Observability, connected to Microsoft Teams via the Dynatrace MCP server and Microsoft Copilot Studio, changes this. MCP is the connection layer that gives AI assistants direct, live access to your Dynatrace environment so business users can ask questions about application health, customer journeys, and business process performance directly in Teams, on desktop or mobile, and get answers grounded in real Dynatrace data.
Why put observability into Teams?
The Dynatrace MCP (Model Context Protocol) server exposes Dynatrace capabilities to external AI agents. Access to data and available responses is governed by the permissions, policies, and controls configured in your Dynatrace and Microsoft environments. Rather than relying on a model’s general knowledge, an MCP-connected agent can access Dynatrace tools and context to answer questions about your environment. In practice, this means an AI assistant can use Dynatrace data while responding to user requests. Teams become the front end for operational knowledge while Dynatrace remains the system providing the underlying context.
Instead of navigating tools, users can simply ask:
- “Did the time to process claims improve after the last release?”
- “Are any business processes impacted by the current IT issue?”
- “Which customers have been impacted by technical issues during onboarding?”
- “Where can we optimize IT cost across the quote process?”
Instead of switching between tools, users can often get answers in the same conversation, grounded in the available data.
Architecture overview
At a high level, the architecture is simple:
Microsoft Teams → User asks a question
Copilot Studio agent → Interprets the request and determines which tools to use
Dynatrace MCP → Retrieves relevant Dynatrace context
Dynatrace platform → Provides the underlying observability data
The user never needs to interact directly with Dynatrace. They simply ask a question in Teams and receive a response grounded in Dynatrace information.
Step 1: Create an agent in Copilot Studio
Start by creating a new agent in Copilot Studio. You may want to name the agent “Talk to Dynatrace” to make it clear that this agent is accessing Dynatrace to get precise information about the environment.
Define the role of the agent and provide clear instructions about the types of questions it should answer.
For example, you might instruct the Dynatrace agent to:
- Help users understand application and infrastructure health
- Explain performance issues
- Identify likely root causes
- Summarize release impact
- Recommend next investigation steps
The more context you provide about your environment, applications, and business processes, the more useful the responses will be.
Step 2: Add Dynatrace knowledge and skills
To improve the quality of responses, consider using resources from the Dynatrace for AI project.
These skills, prompts, and instructions give the agent guidance on how to work with Dynatrace and can help standardize interactions.
Think of them as reusable building blocks that help the agent understand how to ask better questions and interpret Dynatrace results more effectively.
Step 3: Configure the MCP connection
Next, create a connection between Copilot Studio and the Dynatrace MCP server.
You’ll need:
- Access to your Dynatrace environment
- A Dynatrace platform token with the required permissions
- The appropriate MCP server endpoint
Once configured, the agent gains access to Dynatrace tools and context through MCP.
At that point, the agent can begin using Dynatrace information when answering questions.
Step 4: Test with real-world questions
Before rolling the solution out broadly, test it using actual questions your teams ask every day.
For example:
- “Why is journey abandon increasing?”
- “What changed before this incident started?”
- “How many orders were affected because of the incident?”
- “Can you give me a list of user IDs for re-targeting?”
- “Are any business processes currently affected by IT Issues?”
- “Did this deployment increase business process outcome?”
Testing with real scenarios helps identify gaps in both the agent instructions and the available context.
Step 5: Publish to Microsoft Teams
Once you’re satisfied with the results, publish the agent to Microsoft Teams.
Now anyone with access can interact with the agent directly from Teams on desktop or mobile.
Instead of opening Dynatrace first, users can start with a question.
The agent can handle retrieving and summarizing the available information.
Start with one workflow
It’s tempting to make the agent answer everything on day one. Don’t. A better approach is to start with a single, high-value use case:
- Incident triage
- Release validation
- Service health questions
- Developer troubleshooting
Prove the value, gather feedback, and expand from there.
Learn more about the Dynatrace MCP server and how you can use it to maximize your efficiency.


Looking for answers?
Start a new discussion or ask for help in our Q&A forum.
Go to forum