



Newcomers to Dynatrace want to see what the platform can tell them about their own environment as quickly and simply as possible. With a self-service path to get started, developers, SREs, and other practitioners can try Dynatrace on their own terms, ingest real telemetry, and reach the answers and insights that matter with minimal effort.
In this blog, you learn how to go from signing up for the Dynatrace free trial to seeing your first insights in just a few steps.
What is QuickStart, and how can you get insights fast?
We built the new QuickStart app to make it easy to unlock the value of Dynatrace, especially for developers and engineers who need modern observability for their cloud and AI initiatives. QuickStart is the new onboarding experience for the Dynatrace free trial, allowing you to ingest telemetry and analyze service health in minutes with dtwiz, our new zero-config Dynatrace setup wizard. QuickStart is designed to simplify onboarding, allow exploration without upfront commitment, and help users begin analyzing telemetry from their own environment within minutes.
The QuickStart app is available in all Dynatrace SaaS environments with version 1.343. Whether you’re exploring the platform through a Dynatrace free trial or helping new users get up to speed quickly in an existing Dynatrace environment, QuickStart and dtwiz are designed to deliver on a simple goal: help users reach meaningful insights during their first session.
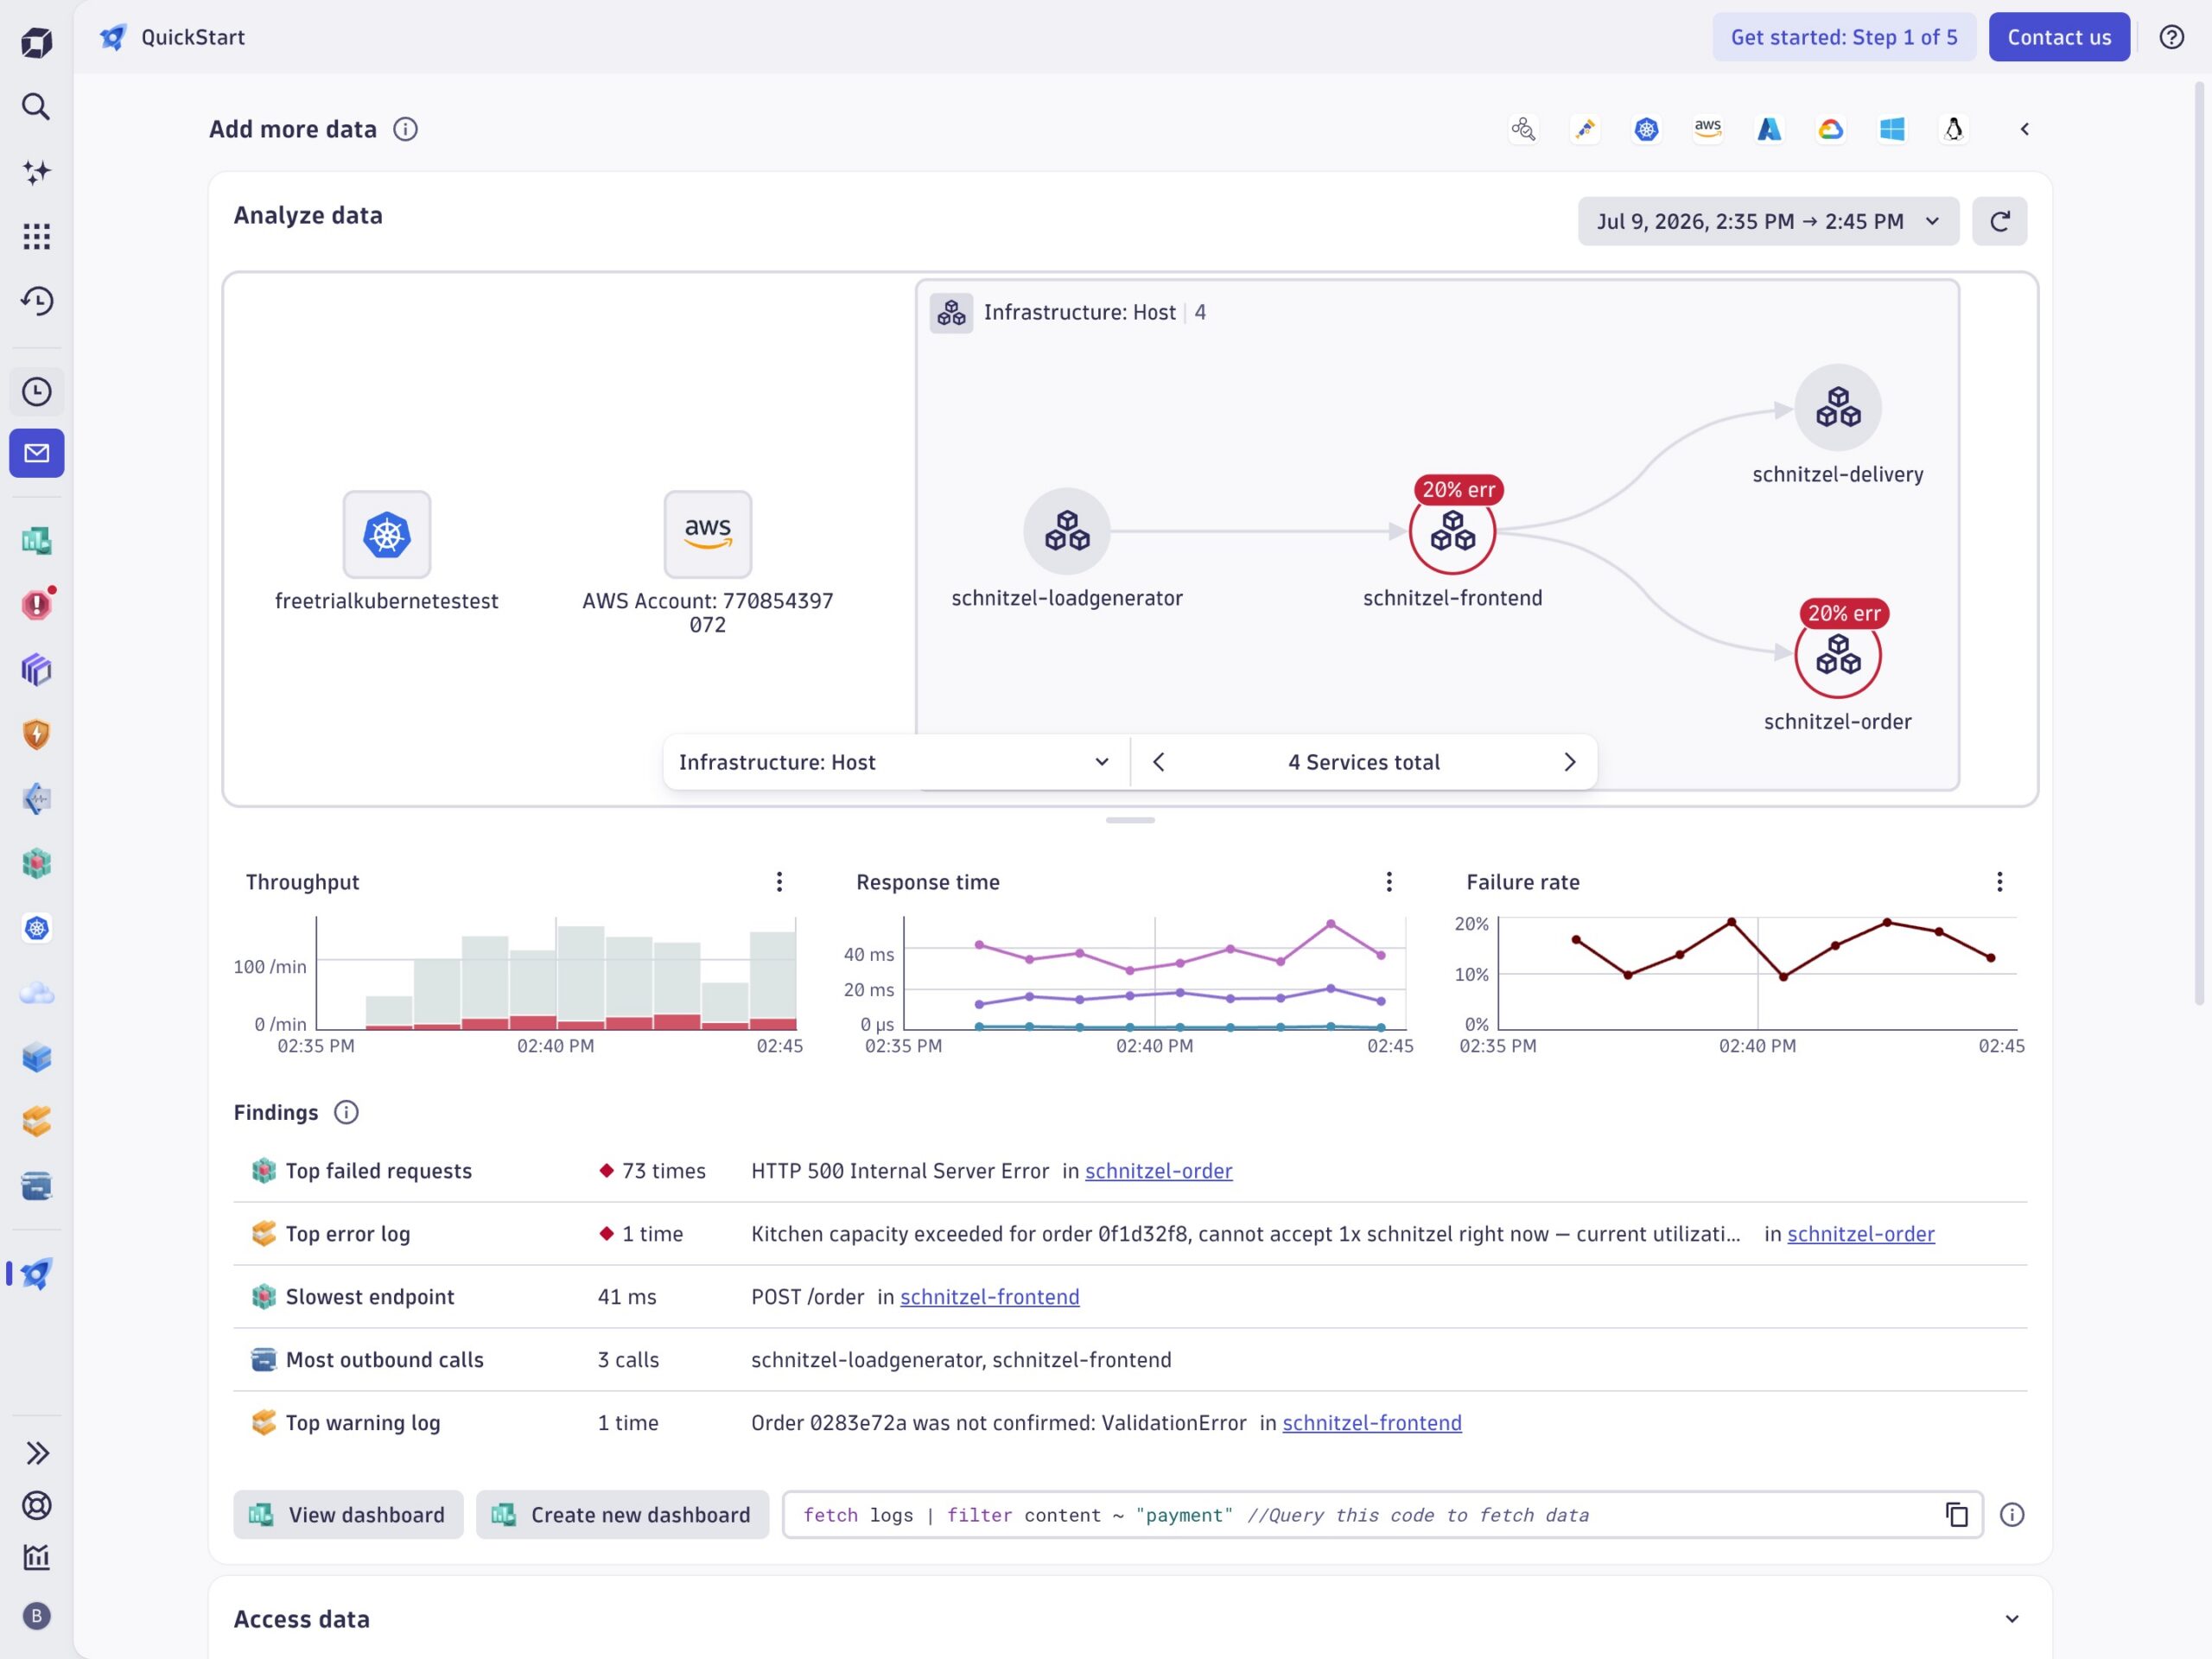
QuickStart is your launchpad for adding data
The QuickStart app provides a row of one-click data-source tiles covering the most common starting points, including Auto Discovery, OpenTelemetry, Kubernetes, AWS, Azure, GCP, Windows, and Linux hosts.
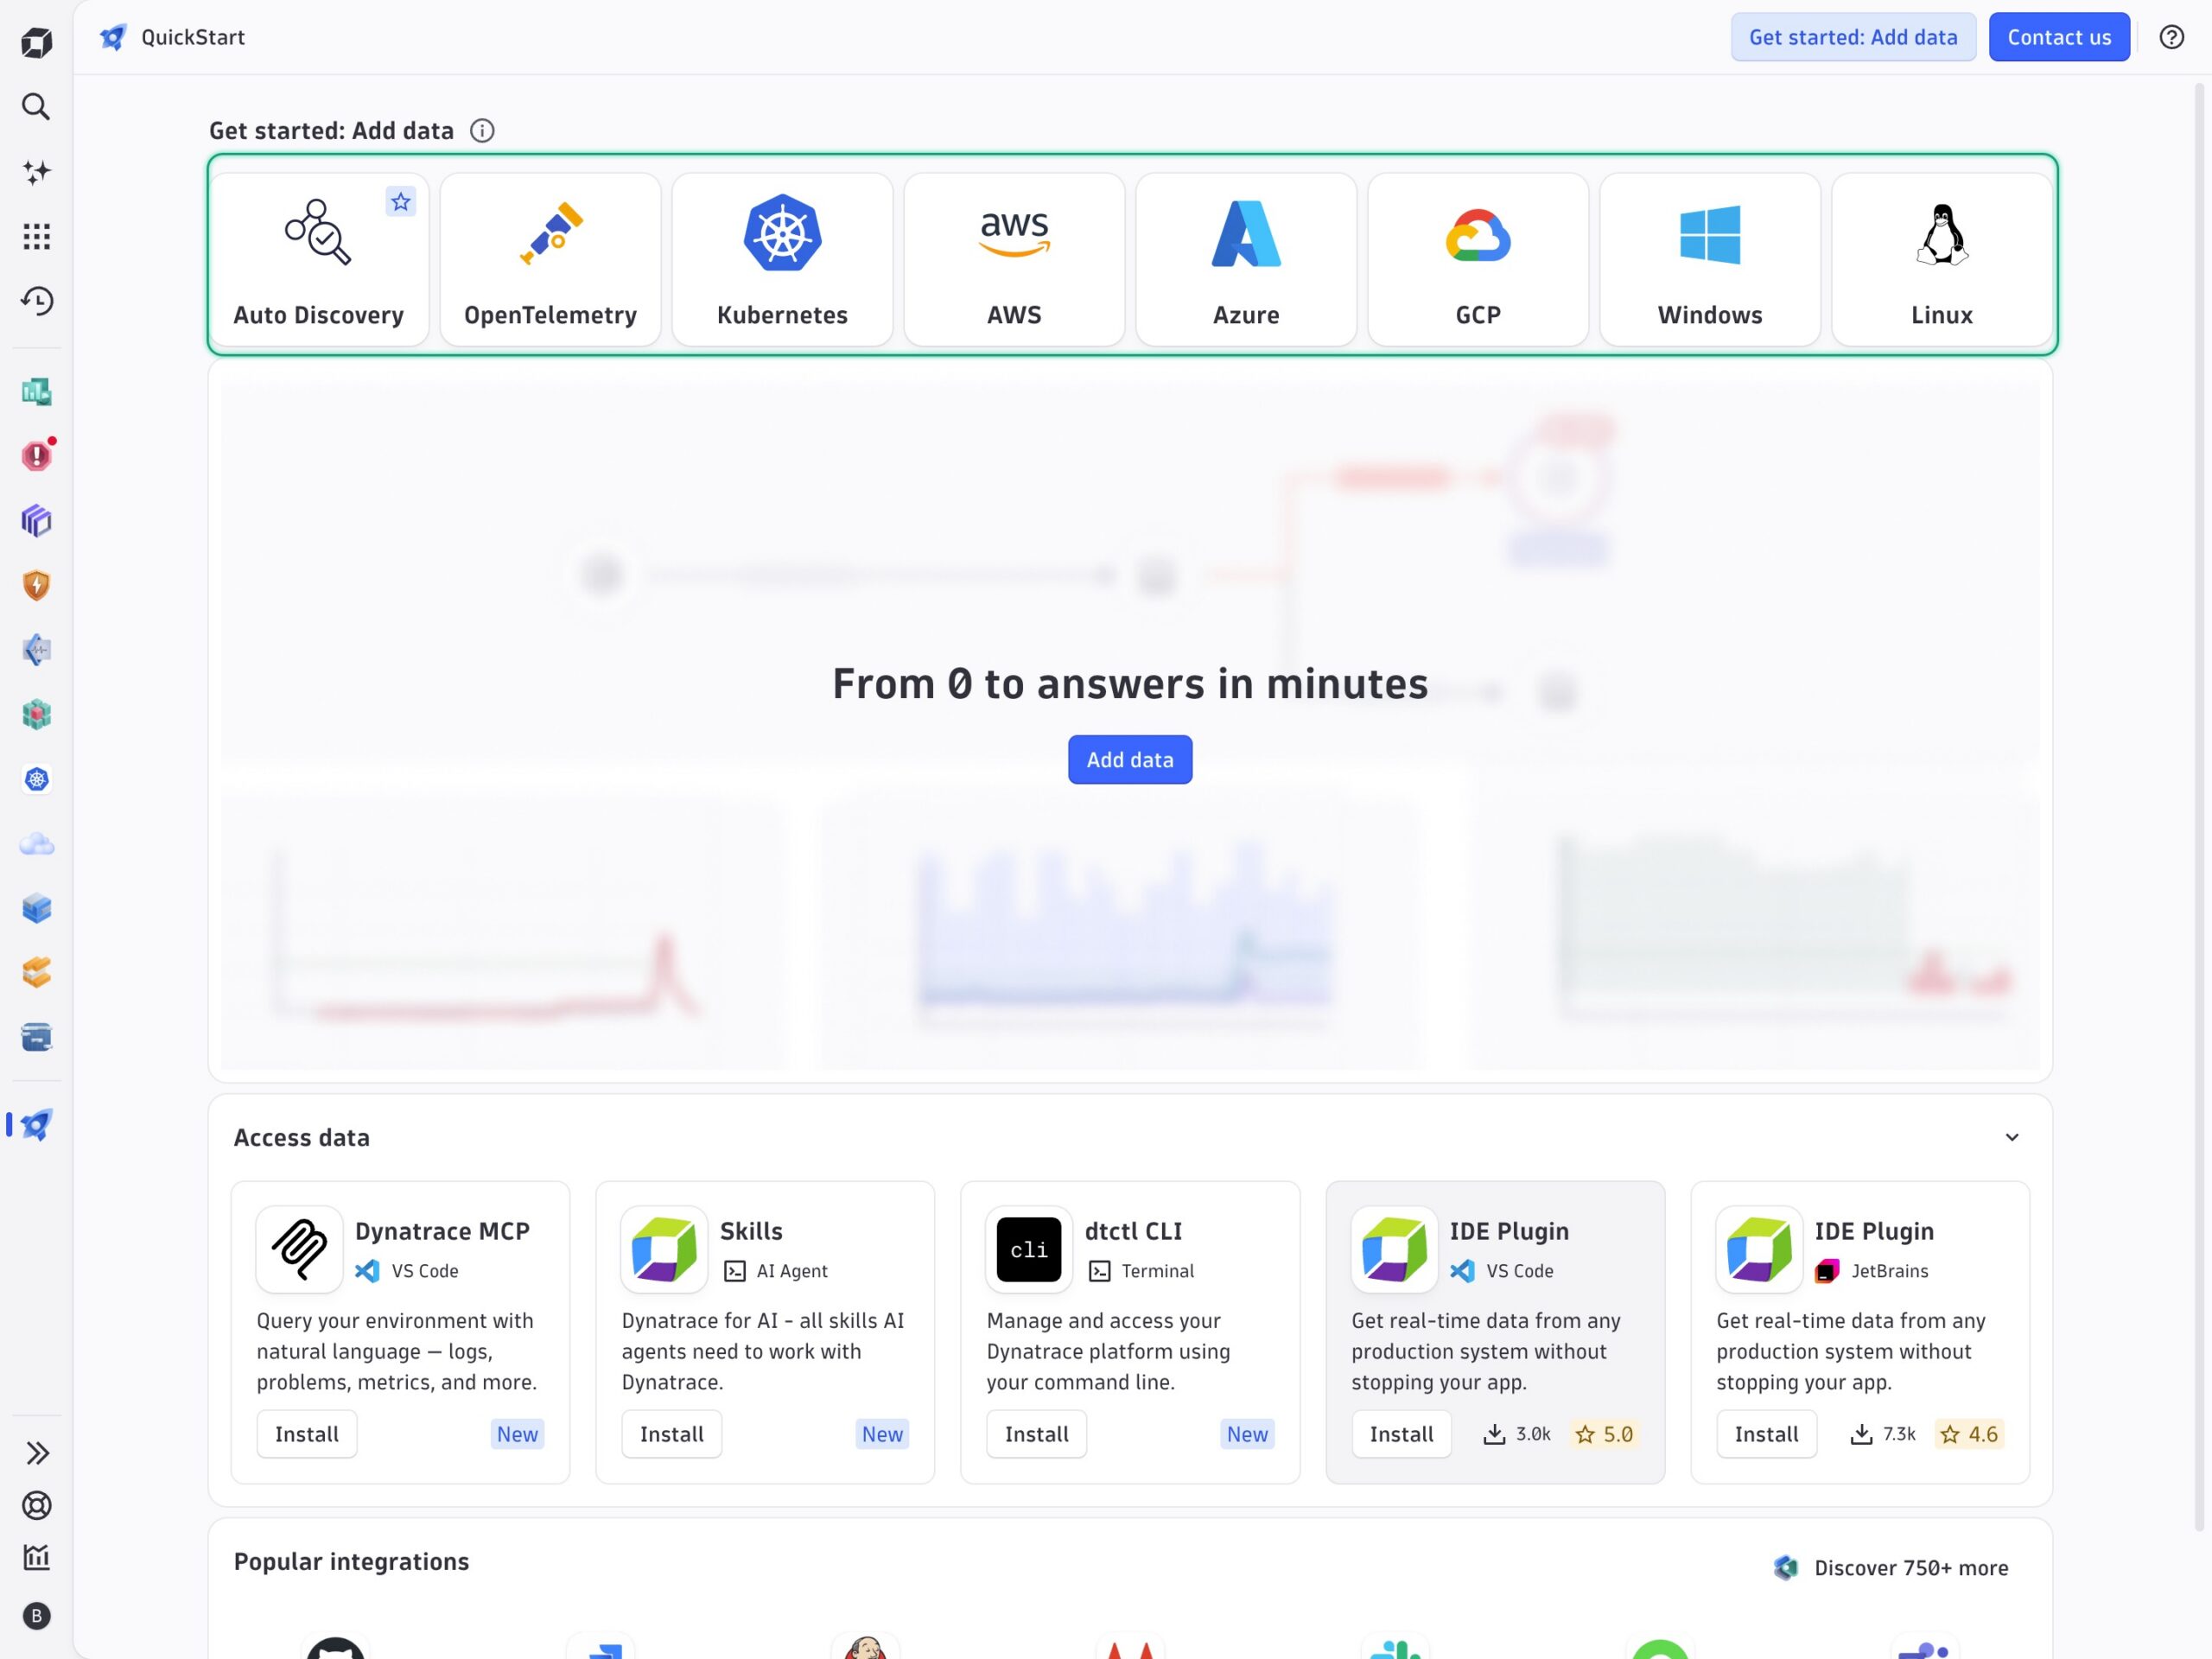
Above the tiles, a progress tracker guides you through a simple, staged flow – Add data → Analyze data → Create dashboard → Invite users – so you always know what’s next. It’s a guided path that meets you wherever your workloads already live. When the onboarding flow reaches Get started: Complete, you’re no longer looking at sample data: you can begin exploring telemetry and findings from your own environment. QuickStart includes the new Auto Discovery onboarding option, a streamlined way to start monitoring your services. click a source – for example, Auto Discovery – and QuickStart gives you everything you need to start ingesting data in a single copyable block.
Under Run command in terminal, with tabs for both Mac/Linux and Windows, you’ll find a short script containing the commands you need to get started fast. Running these commands in the terminal of your machines downloads the latest version of the Dynatrace installer.
dtwiz: one command to ingest your data – no configuration needed
Two things make this easy. First, the environment URL and platform token are pre-filled for your trial – copy, paste, run. Second, dtwiz handles the heavy lifting and recommends the next steps. It installs and configures the OpenTelemetry collector, instruments local services — for example, Python, Go, and Java — and starts monitoring platforms such as Kubernetes, AWS, Azure, and GCP. For supported scenarios, dtwiz can automatically forward telemetry with minimal manual configuration.
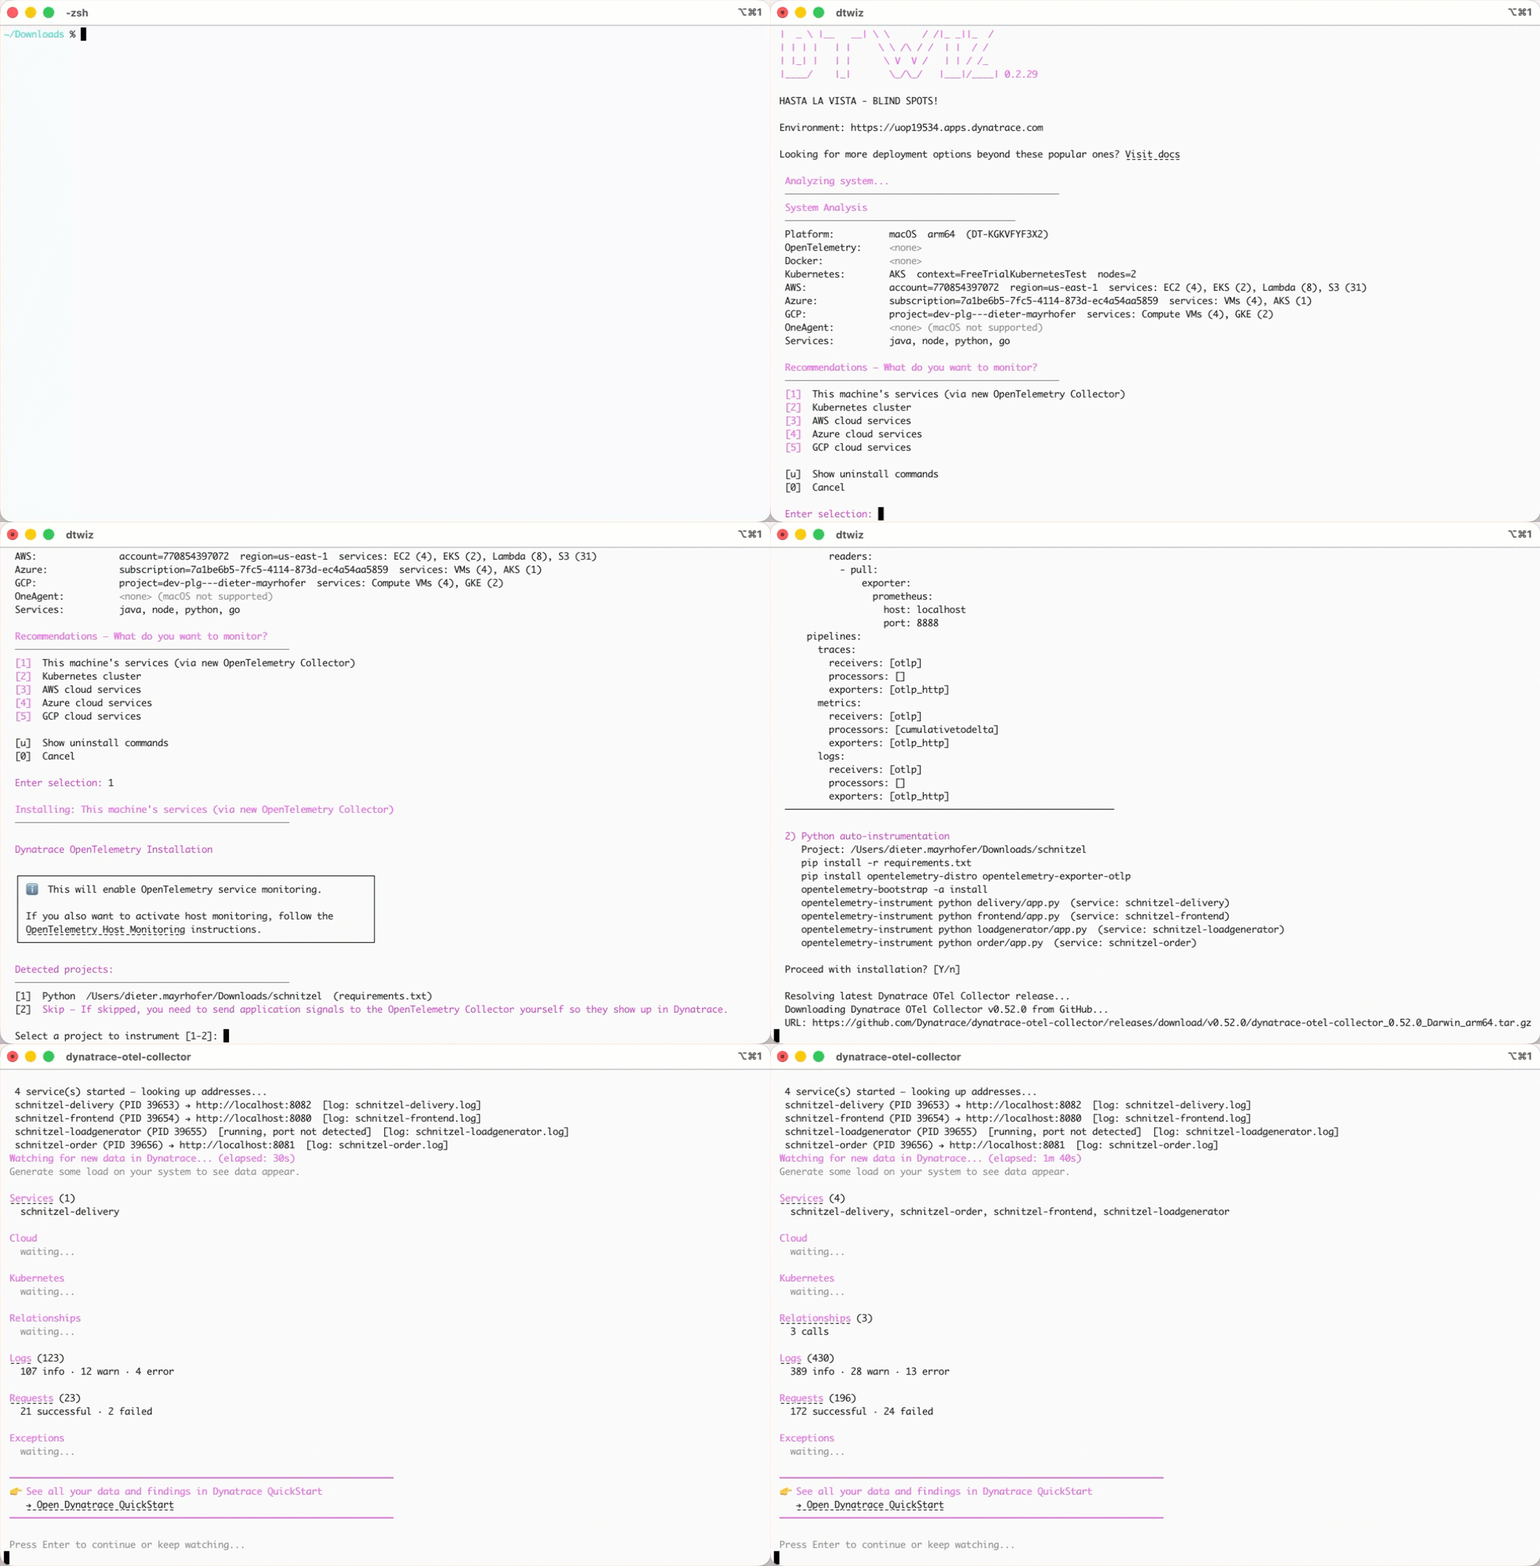
While dtwiz runs, QuickStart doesn’t leave you guessing. A Watching for new data panel for live data sits right below the command, showing the progress and then alerting you when your first spans, logs, and metrics arrive. You watch your environment come alive in real time.
From raw data to answers
As soon as data lands, the flow advances to Analyze data, and within moments, you’re looking at a live dependency map of your own services (Figure 3).
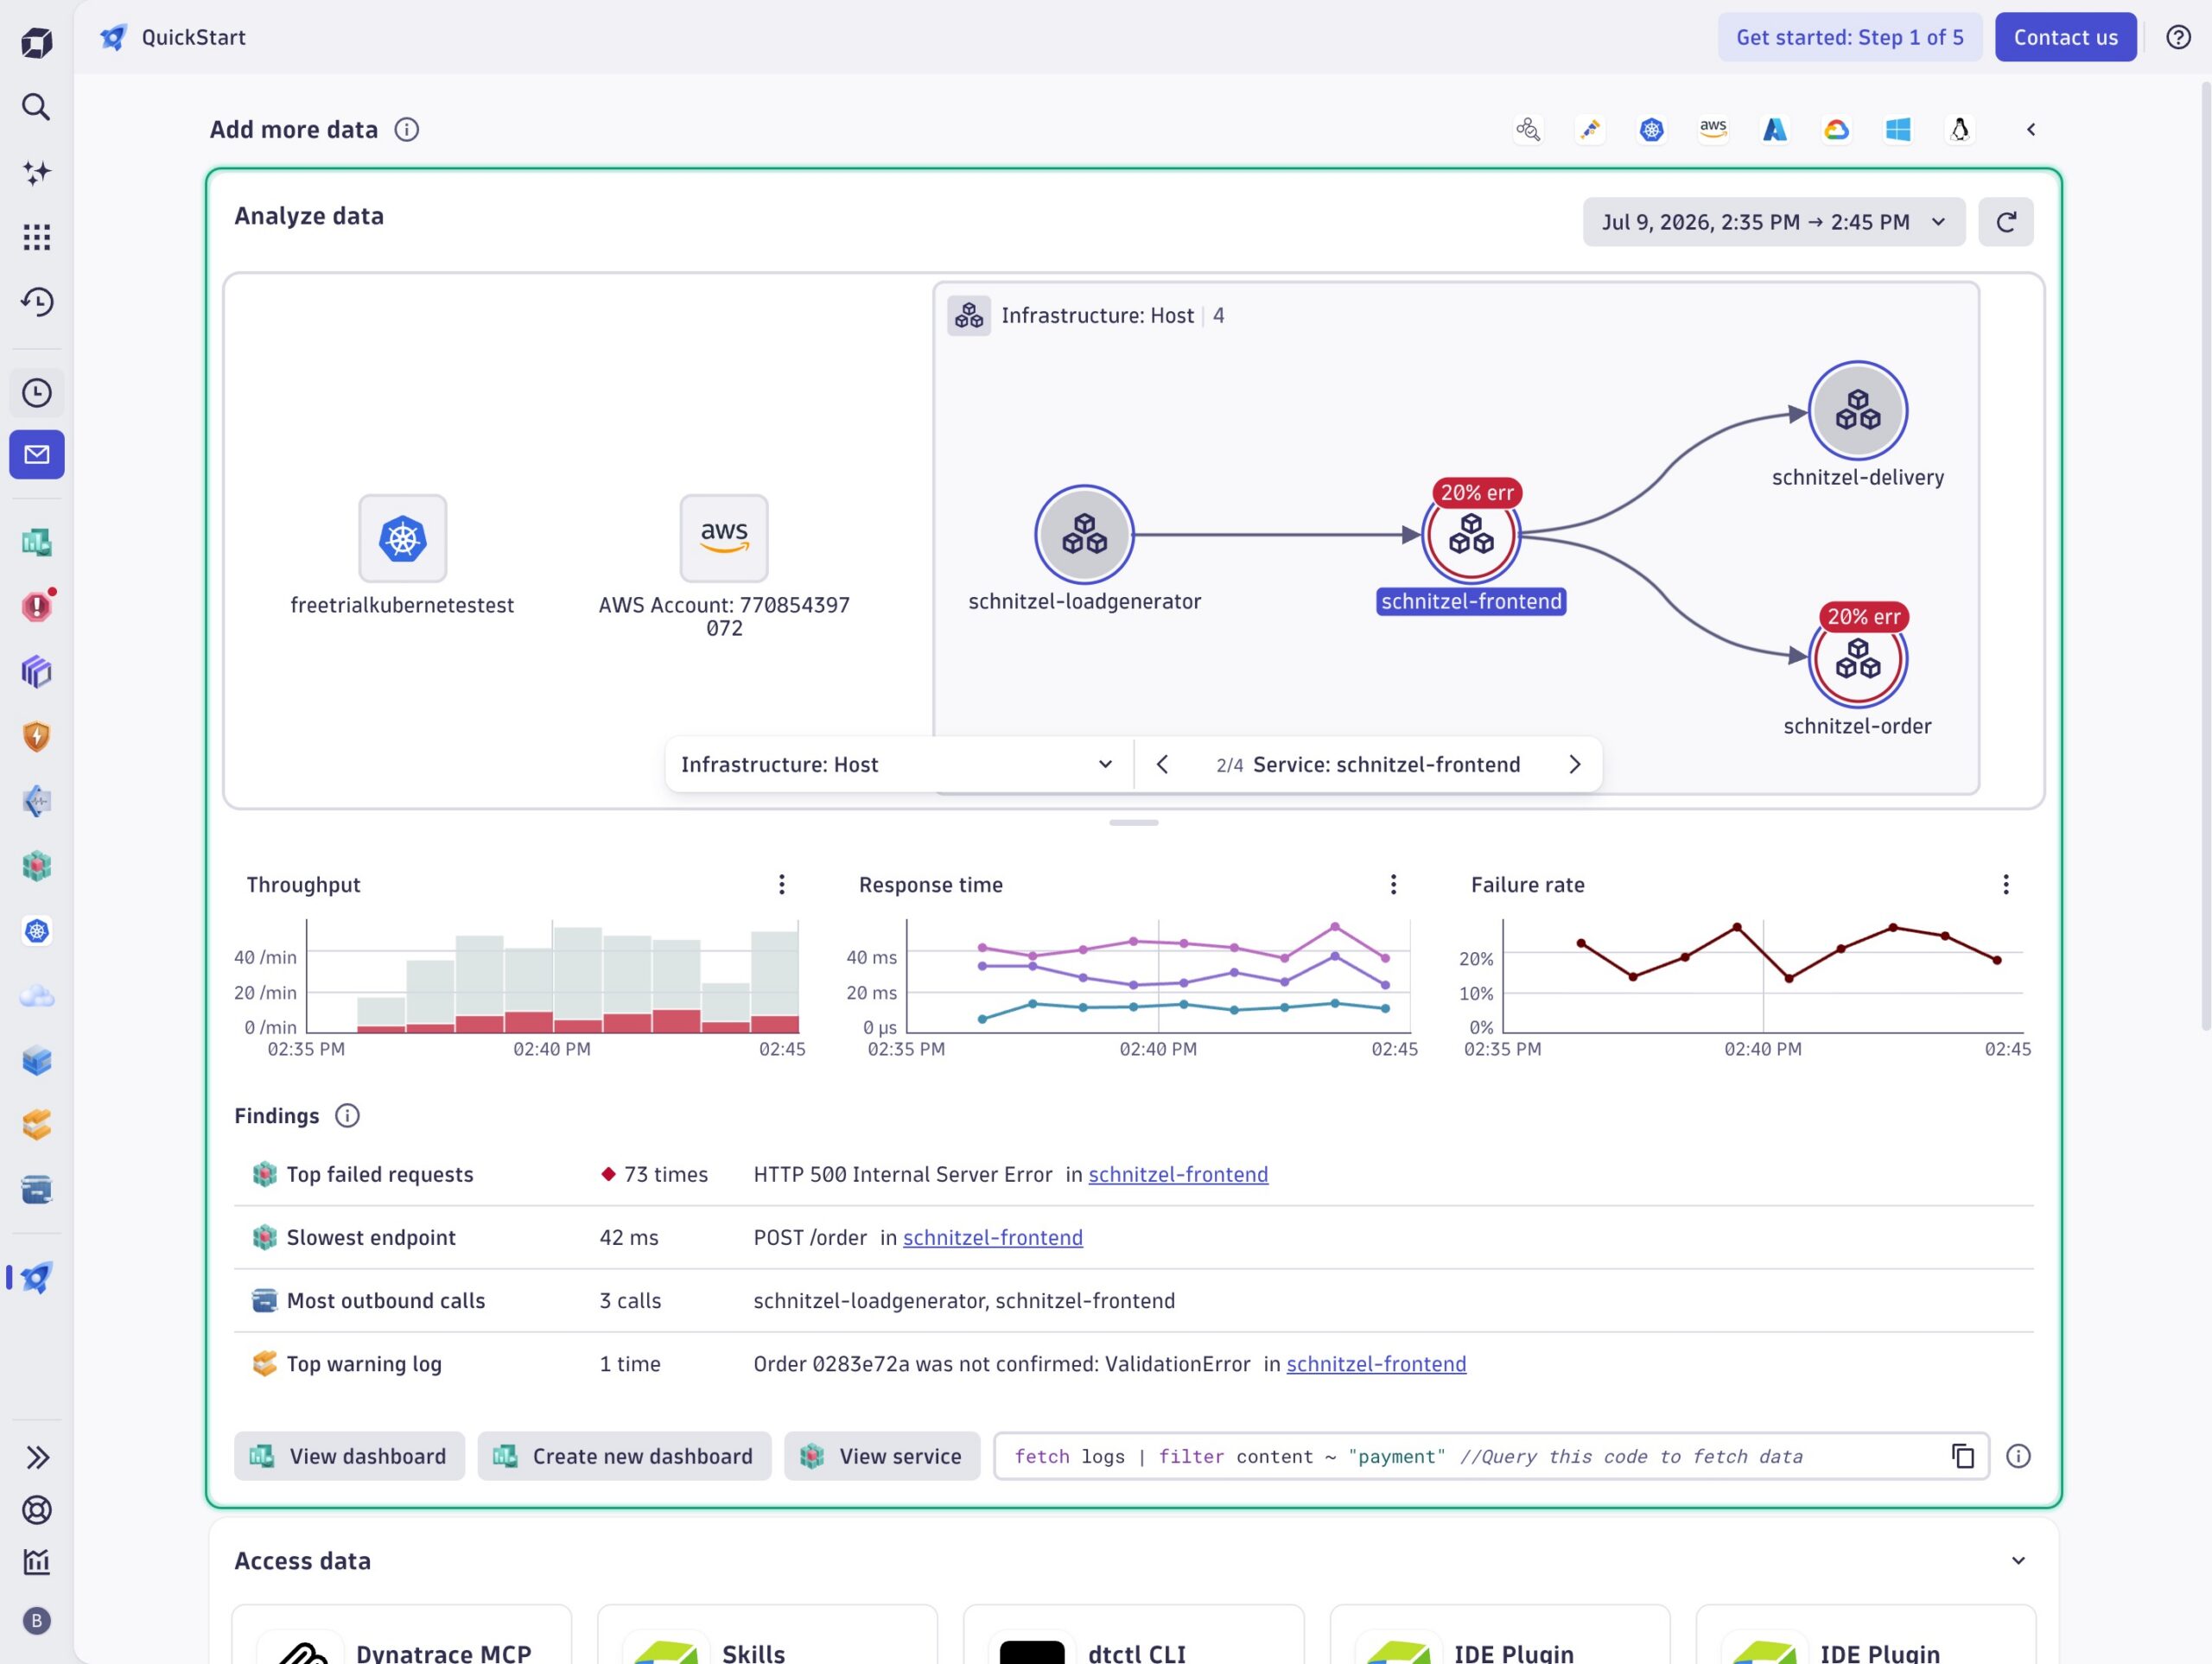
Your services appear as a connected dependency graph, complete with error-rate indicators that flag services that need attention. Alongside the connected topology, QuickStart surfaces the metrics that matter — throughput, response time, and failure rate – and, crucially, an automatically generated Findings panel based on available ingested telemetry, which reads like a head start on your first investigation.
The Findings section delivers a curated first look at what needs your attention. See your top failed requests, most common exceptions, top error logs, slowest endpoints, busiest outbound calls, and top warning logs at a glance, plus much more.
Each finding links straight to the relevant analysis. Dynatrace Intelligence in Assist adds a plain-language What this means explanation and suggested next steps.
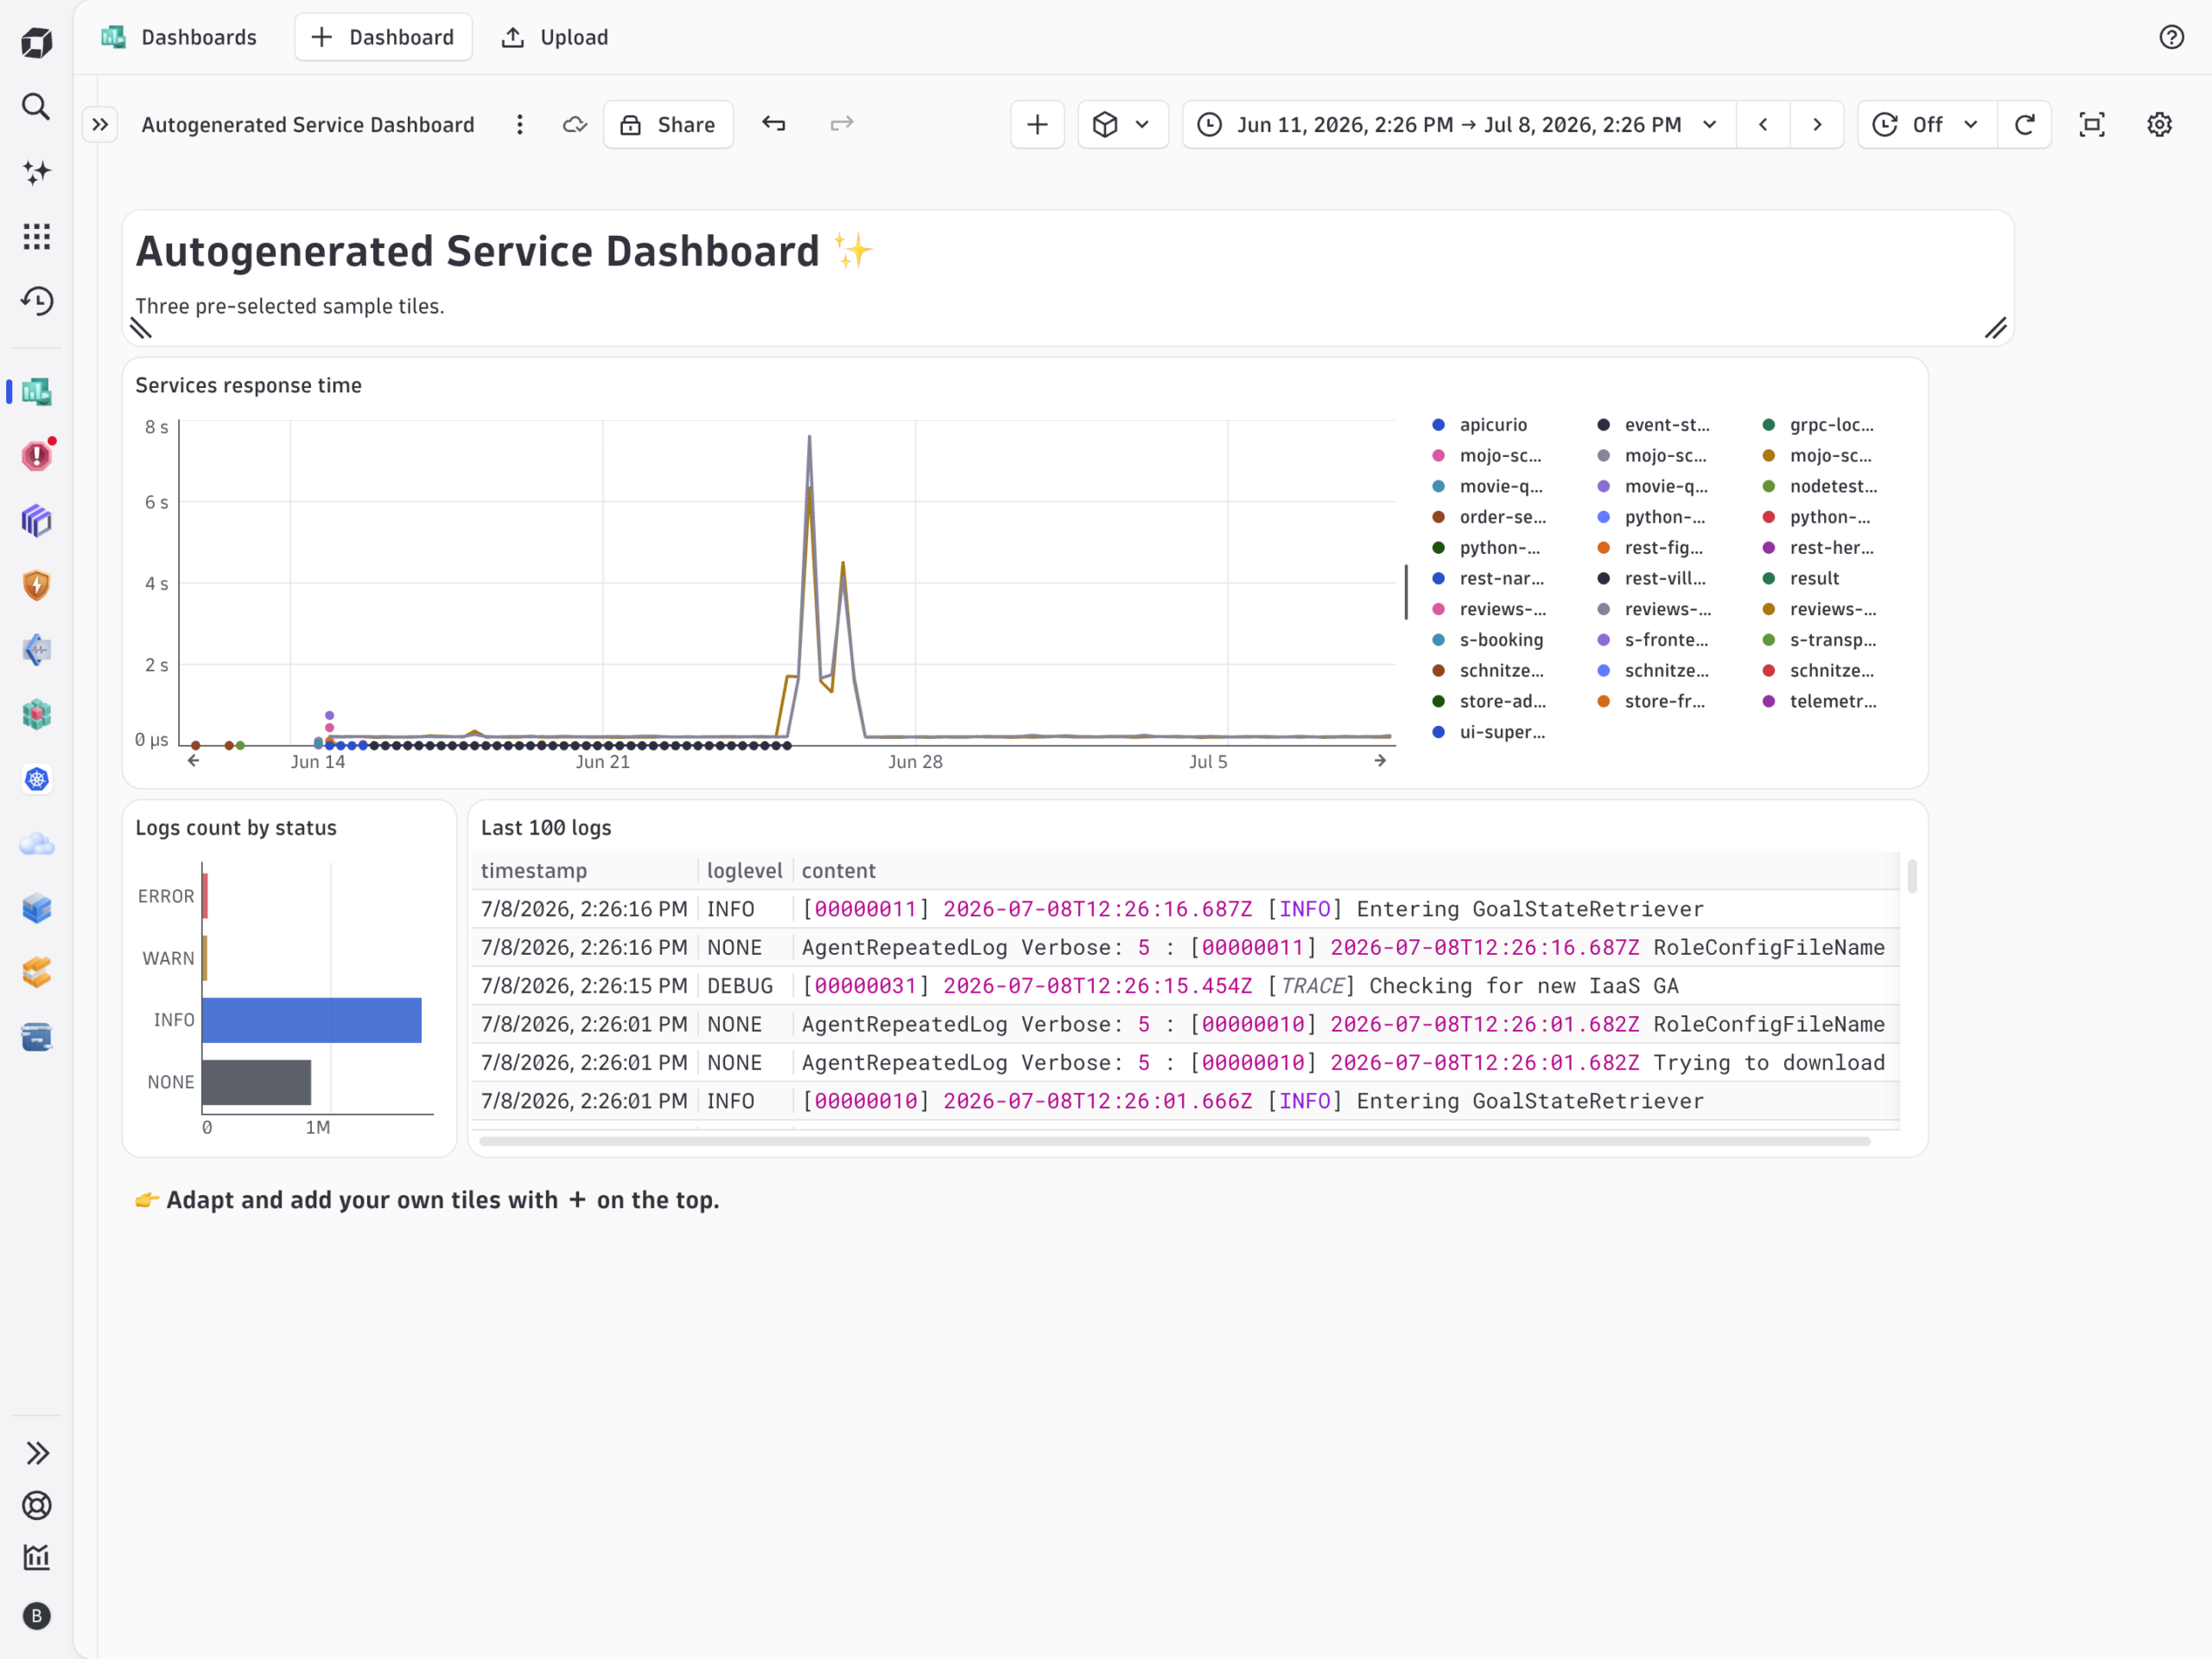
Want to go deeper? Ready-made dashboards, like Service overview, break your services down into Traffic, Latency, Errors, and Saturation. Selecting Create new dashboard automatically creates a dashboard with tiles you can adjust to show the data that matters most to you (Figure 4).
Access your data your way
QuickStart also meets developers where they work. QuickStart’s persistent Access data section (Figure 5) connects your telemetry to the tools you already rely on — so you can query your environment in natural language with the Dynatrace MCP for VS Code, hand your AI agents the Skills they need through built-in support, work from the command line with the dtctl CLI, or bring real-time production data into your editor with IDE plugins for VS Code and JetBrains, all without leaving your workflow.
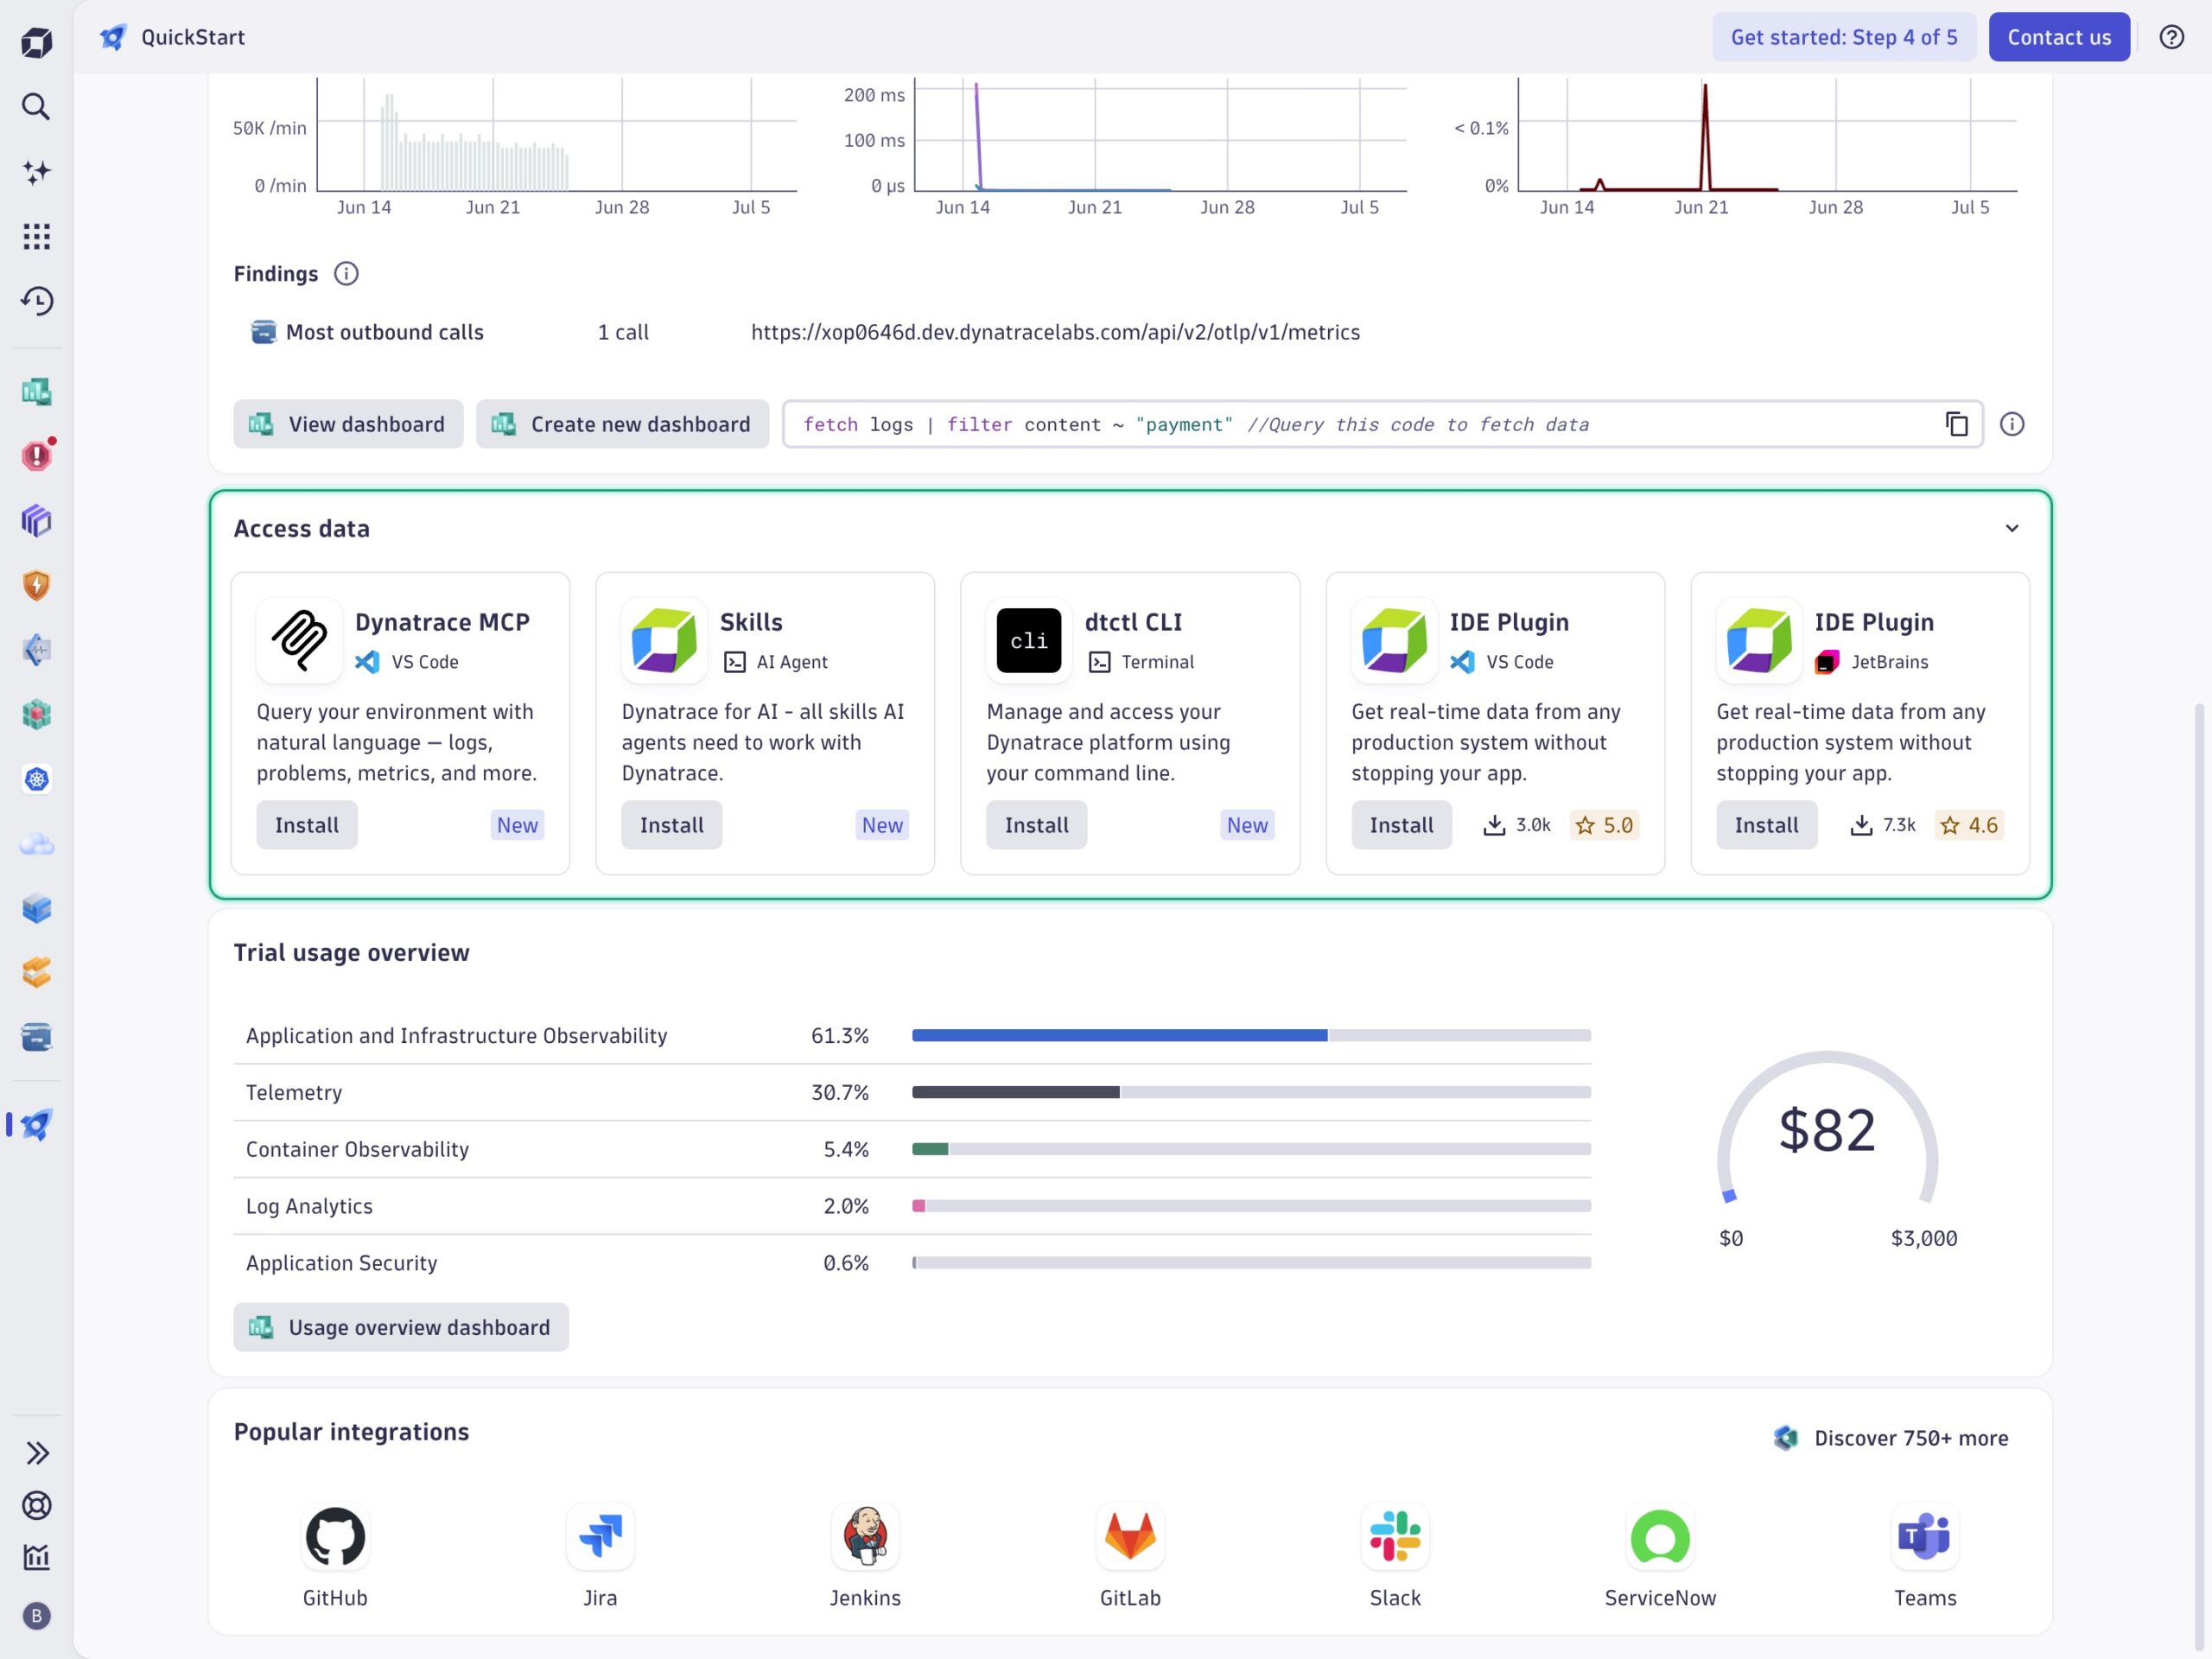
And when you’re ready to connect the rest of your stack, Popular integrations — GitHub, Jira, Jenkins, GitLab, Slack, ServiceNow, Teams, and 750+ more — are just a click away.
Start with a Dynatrace free trial
The Dynatrace free trial allows you to explore the Dynatrace platform without any upfront commitment, so you can experience the leading AI-powered observability platform and see what value it unlocks for you. After signing up, you arrive at the Getting started with Dynatrace home page. From there, you can open the QuickStart app to start adding data.
Throughout the trial, Dynatrace keeps the essentials within reach. A trial countdown stays visible so you always know how much time you have for your evaluation. Meanwhile, the Trial usage overview tracks your consumption across Log Analytics, Telemetry, App & Infrastructure Observability, Container Observability, and Application Security.
Not a Dynatrace customer yet? Explore how to get from zero insights to real answers for your services in minutes with Dynatrace QuickStart, dtwiz, and the Dynatrace free trial.

Looking for answers?
Start a new discussion or ask for help in our Q&A forum.
Go to forum