Beginning with the release of Dynatrace OneAgent v1.141, the Events section of each entity overview page now includes a number of helpful new drill-down and filtering enhancements. You can even use the Dynatrace API to push events into your Dynatrace environment where you can then take advantage of powerful new analytics to analyze the Events feed of each of your monitored components.
Value of event analytics
The foundation of the Dynatrace full-stack monitoring platform is an extensive model of your environment’s entire application topology within your data center. The topology details how all the monitored entities in your environment are interconnected. This model is automatically detected by OneAgent, which updates all relationships in real time.
Events are essential raw data that Dynatrace AI considers during automatic root-cause analysis to understand the reasons underlying any problems that are detected in your environment. Out of the box, Dynatrace detects more than 80 different built-in system event types, including process crashes, deployment configuration changes, and VM motion events. And, using extension points, you can report custom events through OneAgent plugins or via the Dynatrace API.
Dynatrace shows all system events in the context of your data center topology. So you can analyze events in relation to their parent topological components (for example, hosts, processes, or services) and see how they relate to one another.
Improved event analytics
The improved Events section on each overview page provides a convenient chart that displays overall statistics for each event type occurring during the selected analysis time frame.
Scaling up and drilling down
In production environments, a single host, or even a single process, may include thousands of individual events. The Dynatrace events-analytics engine can process all such events, even over large analysis time frames. Importantly, events analysis offers convenient drill-down and filtering options that make it easy to focus on specific points in time where high event activity occurred and then filter those events based on event type.
The Events chart in the example below shows multiple event types over the course of a year-long analysis time frame. However, in this example, we’ve focused on a single point in time and a specific event type. By drilling down into the event highlighted below, we see that the file ase.jsp was newly deployed at that point in time.
Cooperating with other tools in the toolchain
By enabling Dynatrace AI to consider information from third-party systems, you can have custom events pushed to any topological component (host, process, or service).
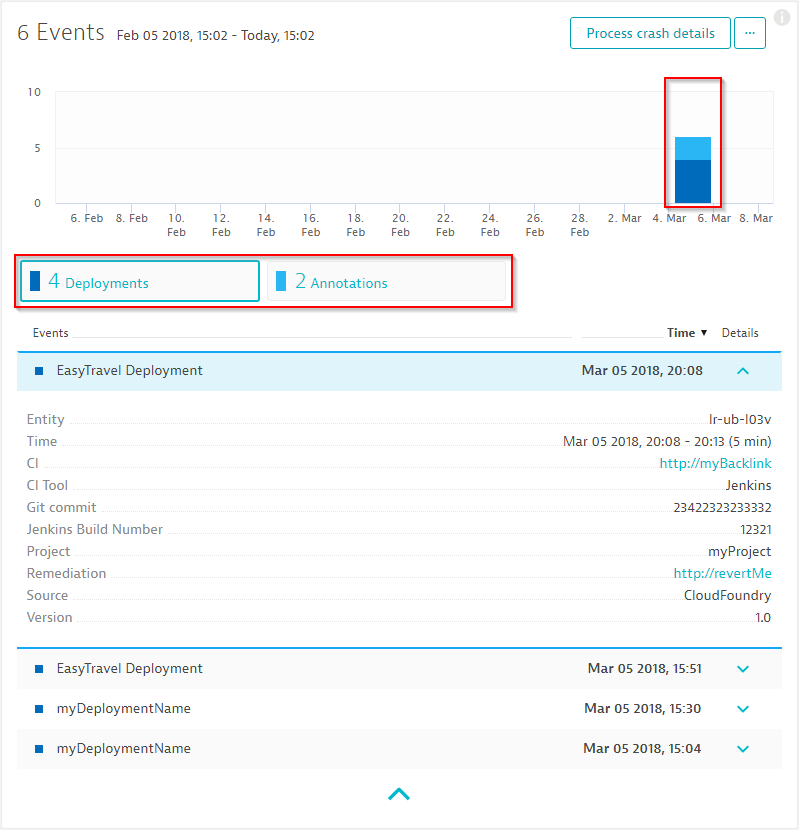
One popular use case is to have your continuous integration (CI) and build toolchain automatically report meta-information about software deployments. Each custom event includes a set of custom key-value properties that your toolchain can use to report important context information.
In the example below, you can see a custom deployment event with user-defined key-value properties for the Jenkins build number and Git commit information.
Summary
Introducing the newly enhanced Events section on each host, process, and service overview page greatly improves the transparency of event activity on each of your monitored component. By breaking down events based on type, you can quickly focus on periods of high event activity and drill down to the details of individual events that have contributed to detected problems in your environment.
In combination with an events REST endpoint, which we’ll release soon, the enhanced Events section is a great first step in opening up the Dynatrace platform to accepting event information from external tools and seamlessly integrating these tools within your own CI toolchain.


Looking for answers?
Start a new discussion or ask for help in our Q&A forum.
Go to forum