
This series covers recent Dynatrace releases and updates, focusing on what’s new, what changed, and how it applies to you and your organization. Each post outlines newly available capabilities and points to places where you can explore them directly, helping you understand what’s relevant and what to look at next.
We kicked off the new year with our annual customer event, Dynatrace Perform, and many new announcements. If you weren’t able to join us in person, you can watch all the mainstage keynotes, innovation sessions, and breakouts on demand on the Dynatrace Perform 2026 webpage.
In this blog, we’ll focus on brand-new product enhancements that accelerate service troubleshooting, provide richer cloud context for AWS, and deliver meaningful improvements that reduce friction in daily workflows.
If you want to jump straight to our curated sandbox environment for the capabilities mentioned below, head over to our dedicated playground launchpad.
Dynatrace Intelligence
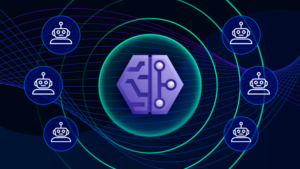
Our biggest news is that Dynatrace Intelligence is now available. It’s the industry’s first agentic operations system that effectively fuses deterministic insights with agentic action to deliver reliable outcomes with autonomous prevention, remediation, and optimization at scale.
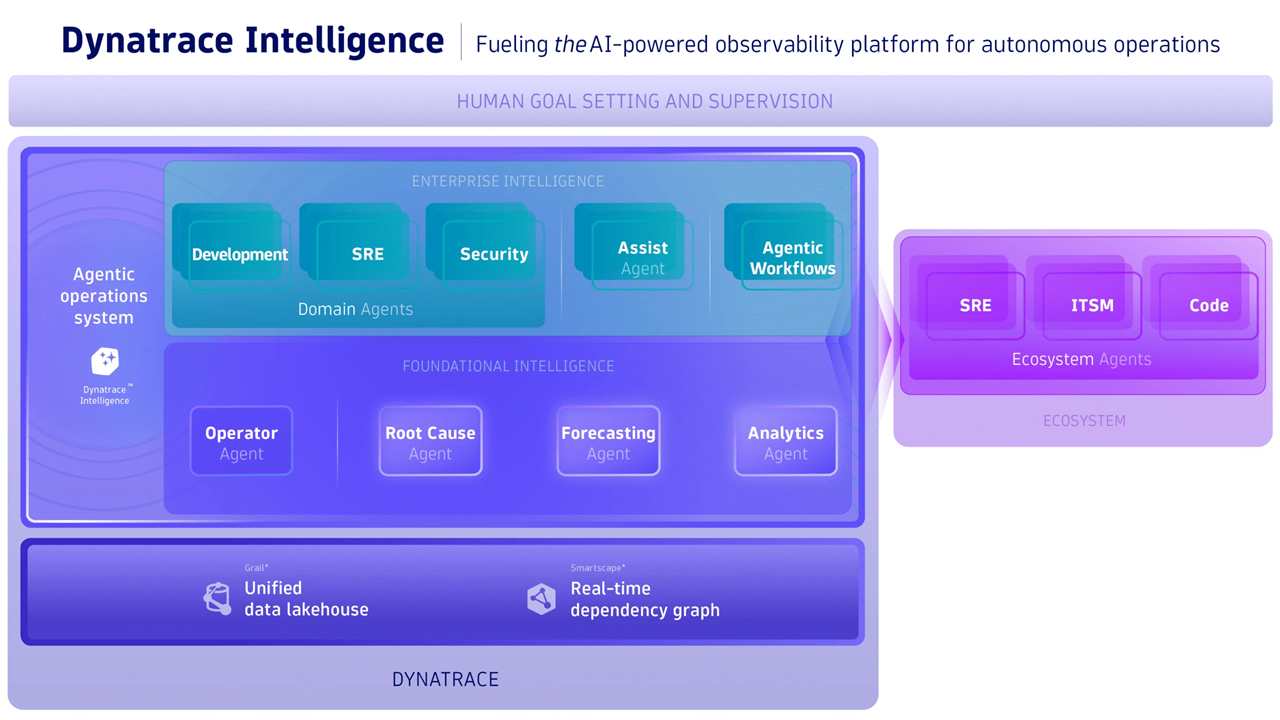
Here are the new features and capabilities now available in Dynatrace Intelligence:
- Dynatrace MCP Server: In addition to the local MCP server that was launched in May 2025, our remote MCP server is now generally available.
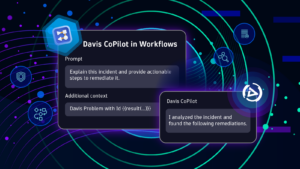
- Dynatrace Assist: The evolution of Davis CoPilot puts Dynatrace Intelligence at your fingertips. Dynatrace Assist pulls context from Grail, maps relationships using Smartscape – our real-time dependency graph – and collaborates autonomously with Dynatrace agents using the tools provided by the Dynatrace MCP server.
- Agentic ecosystem: Whether you aim to level up collaborative operations with SRE agents, enjoy closed-loop autonomous operations with ITSM agents, or want AI-powered code repair with developer and coding agents, we’ve got you covered. Maximize the value of your tool landscape by leveraging our agentic integrations.
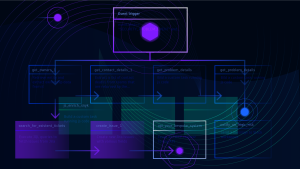
- Agentic workflows: Turn your workflows into agentic automations leveraging Dynatrace Intelligence. This program is currently available in a Preview program.
Smartscape: Real-time dependency graph
The new Smartscape experience delivers a real-time dependency graph that helps practitioners move from “watching signals” to understanding true entity health and cause-and-effect across fast-changing cloud, Kubernetes, on-premises, and hybrid environments. It adds major new capabilities:
- An all-new Smartscape app with powerful visual analytics and domain-specific views,
- Fully native cloud entities with complete metadata (including raw cloud/Kubernetes object JSON),
- and agentless cloud data ingest for automatic enrichment of dependencies and policy context.
This allows teams to diagnose faster, reduce MTTR, and make better architectural and operational decisions with real production context.
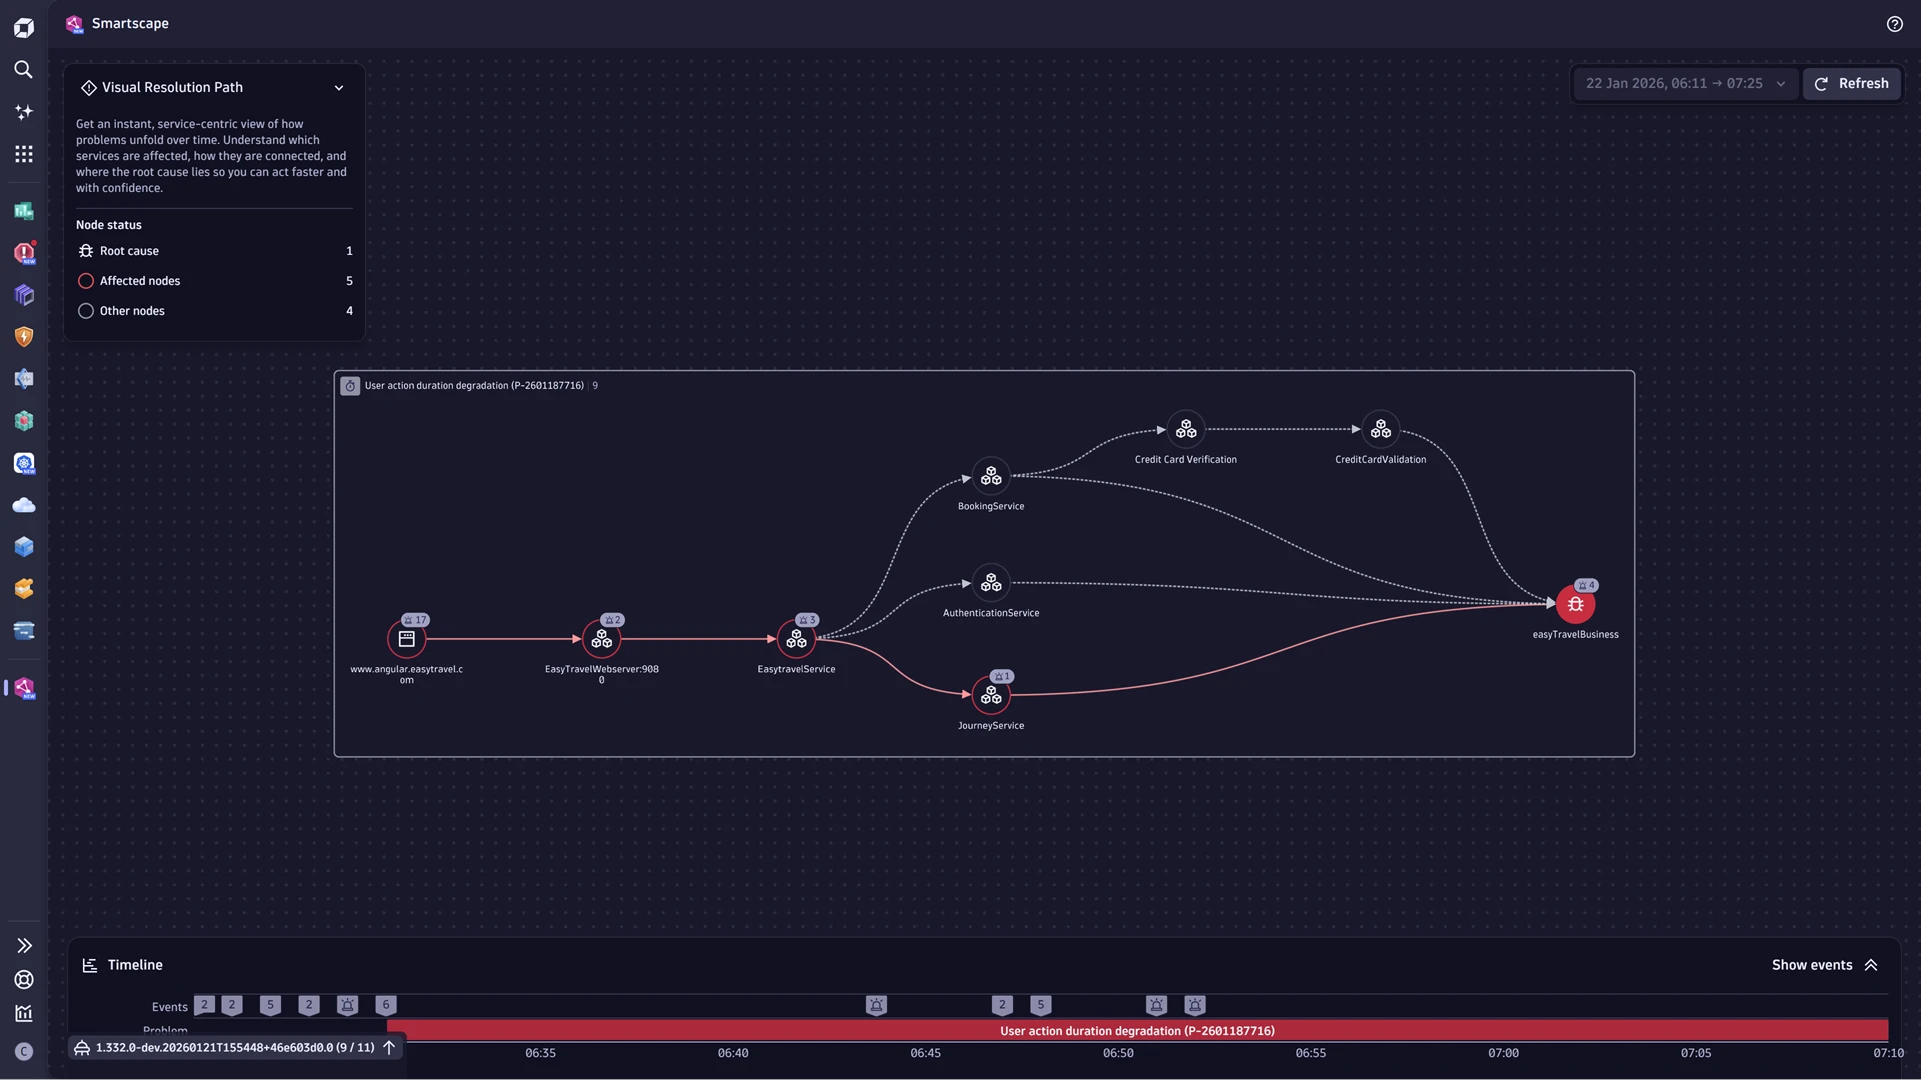
Smartscape enables exploration across millions of relationships, strengthens incident collaboration via in-context workflows like Visual Resolution Path and “view topology” actions, and improves security and governance by visualizing exposure and attack paths with real blast radius and enriched cloud native semantics like tags, ownership, cost centers, and compliance attributes.
The new Smartscape extends far beyond a standard topology; it offers domain-specific views tailored to the unique requirements of your use cases—whether application performance, cloud infrastructure, or essential business services. The following pre-configured views are now available.
- Smartscape on Grail: discover all entities and relationships in your environment
- Infrastructure overview: gain insights into which components are running and how they’re connected
- Service dependency graph: see how your services are connected
- Problem graph: understand problem impact and blast radius
- Kubernetes overview: map your Kubernetes environment, from clusters to components
- AWS EC2 ecosystem overview: understand your entire EC2 ecosystem and resource relationships
Have a look at our recent Smartscape blog post to learn how these enhanced views help solve real-world challenges.
Cloud Operations for AWS
Dynatrace enhanced Cloud Platform Operations expands AI-powered observability into an operations-first experience for practitioners (cloud ops, SRE, and platform teams) by unifying cloud metrics, logs, and events across AWS, Azure (see Preview program), and Google Cloud (see Preview program) in a single platform, enriched with topology-aware context for faster troubleshooting and safer automation. It introduces:
- fully managed cloud connections with a guided wizard (no extra infrastructure),
- expanded ingest that captures more cloud service metrics plus richer cloud events (including hyperscaler-native security alerts),
- and automatic reuse of existing cloud tags to drive access control, ownership, cost allocation, alert routing, and preventive workflows—so teams can move from fragmented signals to clear, actionable answers at enterprise scale.
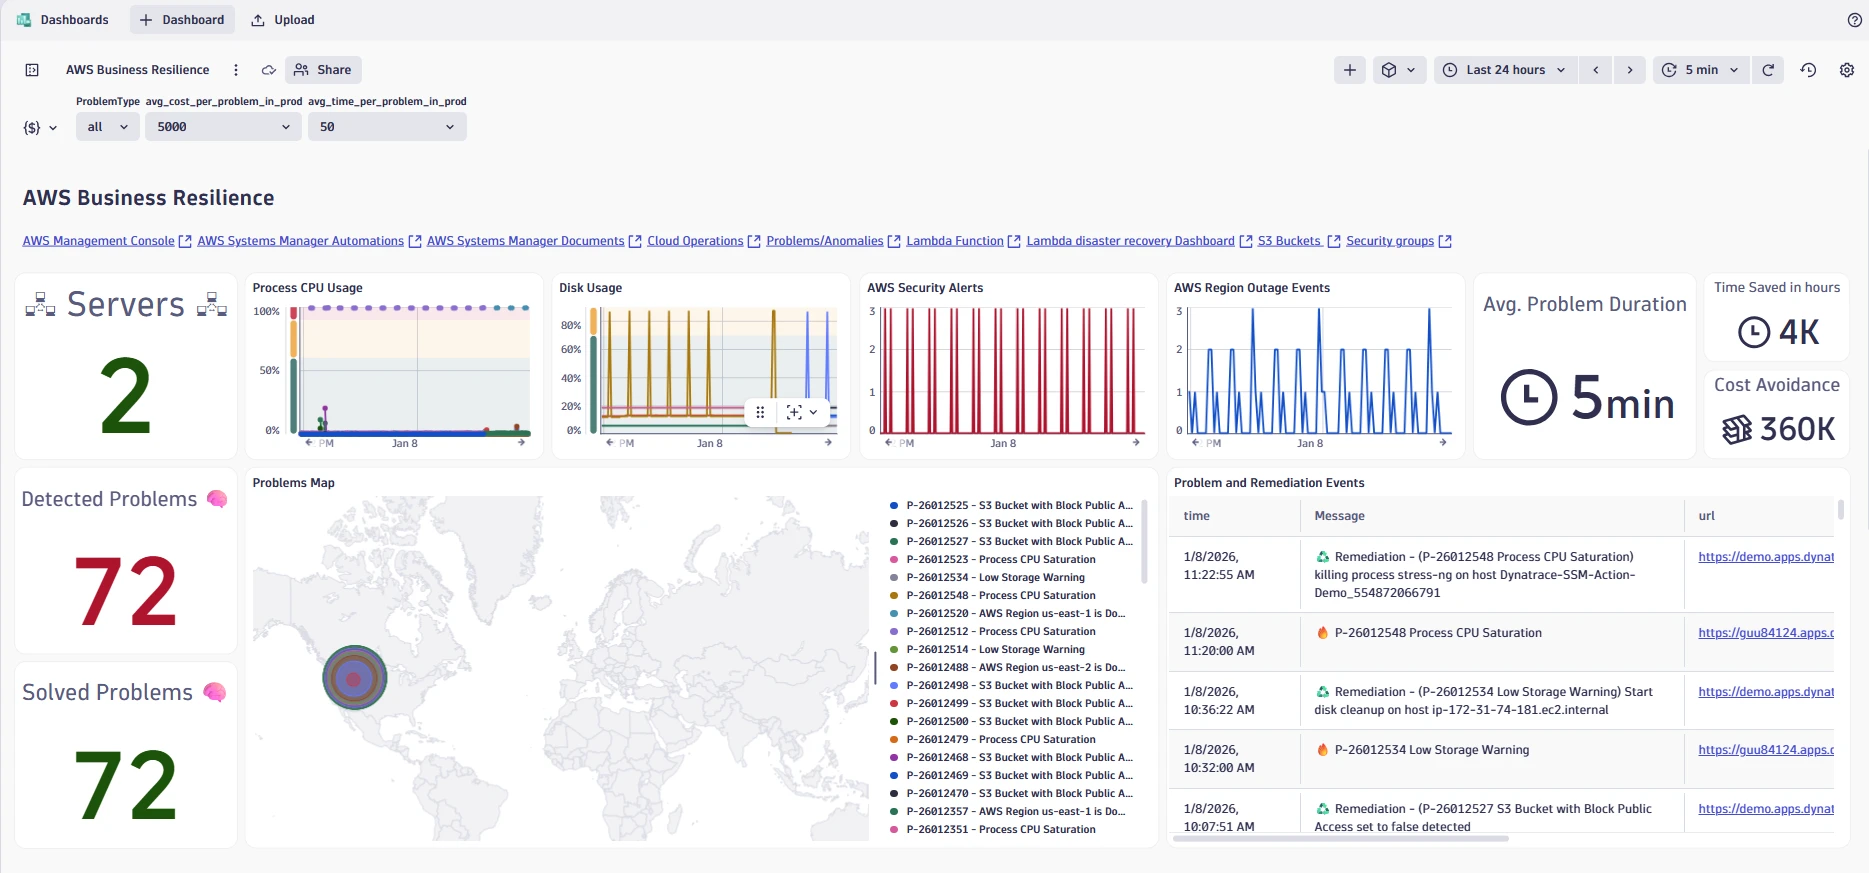
This allows users to shift from reactive monitoring to proactive cloud operations built around three outcomes: prevention (predict anomalies and trigger workflows before user impact), remediation (AI-driven RCA plus self-healing automation to cut resolution time), and optimization (continuous cost and performance efficiency via real-time insights and recommendations).
For platform teams, the big win is operational simplicity: the onboarding flow is GitOps-ready and removes the need to maintain ActiveGates for CloudWatch ingest on this path. For practitioners, the win is troubleshooting speed: reimagined exploration, resource-rich metadata, and opinionated insights reduce the time from “something’s wrong” to “here’s why.”
Real User Monitoring experience
The new Real User Monitoring (RUM) experience adds modern frontend signals that match how today’s web and mobile apps behave—for example, soft navigation for Single Page Apps (SPA), user interactions (clicks/taps/scrolls), and background requests—alongside Core Web Vitals and key mobile performance signals (including troubleshooting enhancements like application not responding and symbolication). Out of the box, teams get task-focused workflows and dashboards that connect frontend symptoms to backend reality, so you can pinpoint what’s slow or broken and shorten the path from user complaint to verified cause and fix.
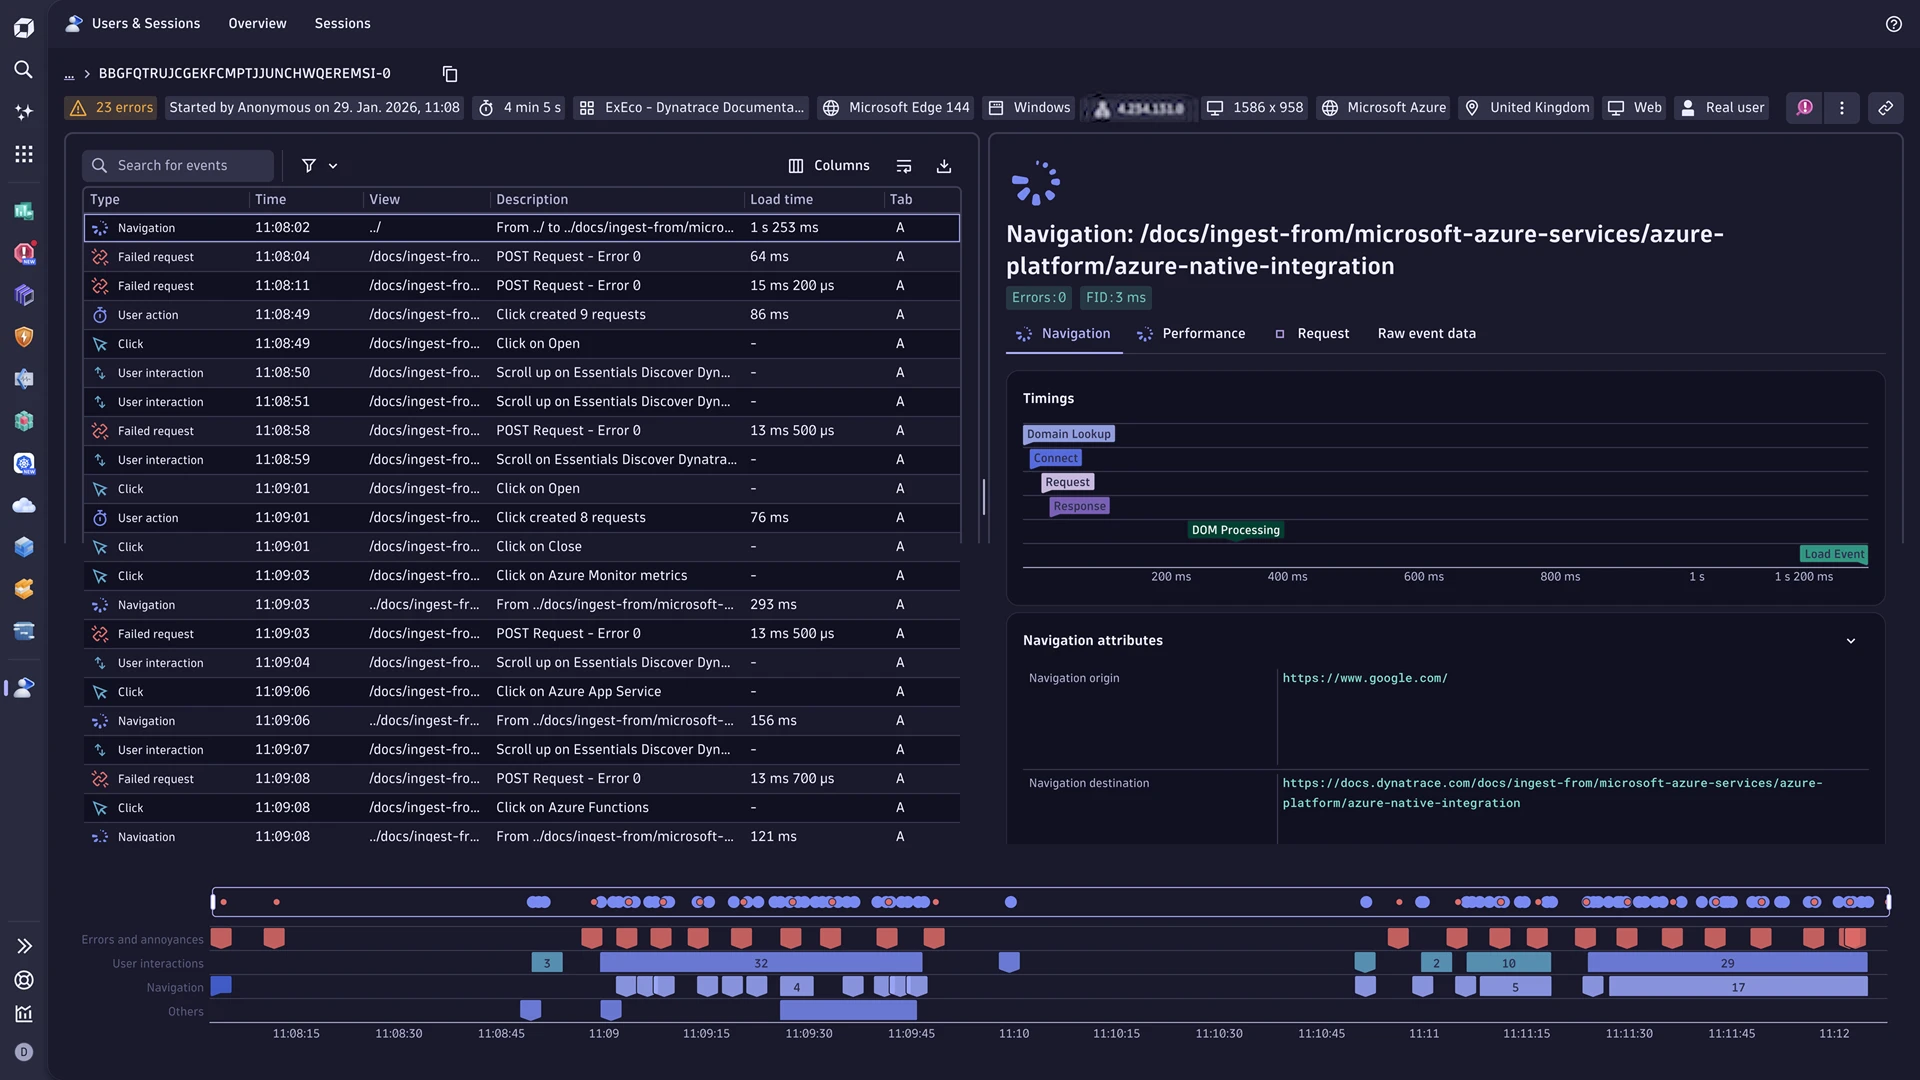
Achieve faster validation of real user impact and clearer prioritization: Users & Sessions grounds investigations in actual sessions, Error Inspector groups and prioritizes errors with the right context, and Experience Vitals helps identify which requests/assets drive slowdowns using redesigned analysis views—so teams can reduce friction, resolve complaints with confidence, and connect experience trends to business outcomes via custom dashboards, notebooks, and DQL exploration, with built-in privacy/permission controls, and optional extended retention for deeper historical analysis (currently available in a Preview program).
AI observability
Dynatrace has expanded agentic AI observability with a broader framework and protocol support, so teams can build, run, and debug autonomous agent systems with confidence across AWS, Azure, and Google Cloud. Support now includes popular agentic ecosystems such as Amazon Bedrock AgentCore, Amazon Bedrock Strands, LangChain Agents, Google Agent Development Kit (ADK), OpenAI Agents SDK, and Model Context Protocol (MCP)—with signals unified via OpenTelemetry and OpenLLMetry into a single correlated observability model for end-to-end visibility across agents, tools, models, and dependencies.

Alongside this expanded support, the new AI Observability app delivers a purpose-built experience to observe AI workloads end-to-end—from agents and LLMs to orchestration layers and tools—so practitioners can validate changes faster, reduce risk, and ship AI features at scale. Key capabilities include end-to-end monitoring of agent interactions and tool usage, prompt/tool/model tracing and debugging across multi-step flows, cost visibility (token consumption, cost trends, caching impact), actionable dashboards and drill-downs (including faster validation via A/B testing across model/prompt variants), and enterprise-grade security, privacy, and governance views such as surfaced guardrail outcomes for auditability and trend monitoring.
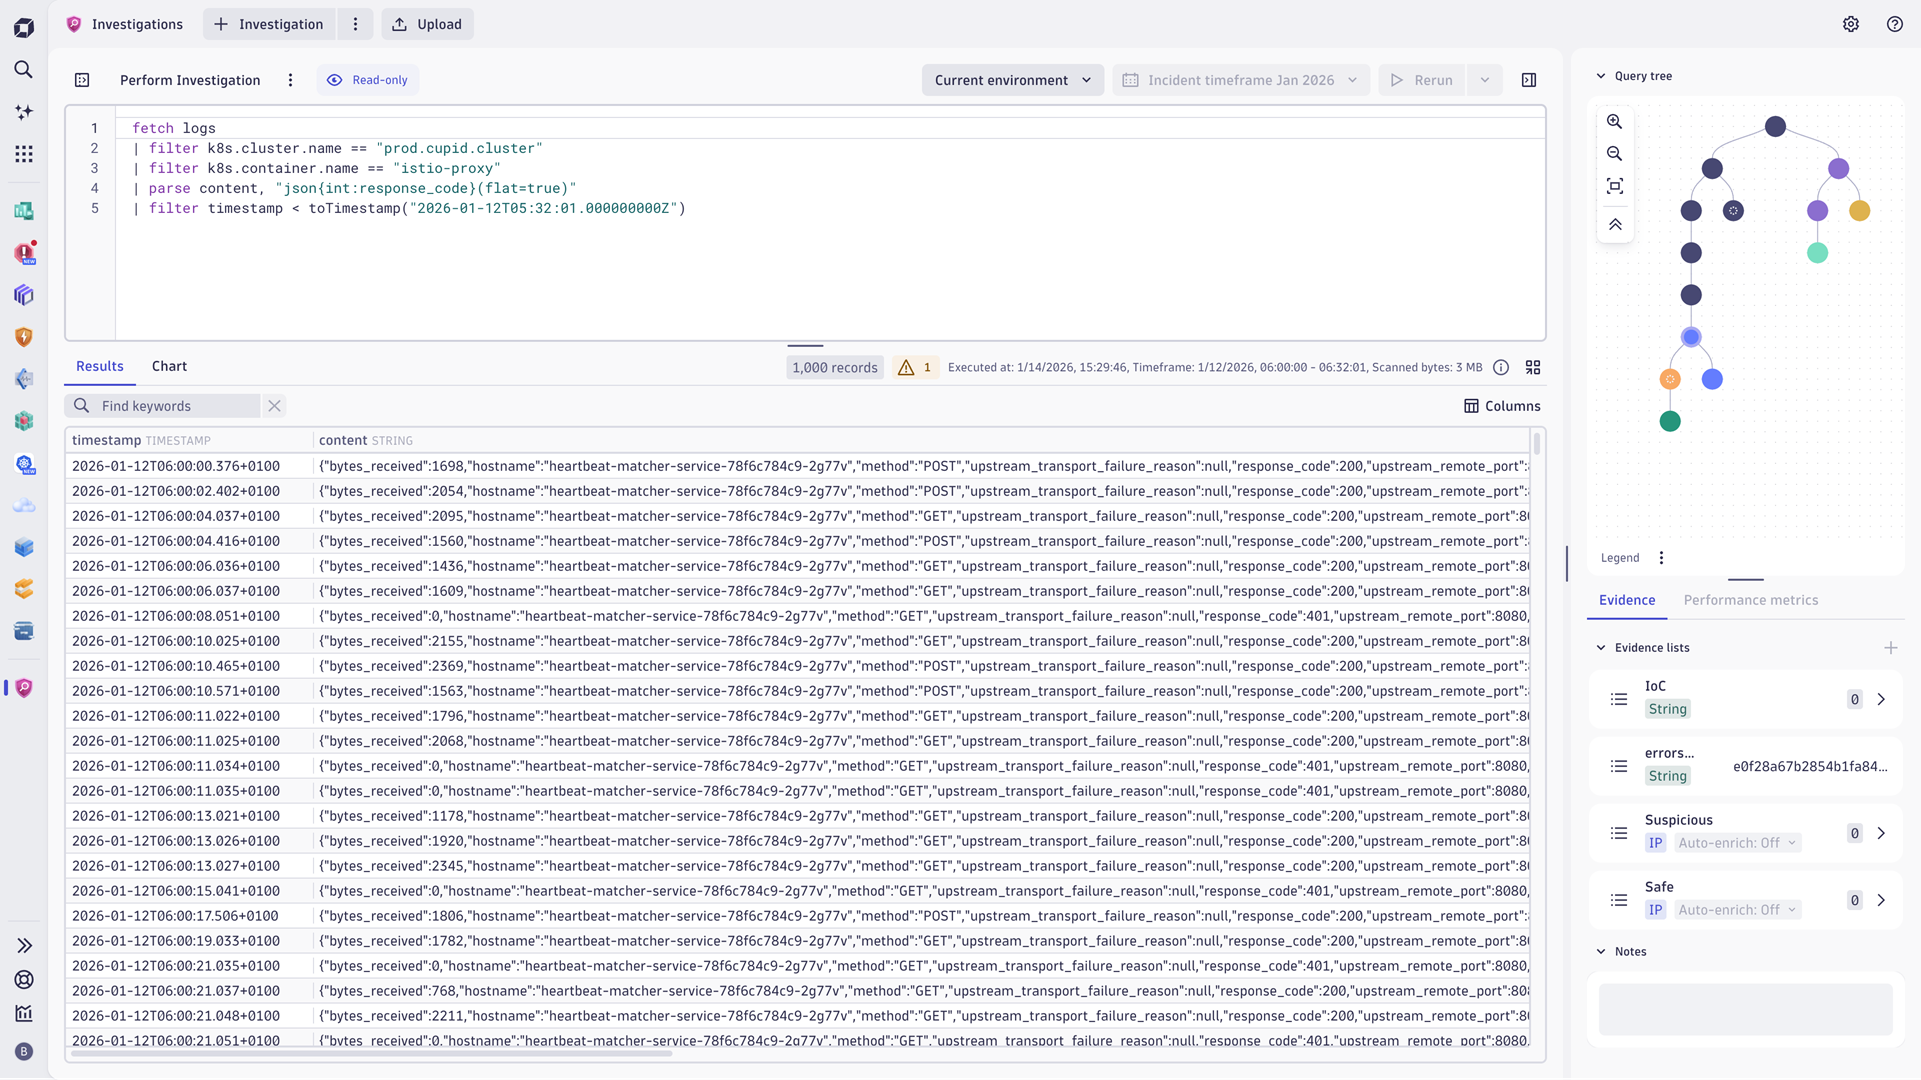
Investigations: Transform how practitioners derive actionable insights
The Investigations app provides a central starting point for exploring analytical insights across Grail data. It gives practitioners immediate access to essential investigation capabilities—such as analyzing large DQL results, pivoting queries based on metadata, reviewing investigation history, and connecting logs, metrics, events, and traces—helping practitioners quickly uncover root causes and accelerate complex investigations.
Improved Dashboards experience
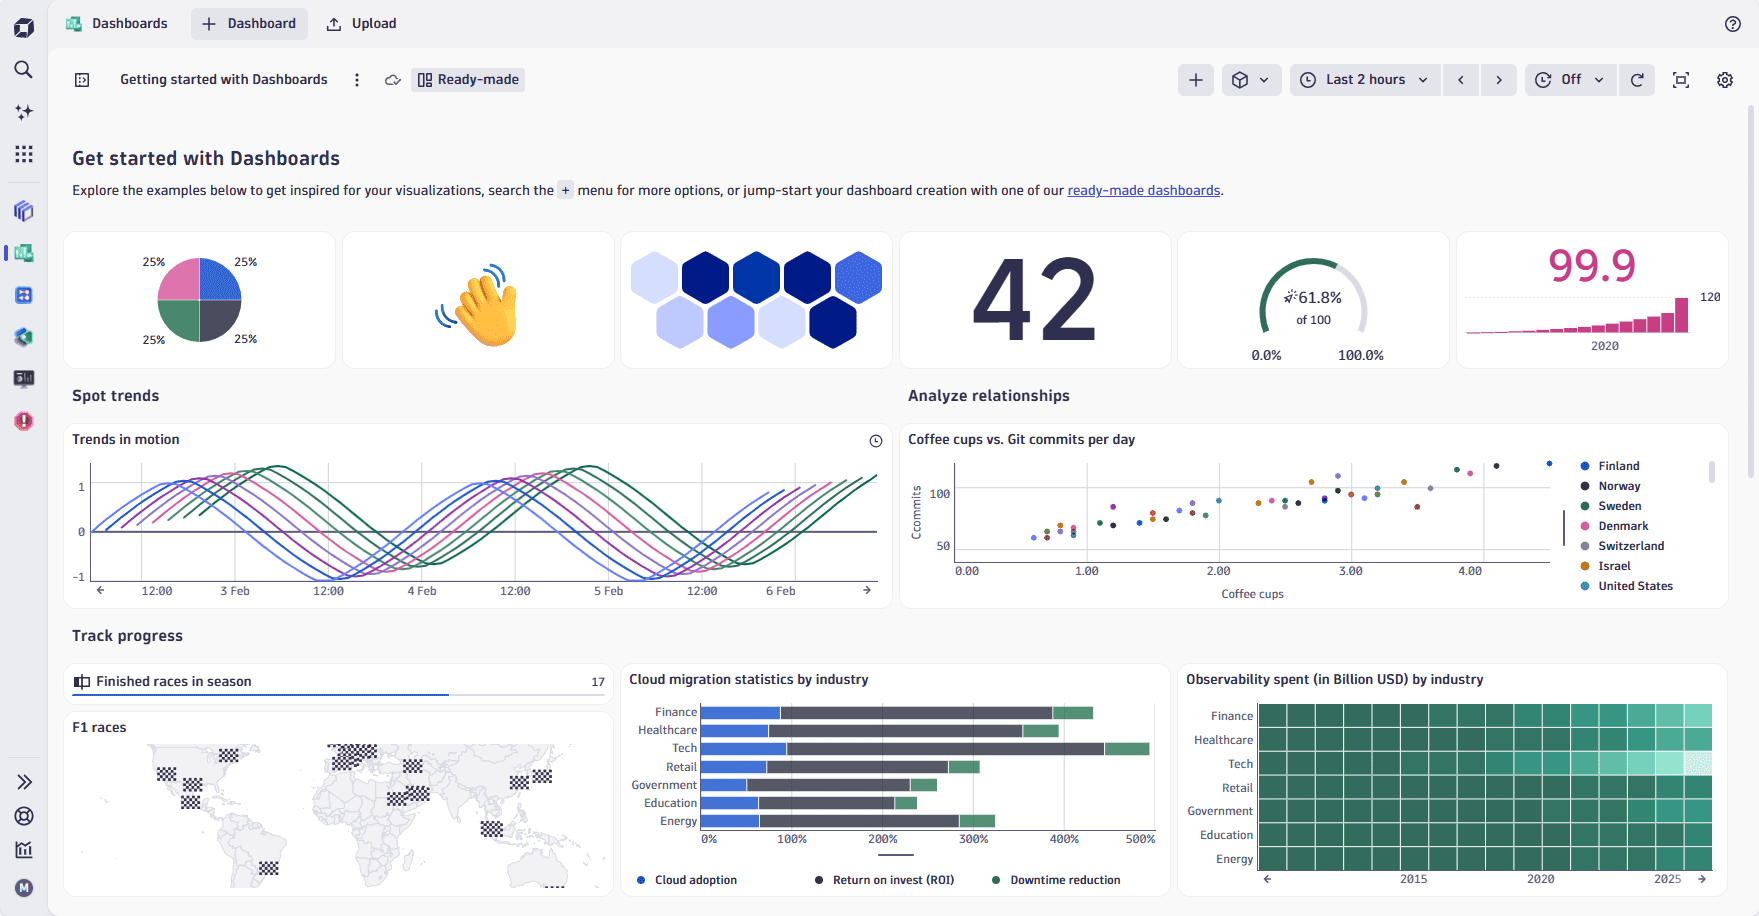
We’ve enhanced several ready-made dashboards that improve your dashboard experience and make insights clearer, faster, and more consistent. You can duplicate and adapt them to kick-start your own dashboards.
- The Getting started dashboard demonstrates the major types of visualizations you can use and provides example tiles and layouts.
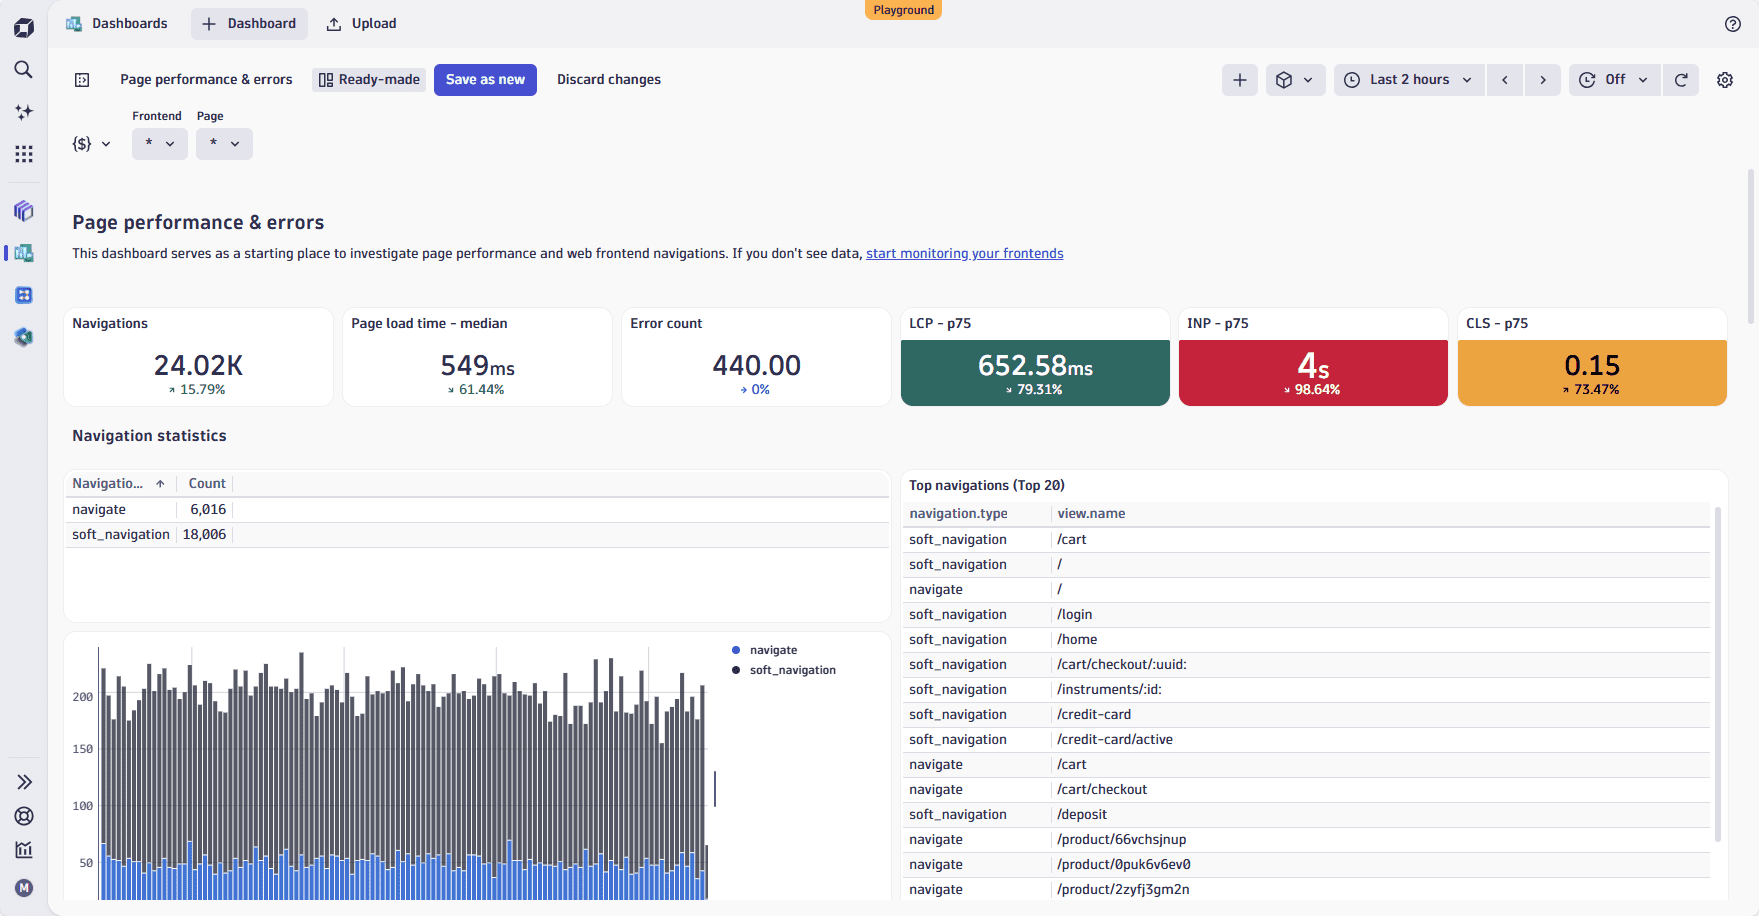
- The Page performance & errors dashboard serves as a starting point for investigating page performance and web front-end navigation. It surfaces the most important web performance and reliability KPIs at a glance, highlighting key metrics such as page load time, error count, navigations, LCP, INP, and CLS.
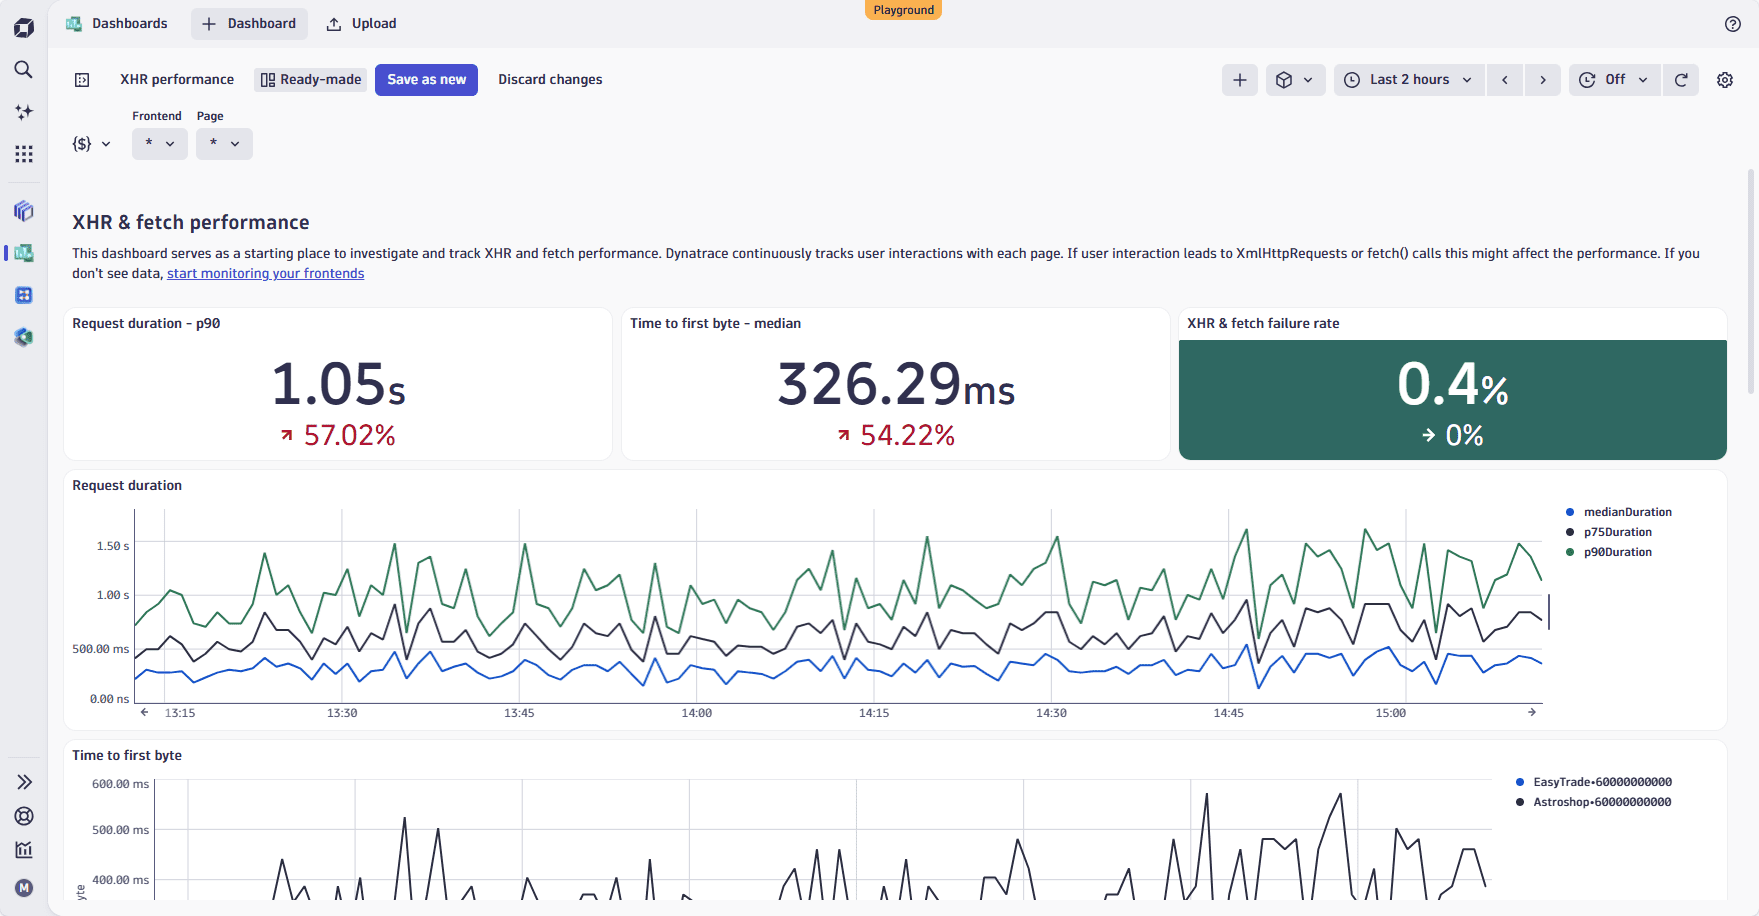
- The XHR & fetch performance dashboard includes core KPIs such as request duration, time to first byte (TTFB), and fetch failure rate. These help you quickly spot slow or failing back-end calls that affect the user experience.
Where to start this week
We encourage you to take advantage of all the efficiencies and insights these new Dynatrace capabilities provide. Depending on your role, here are the recommended next steps for SREs, Cloud Owners, and Development teams seeking faster service troubleshooting loops, richer AWS cloud context, and other meaningful improvements that reduce friction in their daily workflows.
Get started: SREs
- Start with Dynatrace Intelligence for faster incident loops
-
- Open Dynatrace Assist during an active issue to pull context from Grail and map relationships via Smartscape, then let it collaborate with Dynatrace agents/tools (via MCP) to accelerate triage and next steps.
- If you use chat/agent tooling internally, connect via the Dynatrace MCP Server (remote if you want centralized access) to make Dynatrace context available in your agentic workflows.
- Make Smartscape your default “blast-radius + causality” view
-
- Use the new Smartscape app and Visual Resolution Path/view topology actions to validate true upstream/downstream impact and shorten MTTR.
- Leverage native cloud/Kubernetes metadata (including raw object JSON) to quickly confirm “what changed” vs. “what broke.”
- Automate closure with agentic workflows (Preview program)
-
- Convert recurring remediation steps into agentic automations by combining Dynatrace Intelligence with Workflows for closed-loop operations (start with a high-confidence, low-risk runbook).
Get started: Cloud owners
- Onboard AWS with enhanced Cloud Operations first
- Use the fully managed cloud connection and guided wizard to bring in unified metrics, logs, and events with richer AWS context, without maintaining ActiveGates for CloudWatch ingest on this path.
- Ensure your cloud tags are clean and meaningful, because they’ll automatically drive ownership, access control, cost allocation, and alert routing.
- Operationalize outcomes: prevention, remediation, and optimization
- Set up alerting and dashboards around the three outcomes:
- Prevention: anomaly prediction + proactive workflows
- Remediation: AI-driven RCA + self-healing actions
- Optimization: continuous cost/performance efficiency using context-rich insights
- Use Smartscape to validate dependencies and impacts across accounts, regions, clusters, and services.
- Plan for multicloud setup
- If you’re also on Azure or GCP, use what you learn on AWS to establish a standard operating model, then extend to preview programs when ready.
Get started: Development teams
- Start from user impact with the new RUM experience
-
- Use Users and Sessions to reproduce issues from real sessions, then jump to Error Inspector and Experience Vitals to identify which requests/assets/interactions drive pain.
- For SPAs and modern apps, validate soft navigation, user interactions, and background requests alongside Core Web Vitals to quickly pinpoint frontend bottlenecks.
- Connect frontend symptoms to backend issues
-
- From a slow, erroring session, follow the workflow to backend services and dependencies (Smartscape helps confirm causality), shortening the path from complaints to verified root causes.
- If you ship AI features, instrument them with AI Observability
-
- Adopt the AI Observability app for end-to-end tracing across agents, tools, and models; use cost visibility and A/B validation to safely iterate on prompts/models.
- Standardize telemetry via OpenTelemetry and OpenLLMetry, and if you use agent frameworks (LangChain Agents, OpenAI Agents SDK, Google ADK, Bedrock, or MCP), start by observing one representative production flow before scaling coverage.

Looking for answers?
Start a new discussion or ask for help in our Q&A forum.
Go to forum