
Environmental sustainability is increasingly important to organizations and investors alike, driven in part by global regulatory mandates. However, IT leaders lack the tools they need to measure, understand, report, and reduce their IT carbon footprints. The new Carbon Impact app, developed using Dynatrace® AppEngine, tracks carbon emissions across hybrid and multicloud environments, delivering analytics and recommendations that support carbon-reduction initiatives.
There are many definitions of environmental sustainability, most of which converge on a common theme. Collectively and individually, we have a responsibility to act to protect global ecosystems and support health and wellbeing, now and in the future. Sustainability seeks a balance between human activity and the natural world.
As a result, environmental sustainability is one of the three pillars of environmental, social, and governance (ESG) initiatives. ESG embodies a set of criteria that guides an organization’s strategy, measures the organization’s impact, and informs potential investors across these three pillars. Specifically, the environmental criteria focus on an organization’s utilization of natural resources and the resulting impact on the environment. McKinsey summarizes the importance of this focus. “Every company uses energy and resources; every company affects and is affected by the environment,” the article states. ESG metrics are increasingly important to investors as they evaluate risk. In turn, these metrics are increasingly important to organizations because they measure and disclose their performance.
Balancing act or tipping point?
What motivates us to act? The answer, to varying degrees, is favorable investment potential, regulatory requirements, competitive advantage, cost savings, and moral imperative. And the time to act is now. In fact, in an article for the Wall Street Journal, Gartner analyst Stephen White anticipates that organizations will rapidly adopt performance metrics tied to energy consumption. “Sustainability is increasingly becoming a board-level issue with broad companywide mandates flowing down from chief executives to tech leaders,” White says.
Regulatory mandates are another driver that organizations can’t ignore. As a result, the Securities and Exchange Commission (SEC) in the US and the European Parliament in the EU are adopting stricter reporting rules that will apply to a larger number of companies. Globally, the International Sustainability Standards Board (ISSB), established at the UN Climate Change Conference in Glasgow, has developed requirements for climate-related disclosure. Sustainability reporting informs investors about sustainability risks and helps focus a company’s sustainability actions.
Your IT carbon footprint
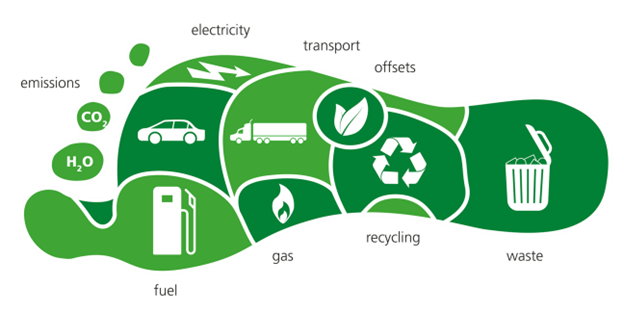
Corporate carbon footprint calculations consist of multiple facets, including transportation, waste management, fuel, and electricity consumption. To that end, measuring, understanding, and reporting results are important precursors to intelligent reduction actions.
From an IT perspective, the sustainability focus is on carbon emissions from electricity consumption, specifically related to on-premises, hybrid, and multicloud computing. Some interesting facts:
- Moving a workload to the cloud can reduce its carbon footprint by up to 96%.
- Cloud computing has a greater carbon footprint than the airline industry.
- Average cloud server idle time exceeds 70%.
Yet most organizations don’t have the tools to measure, much less reduce, their IT carbon footprint.
Measuring your carbon footprint: from intention to action
Cloud providers offer tools to measure carbon emissions from the use of their cloud services. But these tools don’t support multicloud environments, and they don’t account for the footprint of on-premises services. More importantly, these tools are fundamentally backward-looking. They lack both the time and dimensional granularity required to derive carbon-emission analytics and optimization insights. Environmental sustainability emphasizes our collective responsibility to take action. For this, we need real-time intelligence and analytics, not just historical reports.
As executive mandates reach technology leadership teams, your organization’s carbon reduction goals will become more tangible. As a result, you’ll need to shift from intent to action, from passive reporting to active reduction initiatives.
Introducing Carbon Impact
The Carbon Impact app from Dynatrace measures and reports the carbon footprint of all Dynatrace-monitored hosts across your entire hybrid and multicloud environment in a single interface. The app translates utilization metrics, including CPU, memory, disk, and network I/O, into their CO2 equivalent (CO2e). Dynatrace engineers developed the app using guidance from the Sustainable Digital Infrastructure Alliance (SDIA), expanding on formulas from Cloud Carbon Footprint.
With Carbon Impact, you can explore the sources of your IT carbon footprint, regardless of where your workloads run. The app automatically identifies opportunities to reduce carbon emissions, capturing the details needed to analyze and make informed decisions. It also generates granular reports and host-level details to provide a focus for carbon reduction initiatives.
The Carbon Impact dashboard: Your IT carbon footprint overview
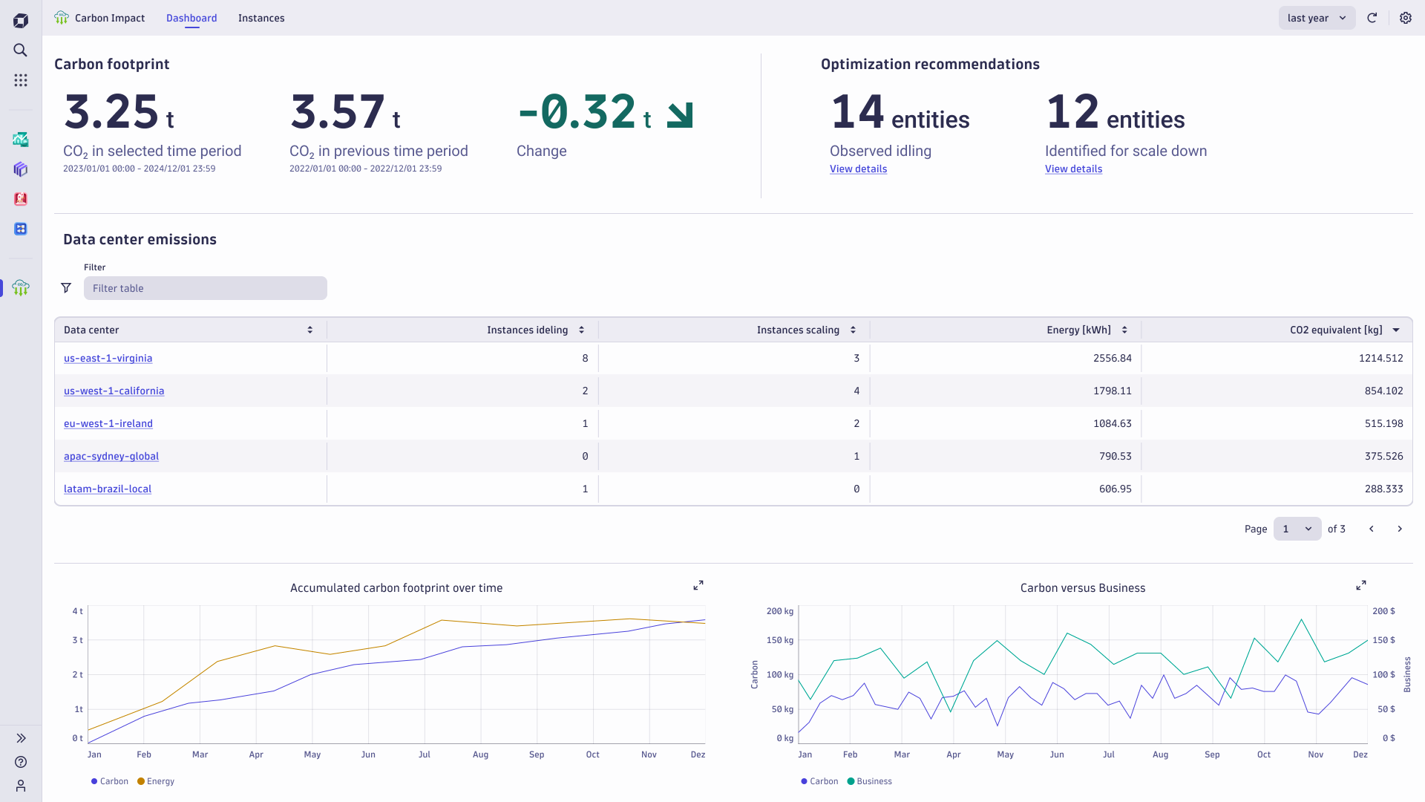
The Carbon footprint summary reports total CO2e emissions for the selected and preceding timeframes for quick interval-based comparisons.
Optimization summaries report idle instances and under-utilized instances. The app derives thresholds that influence these calculations from Google Compute Engine recommendations, although you have full configuration control to adjust these thresholds to your needs.
The table breaks down emissions by data center, listing your cloud and on-premises instances. All your carbon footprint data is in one place, and the measurement methodology is consistent across all your data centers.
Two charts complete the dashboard. The first shows accumulated carbon footprint and energy consumption over time. As cloud providers decarbonize their data centers, or as you move your workloads to more carbon-efficient locations, the slope of the carbon emission trajectory should change to illustrate the impact. The second chart allows you to compare carbon emissions over time with a business metric of your choice derived from any of your configured business events.
Instances: Where should you focus your attention?
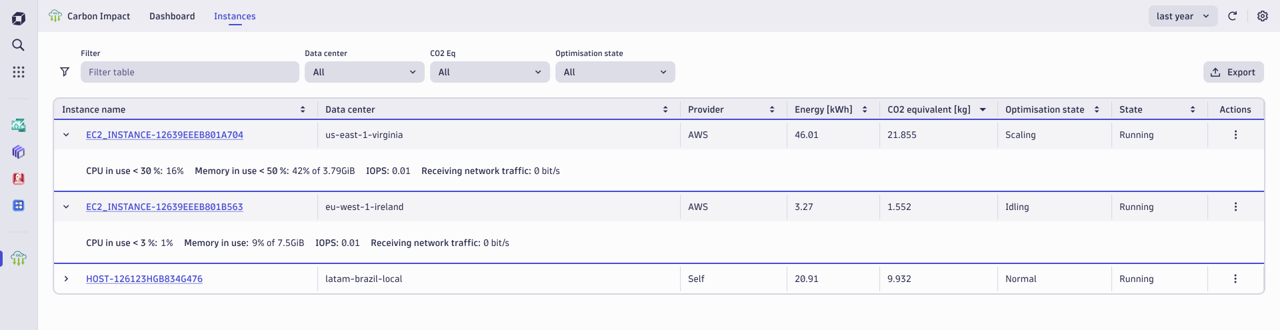
The Instances view details energy and CO2e consumption per host instance. Filters help narrow your focus. For example, you could view underutilized instances in a specific AWS data center or top CO2e emitters within a specific host group. Because Carbon Impact automatically connects to Dynatrace Smartscape® topology modeling, it’s easy to drill into host and process details. Or you can open Notebooks for ad hoc analysis, arming your teams with the insights needed to evaluate opportunities to reduce carbon emissions.
Carbon Impact and Dynatrace AppEngine
Carbon Impact tracks, reports, and helps you reduce the carbon footprint of your cloud and on-premises infrastructure. It also provides data center, host, process, and application details to help you understand where to focus your efforts. Moreover, it provides recommendations to help you get started quickly. Significantly, Carbon Impact supports multiple audiences, including compliance teams as a source for reporting, business teams that need investment guidance, and operations teams that need to act to reduce their carbon footprint.
Carbon Impact is a purpose-built app we created using the new Dynatrace AppEngine. It addresses a well-defined business need, bringing custom analytics to Dynatrace data stored in Grail. Carbon Impact is available now on the Dynatrace Hub. To learn more, please contact your account team.


Looking for answers?
Start a new discussion or ask for help in our Q&A forum.
Go to forum