
Modern organizations face growing challenges in managing thousands of distributed databases across clouds, regions, and teams, often leading to blind spots and reactive firefighting. Dynatrace’s new Database Monitoring app changes the game by providing unified visibility and AI-powered insights across your entire database landscape. With proactive health scoring, query-level analytics, and seamless integration with application monitoring, teams can quickly identify and resolve issues before they impact users. This solution empowers developers, SREs, and platform engineers to collaborate effectively, reduce complexity, and take ownership of database performance with confidence.
Organizations today rely on thousands of databases spread across clouds, regions, and teams; traditional monitoring tools simply can’t keep up.
In the AI era, databases are increasingly ephemeral; workloads are massively data-intensive, and debugging efforts span across complex, distributed systems. Simply put, traditional tools were never designed for this pace or scale. Fragmented tooling and data silos add complexity, while usage-based costs limit observability, creating blind spots and slowing issue detection. Teams often end up firefighting problems, such as slow queries and deadlocks, leading to operational fatigue and delayed resolutions that impact performance and innovation.
At the same time, as database reliability shifts from DBAs to engineering teams, visibility gaps and expertise challenges grow. Developers often lack feedback on how their code impacts performance, which slows down releases, increases risk, and makes collaboration with SRE and platform teams more challenging. With many developers lacking in-depth database knowledge, it’s crucial to deliver tools that simplify management and provide actionable insights, allowing teams to innovate faster without compromising reliability.
It’s time to transform database observability with an AI-native approach designed specifically for developers, SREs, and platform engineers. Dynatrace’s new Database Monitoring solution is revolutionizing database observability with unified visibility across your entire database estate, from on-premises to hybrid and multicloud environments.
Unified observability across your entire database estate
The new Dynatrace Databases app, powered by the Dynatrace® unified observability platform, takes database monitoring to the next level with deep, actionable insights.
You can now monitor entire database clusters, gain deep AI-powered insights with remediation plans and alerts, and access granular visibility to reduce outages and downtime. Essentially, this means you can now go beyond basic health checks and gain visibility into:
- Query-level analytics and transaction tracing across services to pinpoint performance bottlenecks.
- Schema and index behavior analysis to understand structural inefficiencies.
- Preventive alerts and insights that help you act before issues impact users.
- Historical and real-time performance trends for smarter optimization and capacity planning.
With all critical data in one place, practitioners get a holistic view of their entire ecosystem. What used to take significant time, resources, and tools is now available in one central place.
The Databases application was designed to monitor a diverse range of database technologies across on-premises, public cloud, and hybrid cloud environments. With native support for cloud-specific services, Dynatrace delivers comprehensive coverage regardless of your infrastructure strategy.
From reactive to proactive database monitoring
Proactive database monitoring starts here. Instead of waiting for problems to surface and reacting to outages and slowdowns, teams can now prioritize the necessary adjustments to keep their databases healthy and performing optimally, and to ensure their applications run smoothly. This proactive approach drives performance improvements beyond query optimization, allowing you to address issues before they impact users.
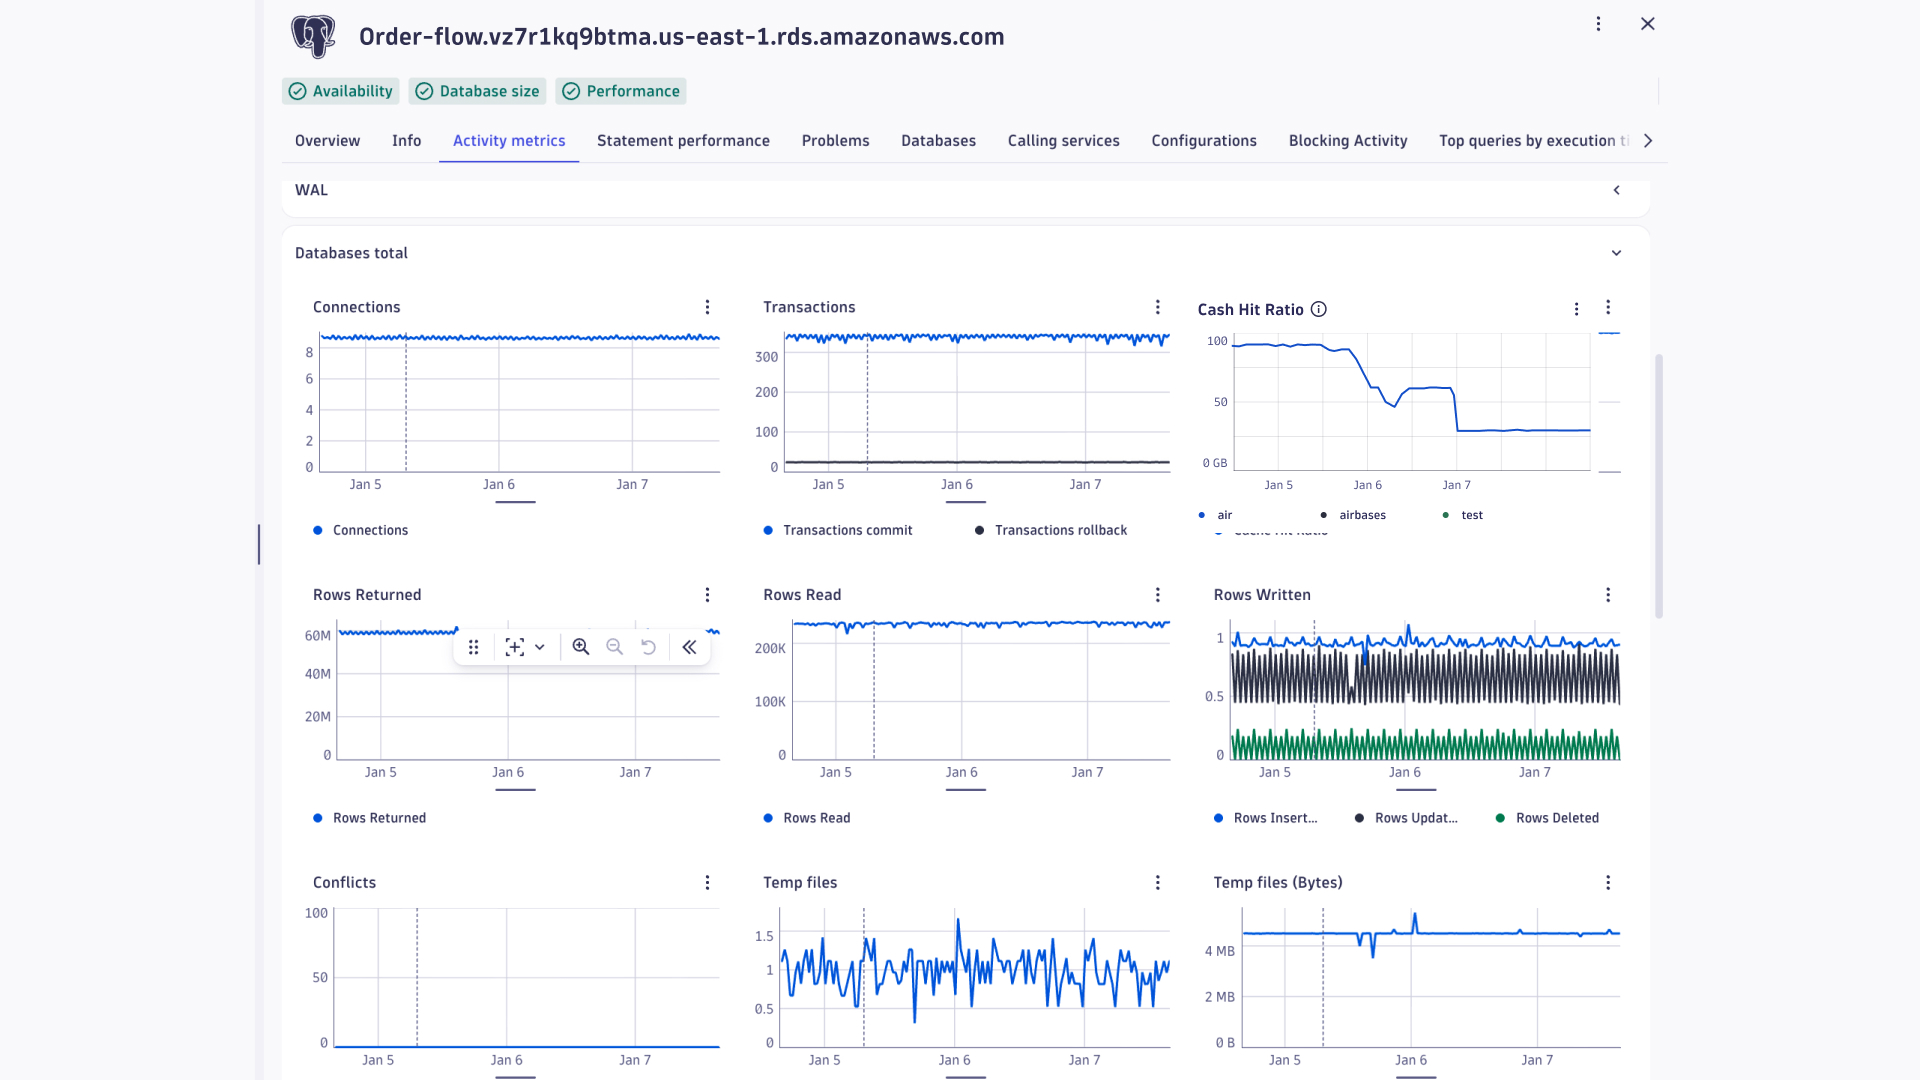
With granular database views and new metrics, including replication status, cache hit ratios, lock contention, and server pulse overviews, practitioners gain the clarity needed to make informed decisions.
With real-time intelligence, Databases eliminates silos to help you optimize performance, reduce time to resolution, and deliver a seamless user experience. Combined with APM integration, Dynatrace delivers end-to-end visibility from services down to individual database queries, so you can understand how the layers interact.
How it works
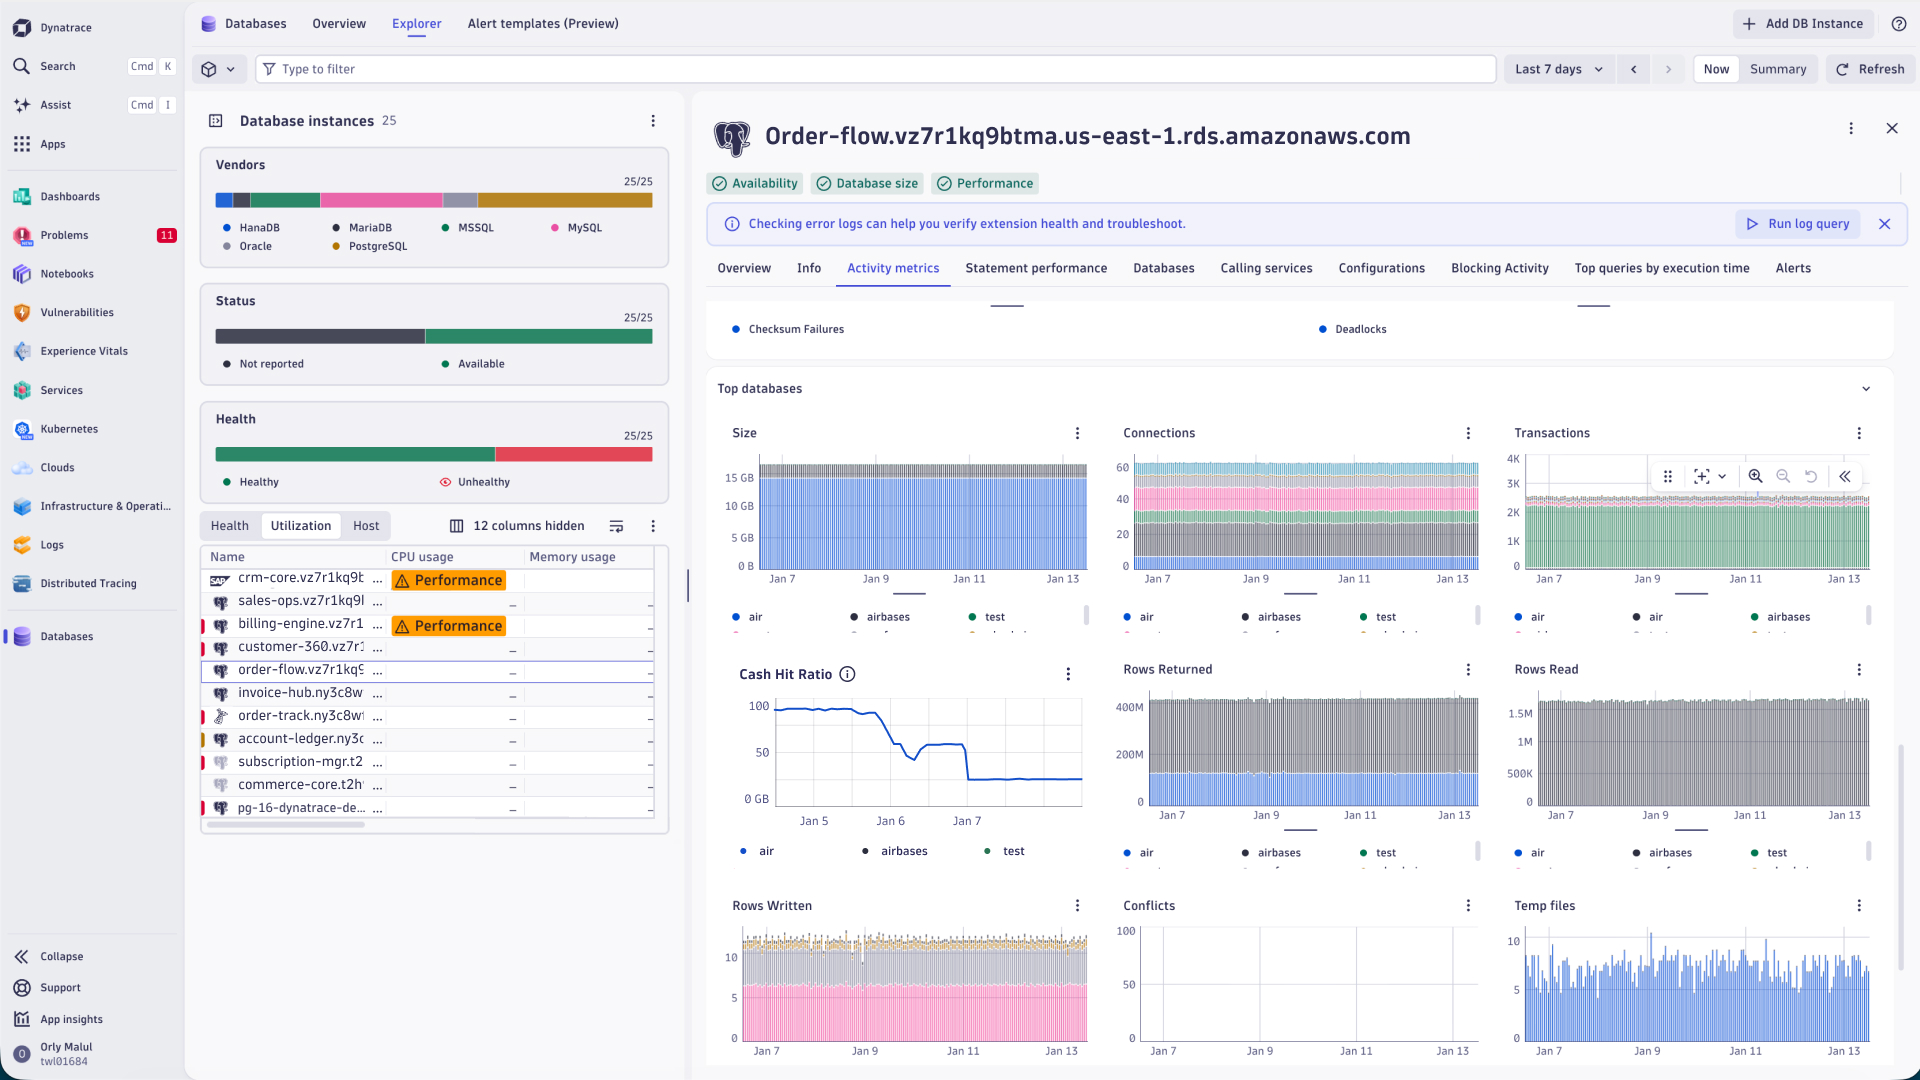
After a seamless and quick integration, Databases immediately provides you with an overview of everything happening across all your databases.

You can dive deeper into the instances you’re responsible for. Go to the Overview tab and view the Health score, which indicates the instance’s health.
The health score is an innovative feature that allows you to be proactive with your database fleets and make sure they always meet your application needs. In this example, you can see how a low health score indicates a database health issue related to the instance’s Cache Hit Ratio.
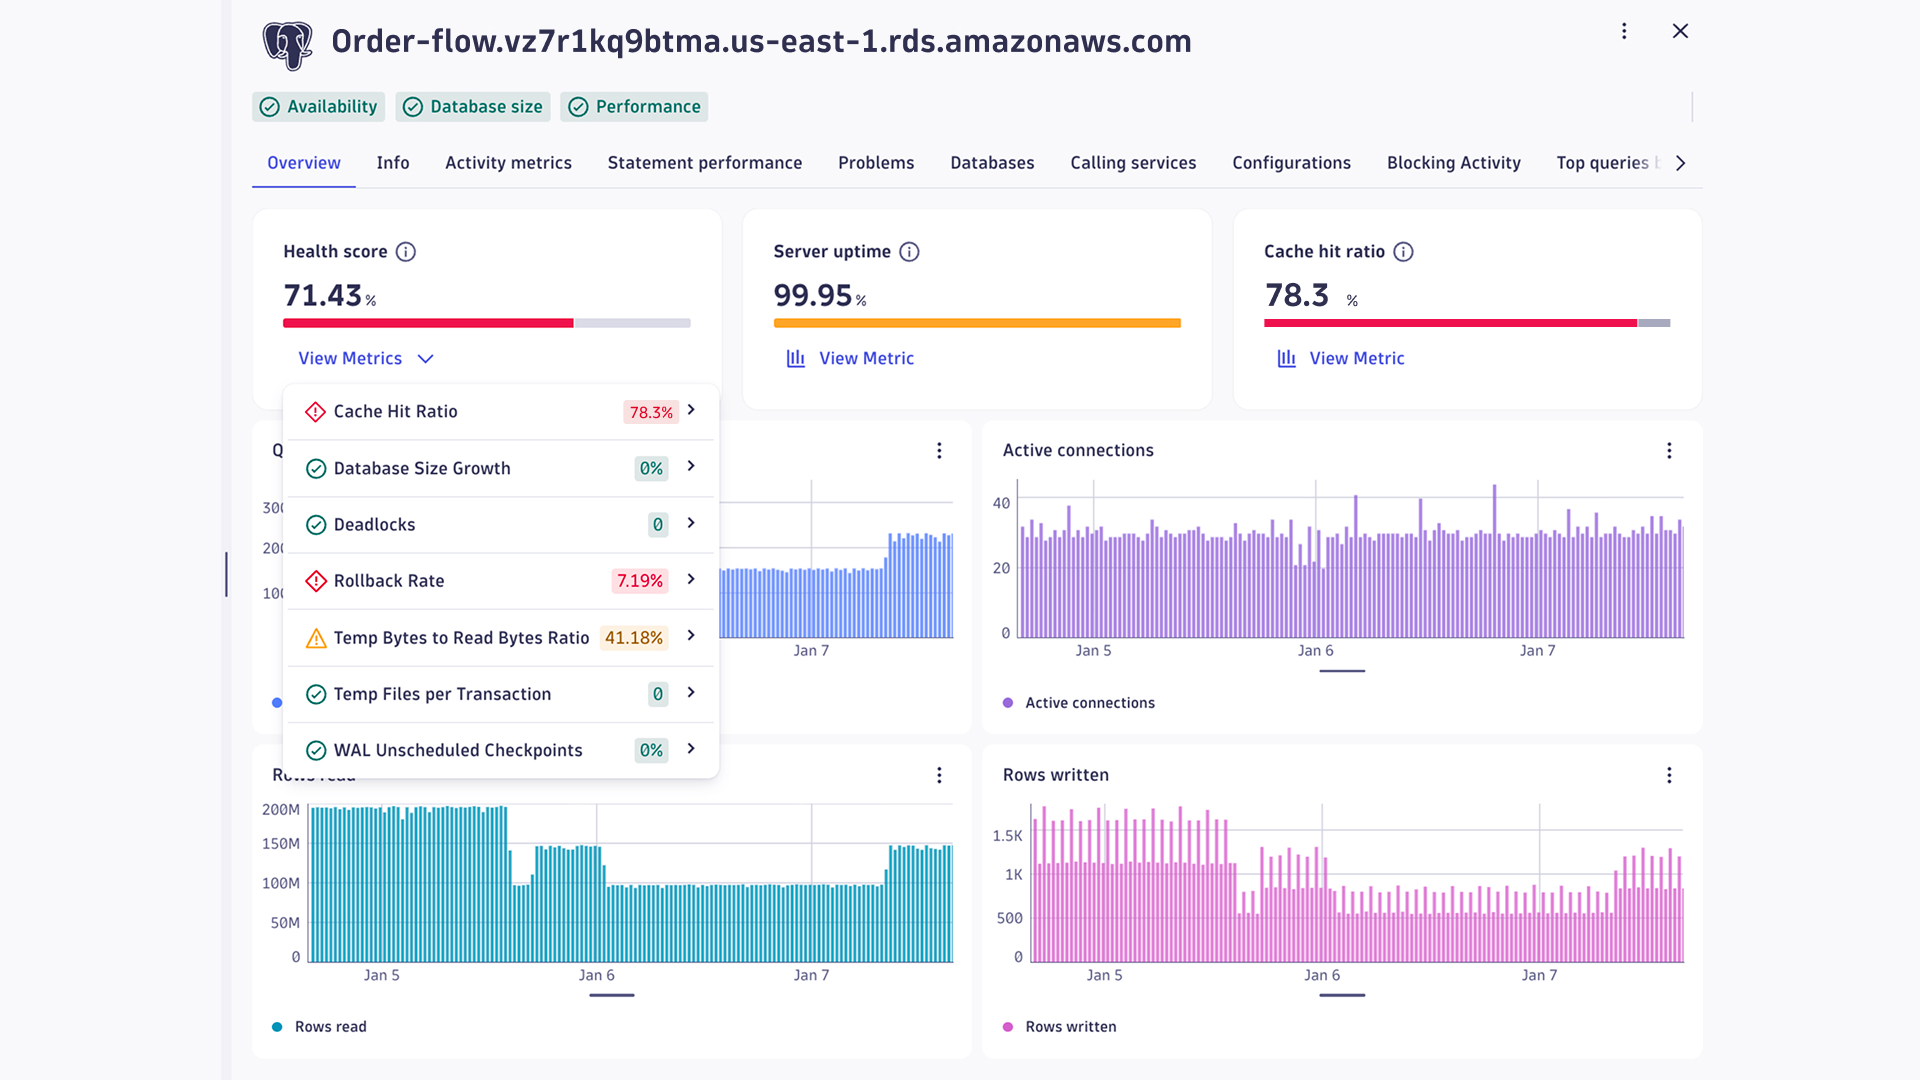
Once you have a clear indication of what’s preventing a database from maximizing its potential, you can dive deeper into that specific database and the database calls reported as the root cause of the problem, all from the health score.
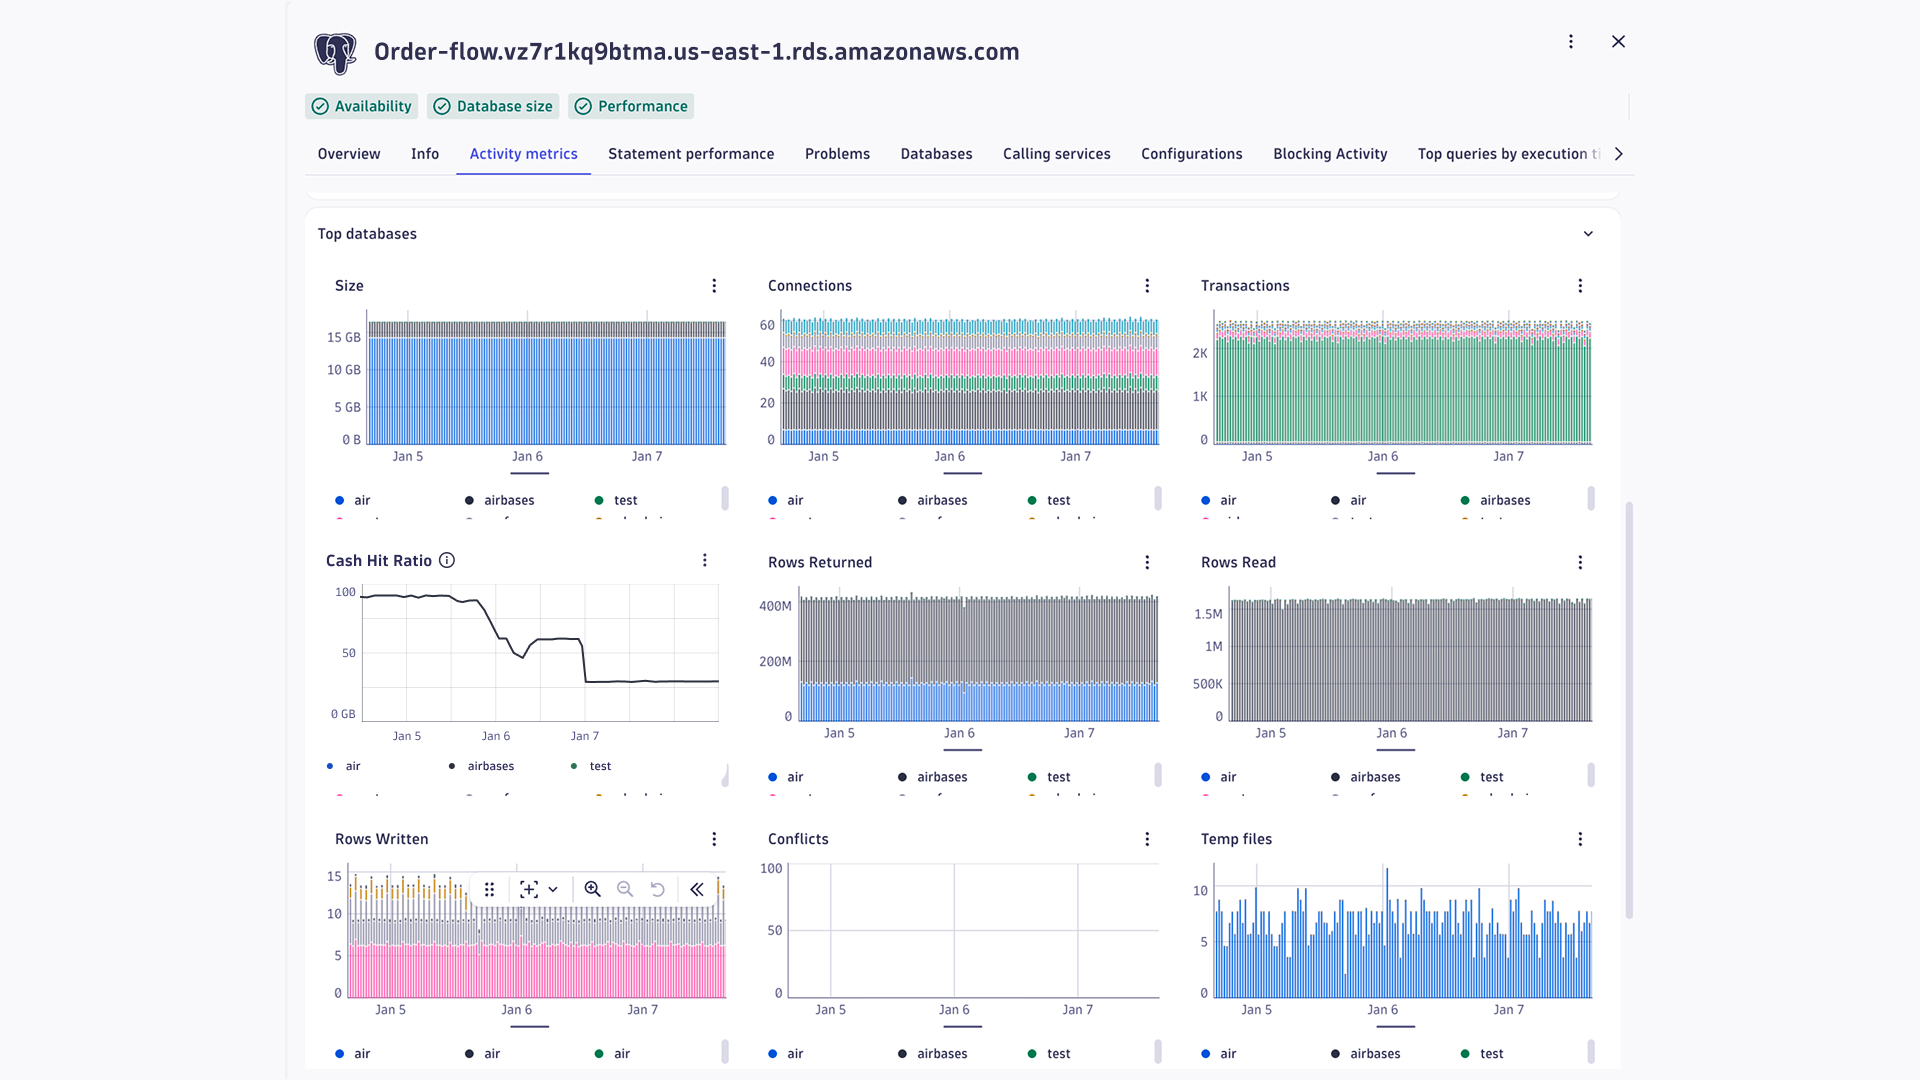
In the above graph, we can see that the problem is within the airbases. Now that we know which database is causing the problem, we can access it and debug the queries that are contributing to the low database Cache Hit Ratio.
Seamless debugging across databases and services
Experience the full power of Dynatrace’s unified platform by taking your database monitoring a step further. Monitoring your databases and services together in Dynatrace gives you a holistic view of your application ecosystem. This integration allows you to quickly get to the root cause, identify the issues, and transition effortlessly from the Database app to the Services app for deeper analysis, quick and efficient debugging, and resolution.
Let’s take a look at an example. Let’s say one of your databases experiences a Cache Hit Ratio problem, as depicted in the screenshot below.
From the database host overview page, go to the Calling Services tab. Here, you can pinpoint which service is causing, or is impacted by, the issue based on certain metrics:
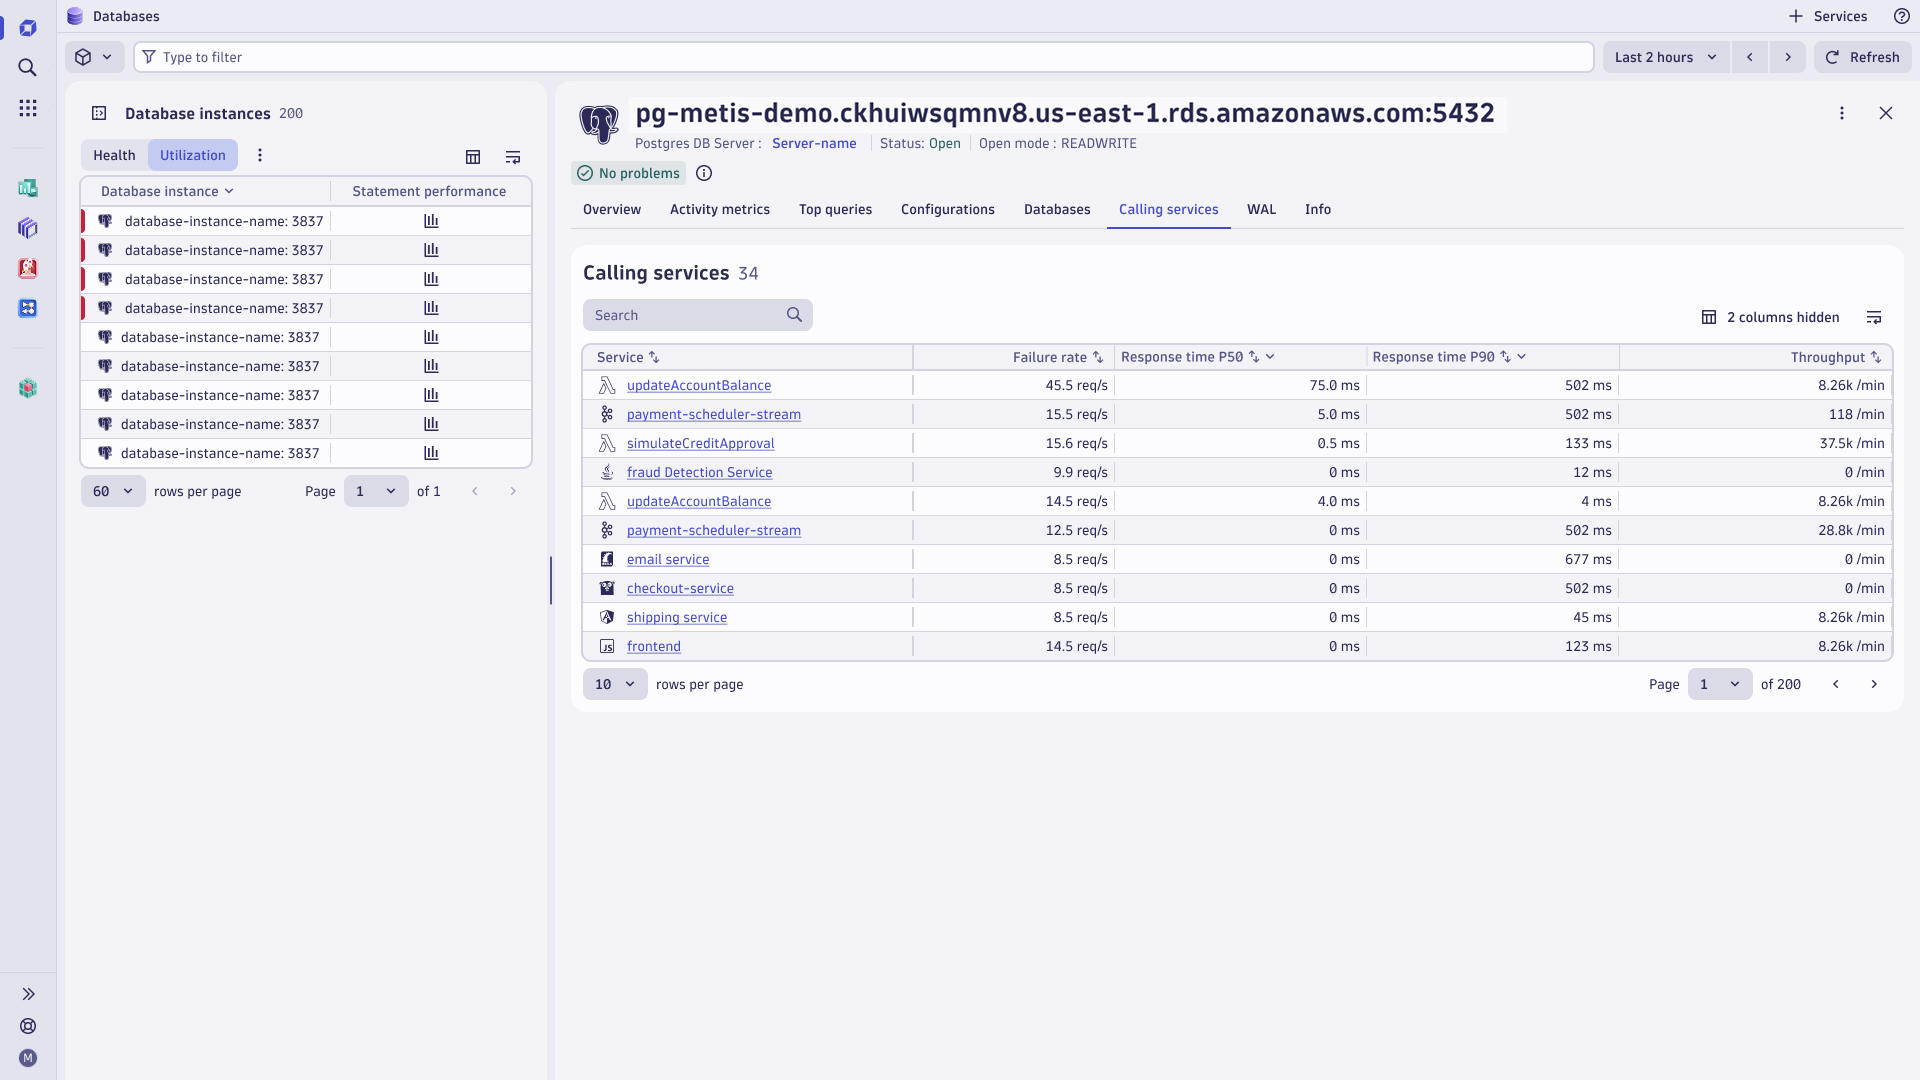
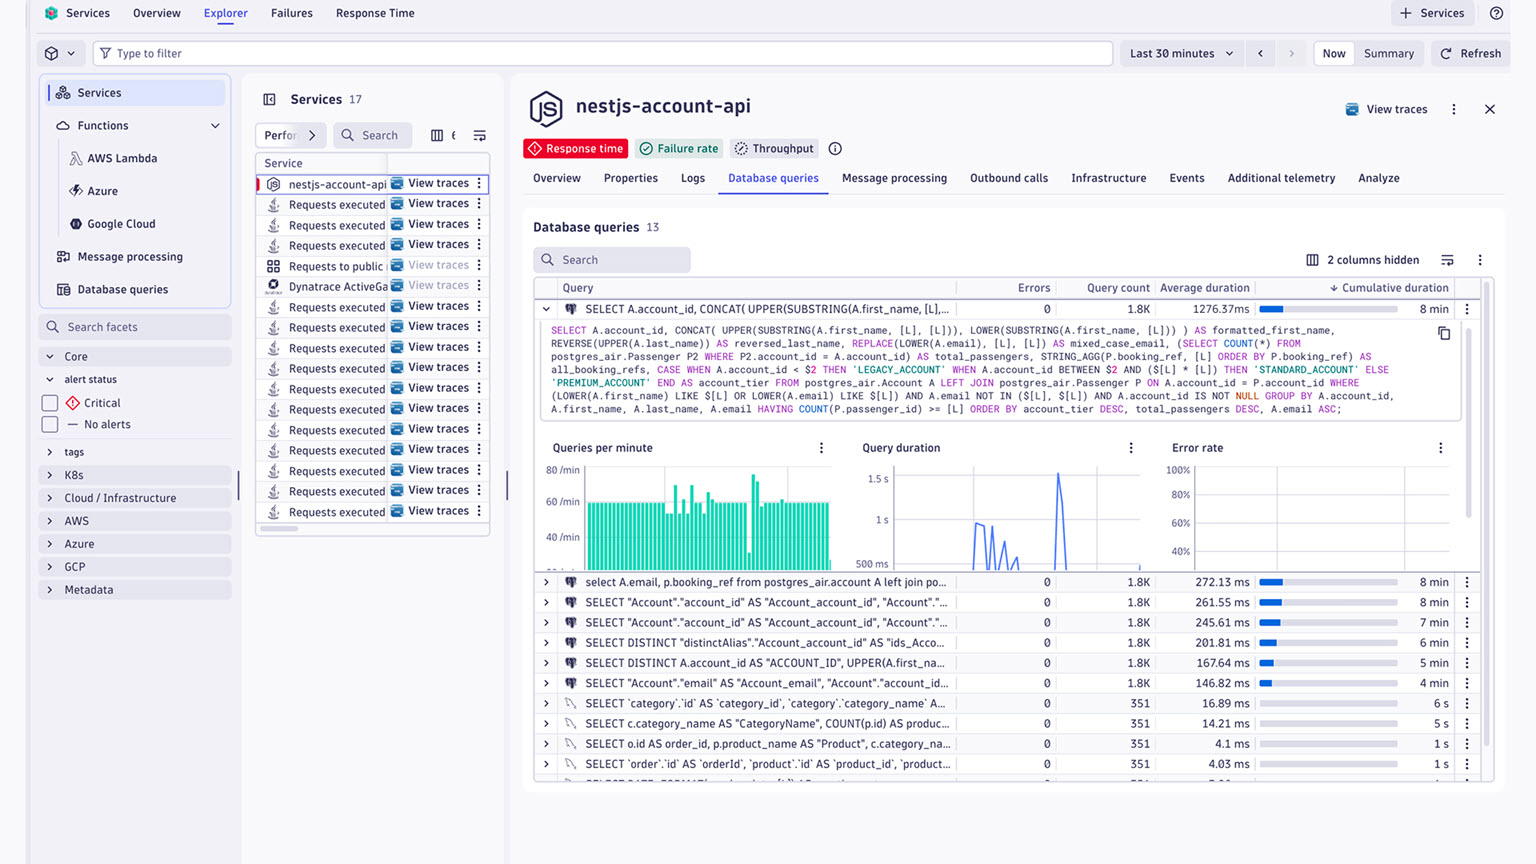
Once you identify the problematic service in the Databases app, go to the Services app. There, you can debug the root cause by analyzing the problematic queries in detail.
Get started
By breaking down silos and delivering intuitive, actionable insights, the new Dynatrace Database Monitoring solution helps teams collaborate seamlessly, reduce complexity, and take ownership of database performance with confidence. From unified observability and AI-powered analytics to proactive health scoring and end-to-end debugging across databases and services, Dynatrace transforms how you manage and optimize your database landscape.
Ready to experience Dynatrace database monitoring for yourself? Explore the full capabilities today and see how effortless it can be.


Looking for answers?
Start a new discussion or ask for help in our Q&A forum.
Go to forum