
For some time now, Dynatrace has provided the ability to register and monitor custom (network) devices using the Dynatrace API. Over the past few months, this functionality has been widely used to gain visibility into custom devices where OneAgent can’t be installed. It’s amazing to see your custom-defined devices automatically integrated into Smartscape once you provide basic metadata like an IP address or DNS name. As soon as Dynatrace detects calls to a custom network device, the calls are automatically mapped as a dedicated service on top of the related device. Such automated integration allows Dynatrace AI to place custom devices and calls into context when it performs root-cause analysis.
While you can use the Dynatrace API to create and maintain custom devices, there are situations where it’s more convenient to manage custom devices via the Dynatrace web UI and to use the API just to report the corresponding health metrics. This is why we now provide the option to define custom devices with just a few clicks via the web UI (select Technologies from the navigation menu and then click the Custom devices button). In this way, it’s now easy to add new custom devices, and even whole new categories of technologies, to Dynatrace.
Automatic categorization of external and internal dependencies
Dynatrace splits up external dependencies into the two categories (Requests to public network and Requests to unmonitored hosts) based on whether or not a call resolves to a public or a private IP address. All outgoing calls that resolve to an internal IP are categorized as Requests to unmonitored hosts. This is important because internal calls are typically processed on systems that are under the responsibility of the same company and therefore require special attention when they have problems.
Split up requests to unmonitored hosts
To split up internal requests and map them to dedicated devices:
- Select Transactions and services from the navigation menu.
- On the All monitored services page, filter the list of transactions by Scope and usage > External dependencies.
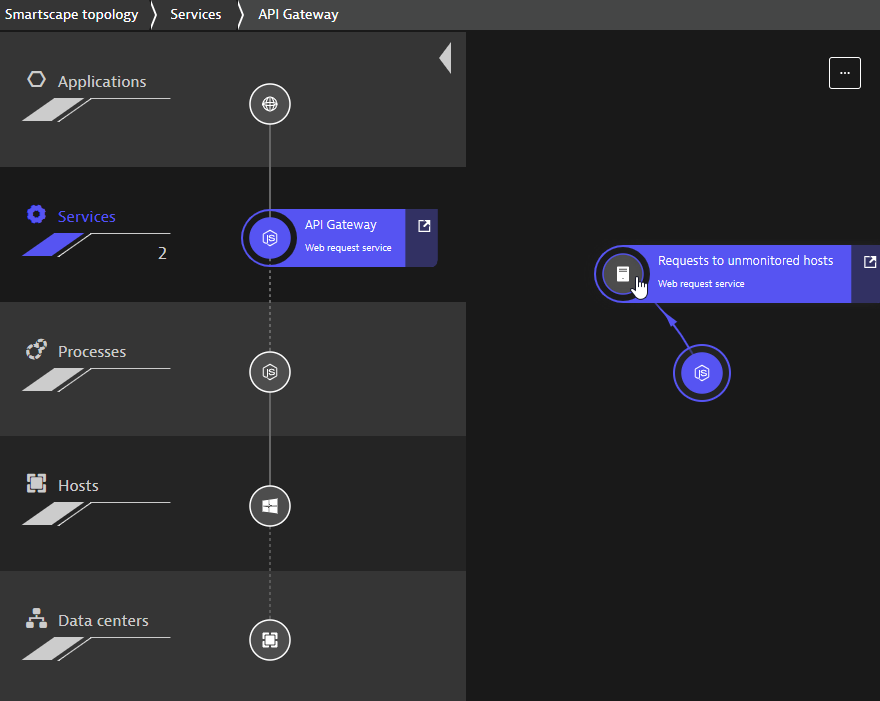
- If Dynatrace OneAgent has detected requests to unmonitored hosts, you’ll see a service listing here called Requests to unmonitored hosts. Select this listing.
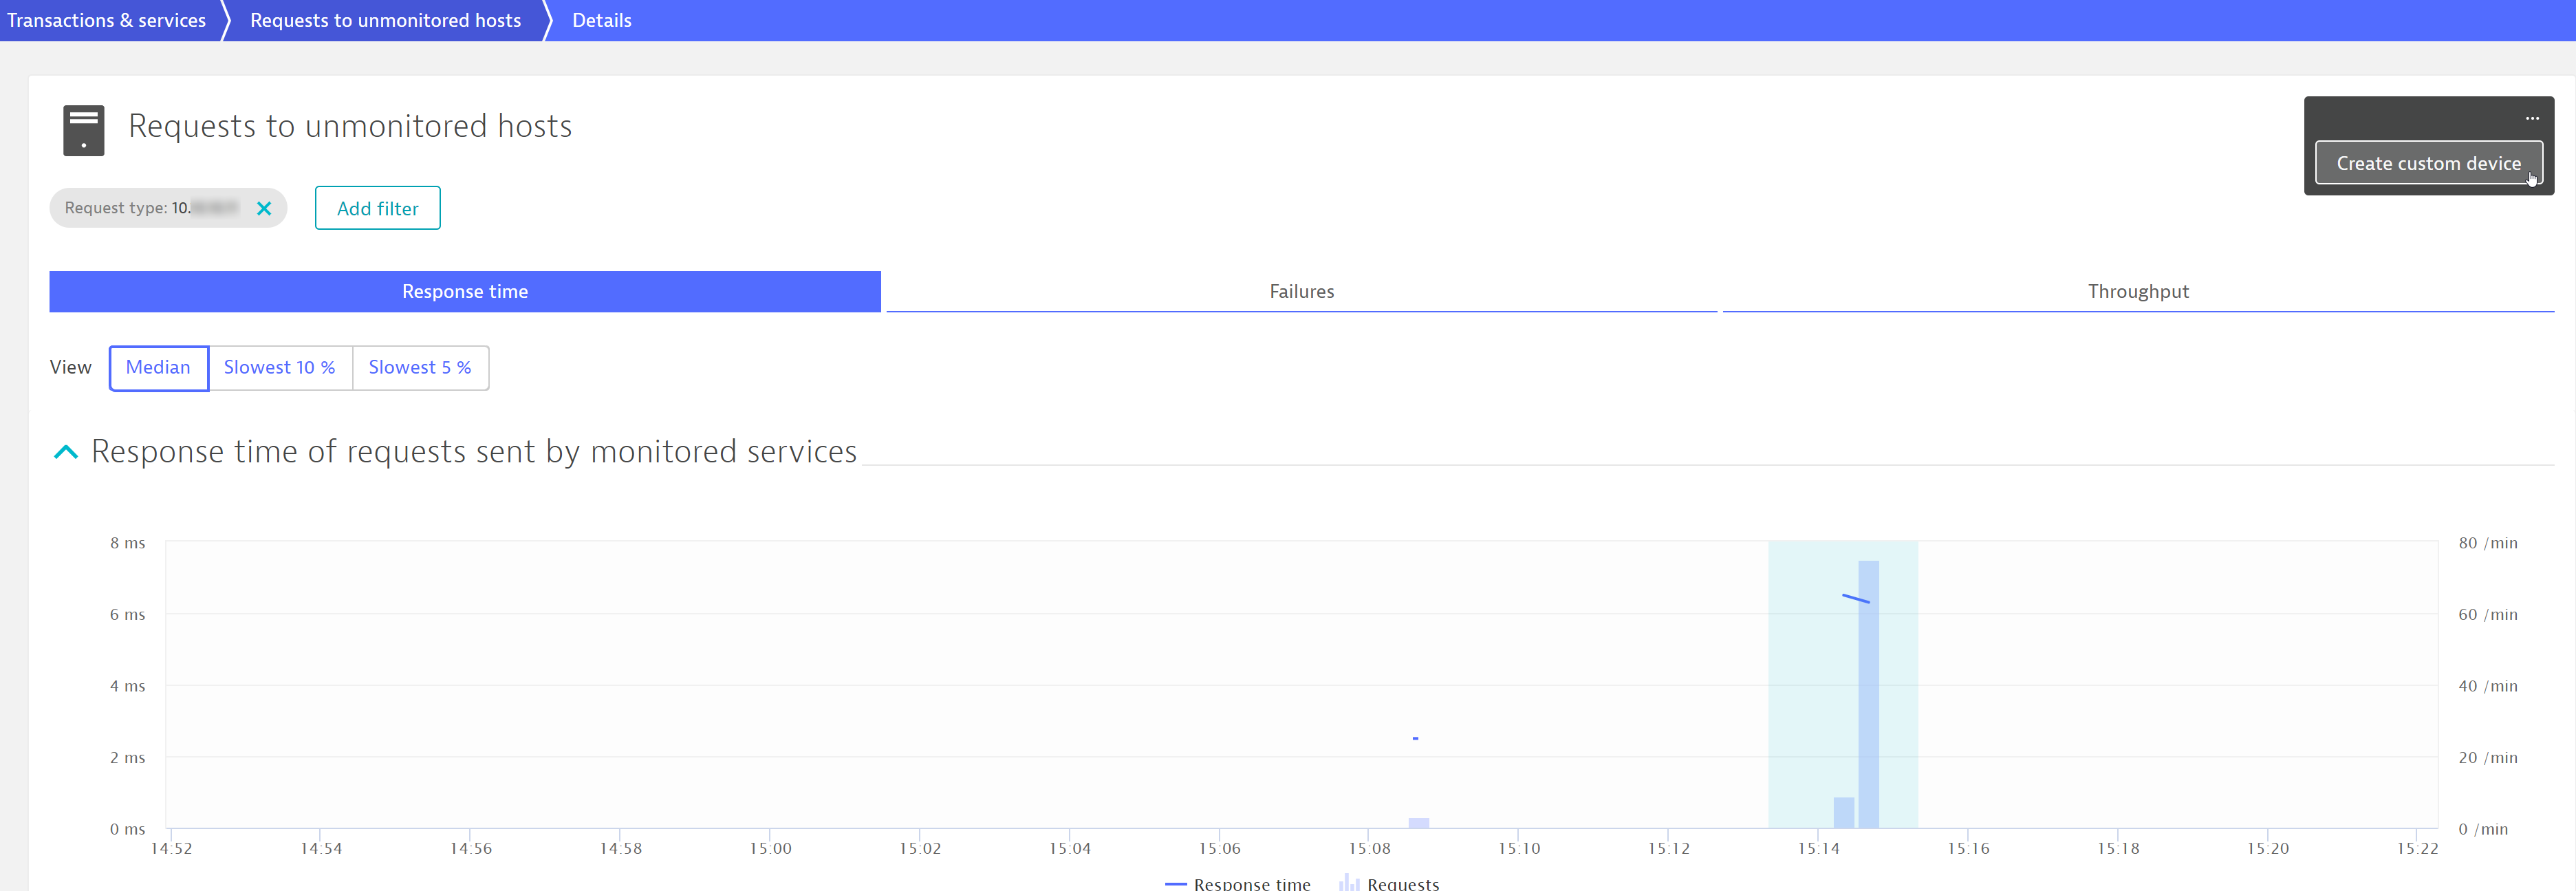
- Click the View requests button and scroll down to the Top domains section. Here you can see all the IPs and domains that are included in the requests to unmonitored hosts.
- Click one of the Top domains to filter the page results down to just the selected domain.
- In the upper-right corner of the Details page, you’ll now find a Create a custom device button especially for the selected domain (or IP, if the IP address is called directly).
- Open the […] on the top right and click Create custom device to go to the General settings page.
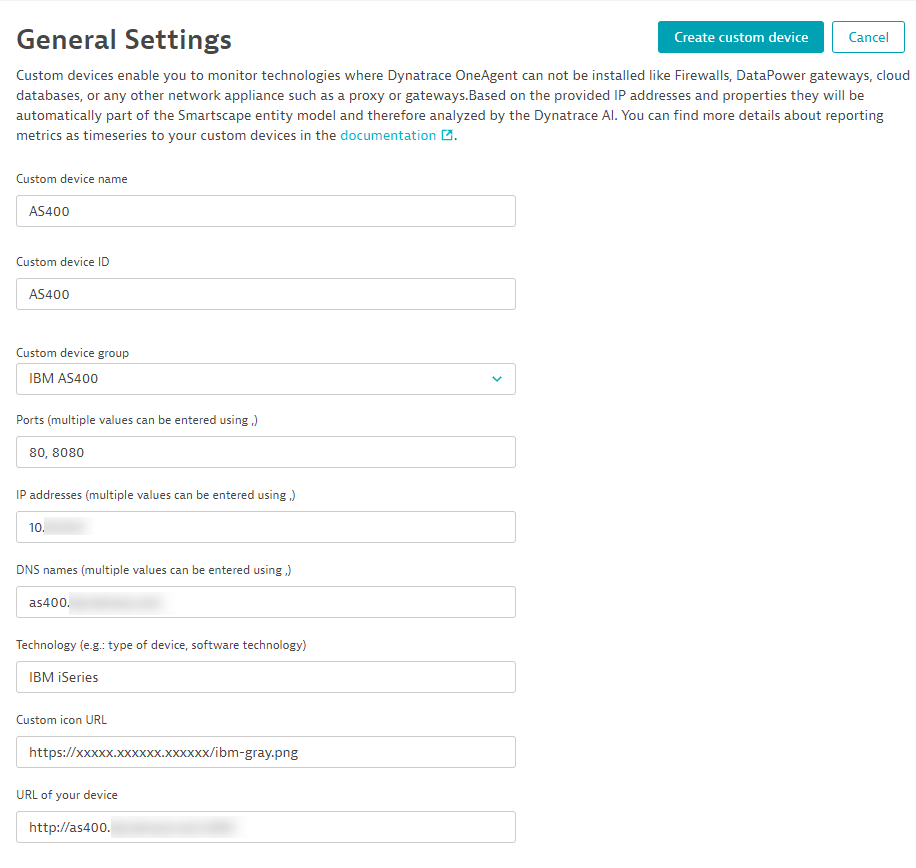
The fields on the General settings page are prefilled with all available information. You just need to add any missing details.
The Custom device ID needs to be the unique ID of the custom device. This ID will be included in the API endpoint that’s used to report the metrics of this device to Dynatrace. This field is prefilled with a generic ID. You can change it to something more readable, but the value must be unique.
Each device must be part of a Custom device group. Device groups enable you to monitor multiple devices that logically belong together and run the same service within load-balanced environments. You can either select an existing device group or enter the name of a new group that your device should be assigned to. Note that, once assigned, a device can’t be assigned to a different group.
Type in a Technology type to categorize your new device on the Technologies overview page. Typically devices of the same technology share the same health metrics and so are comparable.
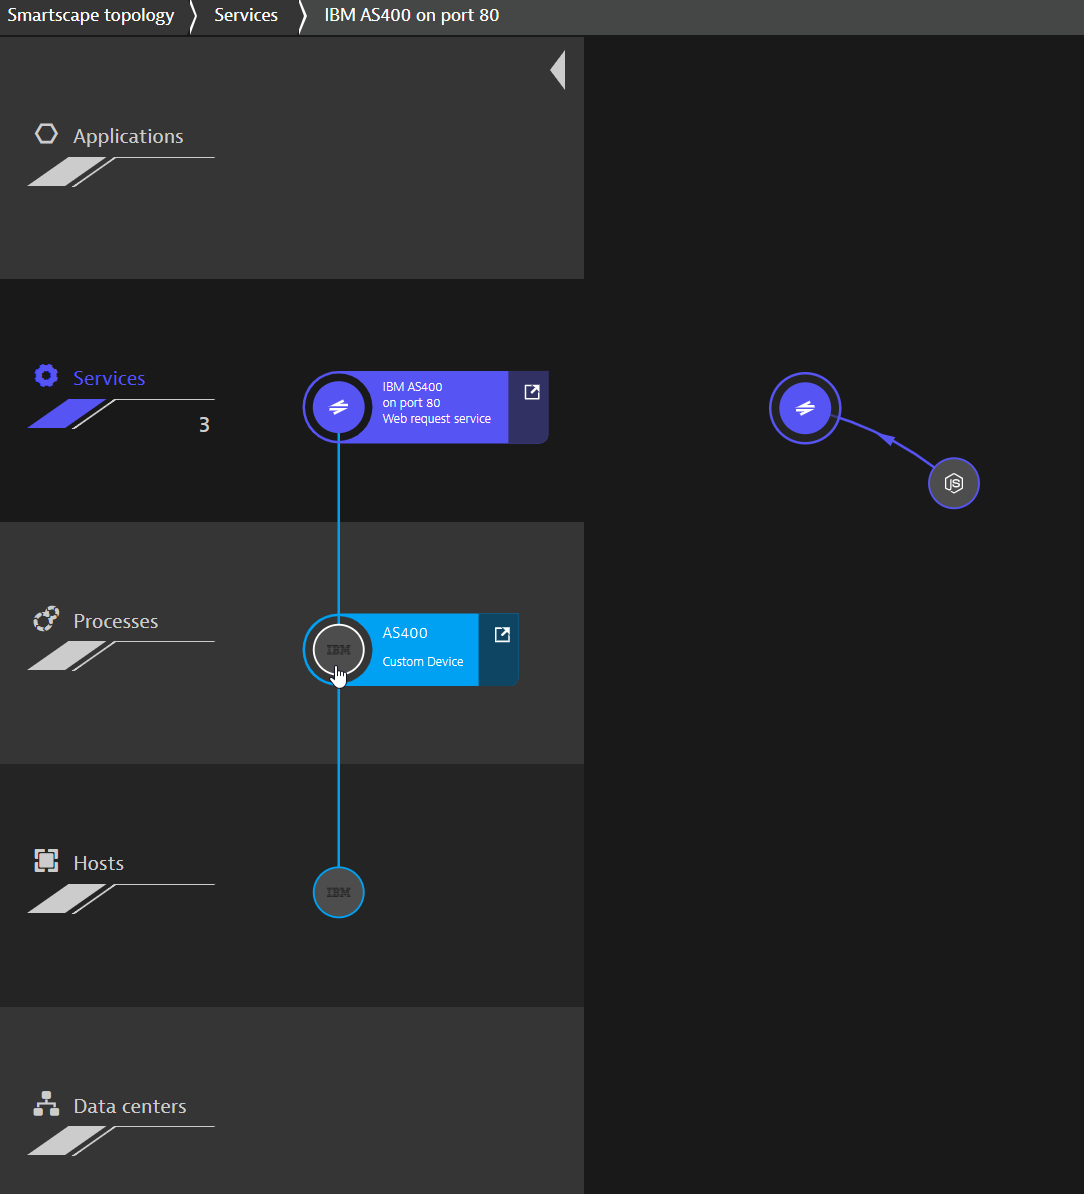
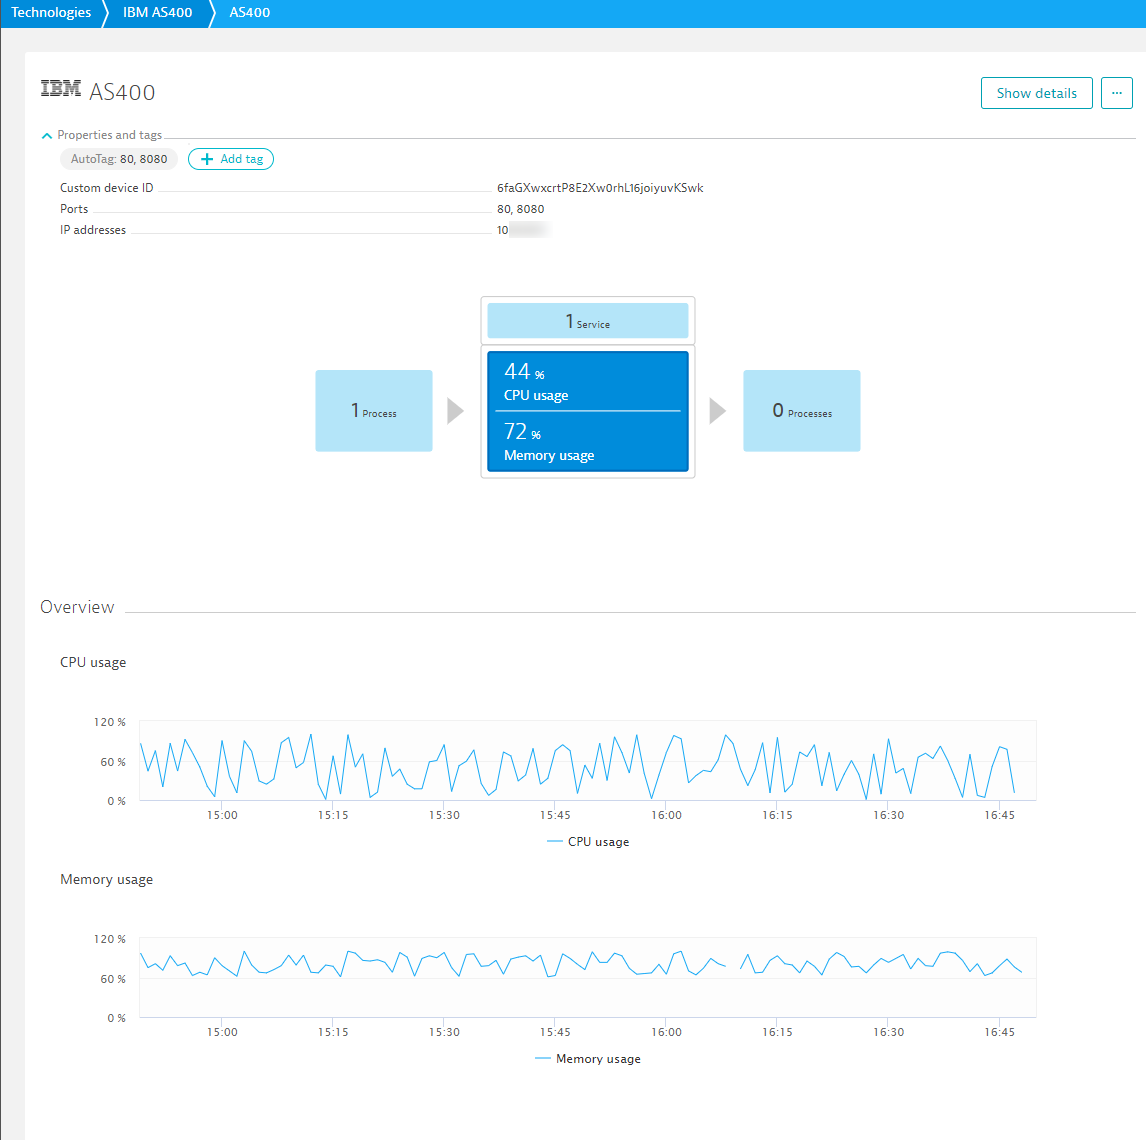
The Custom icon URL field on the General settings page can be used to define a symbol that is used within Smartscape and on all overview and detail pages that show the device. Such icons can help you visually identify specific devices across Dynatrace analysis views (for example, the IBM icon that appears in two of the images below).
Enter the URL of your device so that you can quickly access it in the event that Dynatrace detects a problem with it.
Once you create a custom device, the device appears on the Technologies overview page as well as in Smartscape and the corresponding requests are mapped accordingly (see examples below). You can register and report the corresponding metrics using the Dynatrace Timeseries API. All monitored requests that lead to your custom devices are automatically mapped as services that are dedicated to the device and, thereby, factored in Dynatrace AI-driven root-cause analysis.
How to delete a custom device
Custom devices that are added via the UI won’t age out automatically if no metrics are reported to them (in contrast to devices that are created using the API). If you need to remove a custom device (for example, if a device is decommissioned), go to Technologies and click the Add custom device button. Then click the Delete button of the device you want to remove. In this same way, you can also delete custom devices that have been created via the API.


Looking for answers?
Start a new discussion or ask for help in our Q&A forum.
Go to forum