 Salesforce Extension
- Product information
- Release notes
Overview
The Salesforce extension can capture three types of Salesforce data:
- Event Streaming - Capture real-time events from Salesforce and send them as RUM sessions or Business Events to Dynatrace.
- Event Log File - Capture event log files from Salesforce and ingest them as logs to Dynatrace
- API Queries - Run SOQL queries against Salesforce and ingest the data as logs
Event Streaming
Overview
The Event Streaming configuration allows you to monitor the usage of your Salesforce CRM account.
Enable use cases like:
- What are the slowest Lightning or Classic pages response times
- Track Session Hijack, Credential Stuffing and Anomaly Events
- Track important permission sets changes
- What files are being uploaded and download? By which users?
- What are the most used reports, who is running them, what queries are being used?
- How many users are using the platform currently, what is the user experience?
- What are the top API Queries being made?
- Where is Salesforce being accessed from?
- What browsers are users using?
Requirements
- A Salesforce account with real time event streaming enabled
- For Username + Password authentication, the username, password and security token
- For Connected App authentication, a Connected App with a pem certificate
- An Environment Activegate
Details
The extension uses the Salesforce Pub/Sub API to listen for Event Streaming Events.
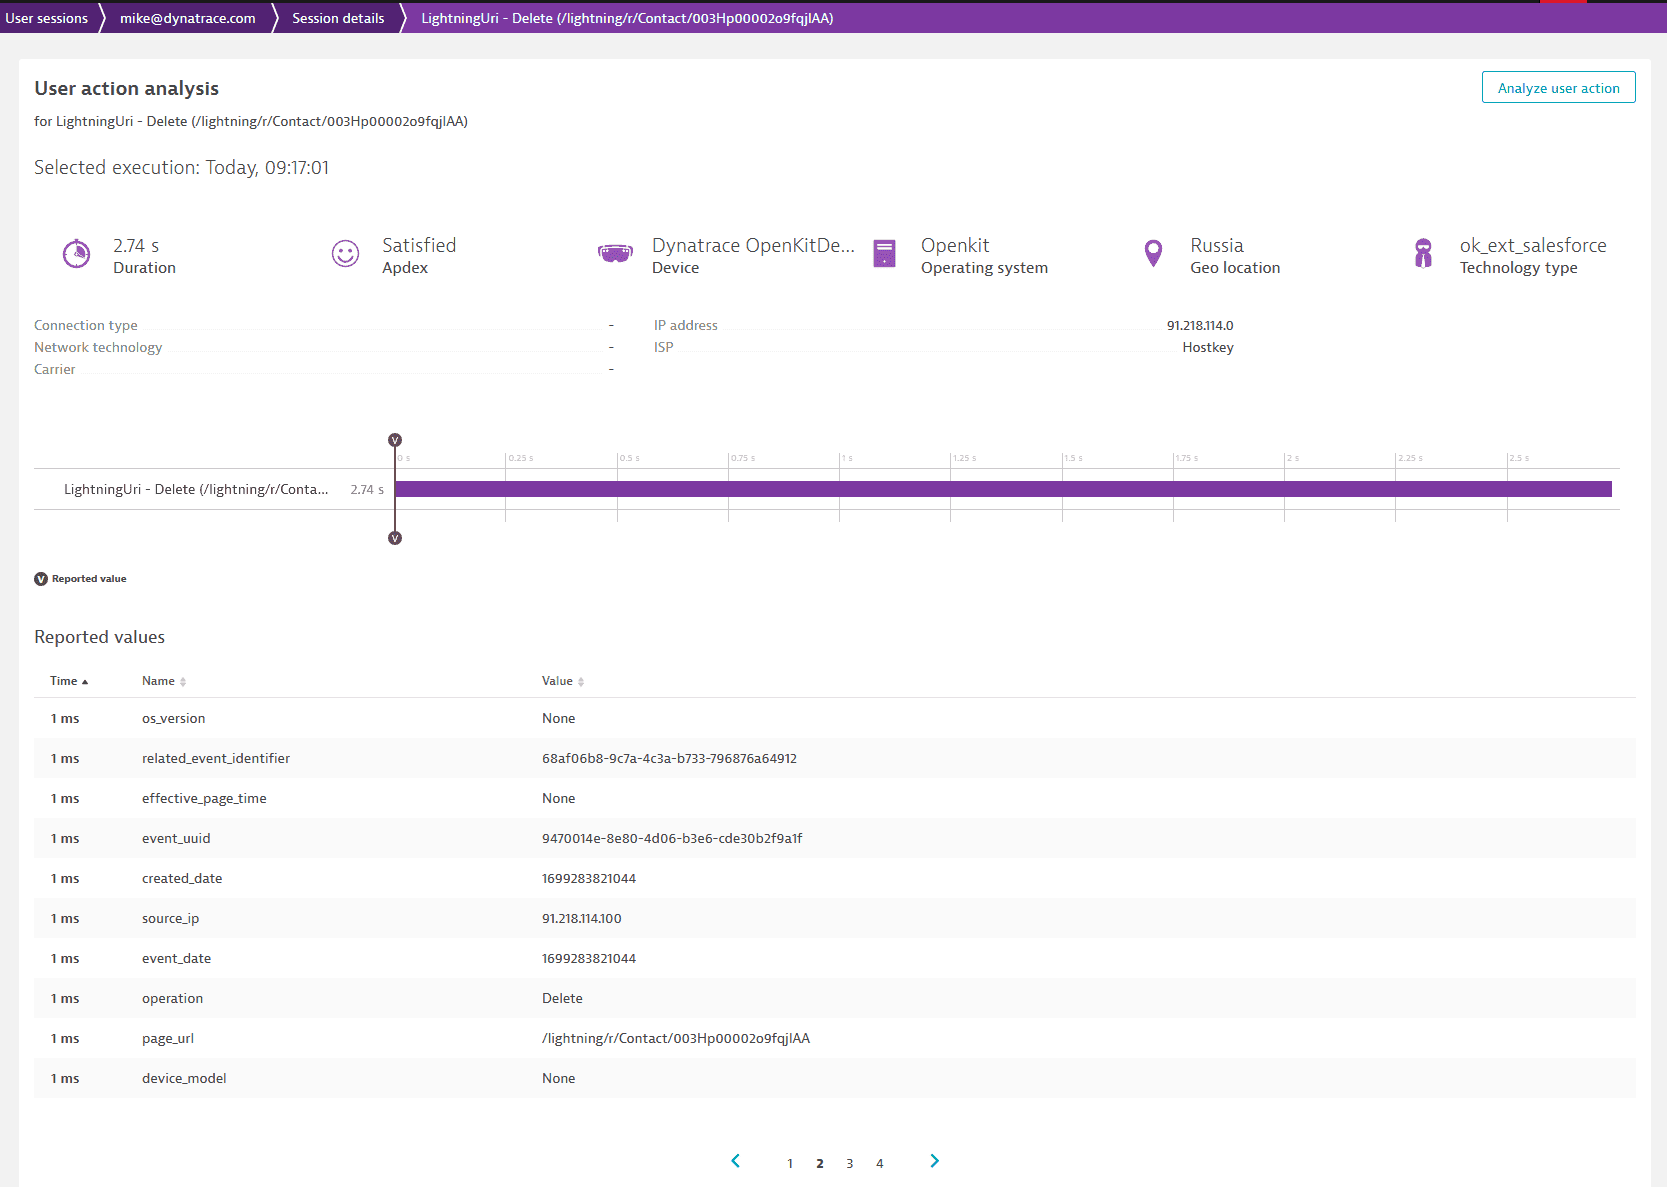
These events are captured and sent as User Actions with all their respective properties sent as Action Properties. The event properties can be seen by
clicking on an User Action > Perform waterfall analysis
A detailed description of every event and their properties can be found on the Salesforce documentation.
The current events being captured are:
- ApiAnomalyEvent - Track anomalies in how users make API calls
- ApiEventStream - Track user API queries in your org
- BulkApiResultEvent - Track when a user downloads the results of a Bulk API request
- ConcurLongRunApexErrEvent - Track when a Concurrent Long Running Apex error has occurred
- CredentialStuffingEvent - Track when a user successfully logs in to Salesforce during an identified credential stuffing attack
- FileEvent - Track file activity. For example, track when a user downloads or previews a file
- LightningUriEventStream - Track when a user creates, accesses, updates, or deletes a record in Salesforce Lightning
- ListViewEventStream - Track when a user accesses data with list views
- LoginAsEventStream - Track when an admin logs in to your org as another user
- LoginEventStream - Track when a user logs in to your org
- LogoutEventStream - Track when a user clicks Log Out in the Salesforce UI
- PermissionSetEvent - Track when users are assigned the Modify All Data or View All Data permission through a permission set
- ReportAnomalyEvent - Track anomalies in how users run or export reports
- ReportEventStream - Track when a user accesses or exports data with reports
- SessionHijackingEvent - Track when an unauthorized user gains ownership of a Salesforce user’s session with a stolen session identifier
- UriEventStream - Track when a user creates, accesses, updates, or deletes a record in Salesforce Classic
Important
The extension is limited to events that Salesforce produces as Real Time Events.
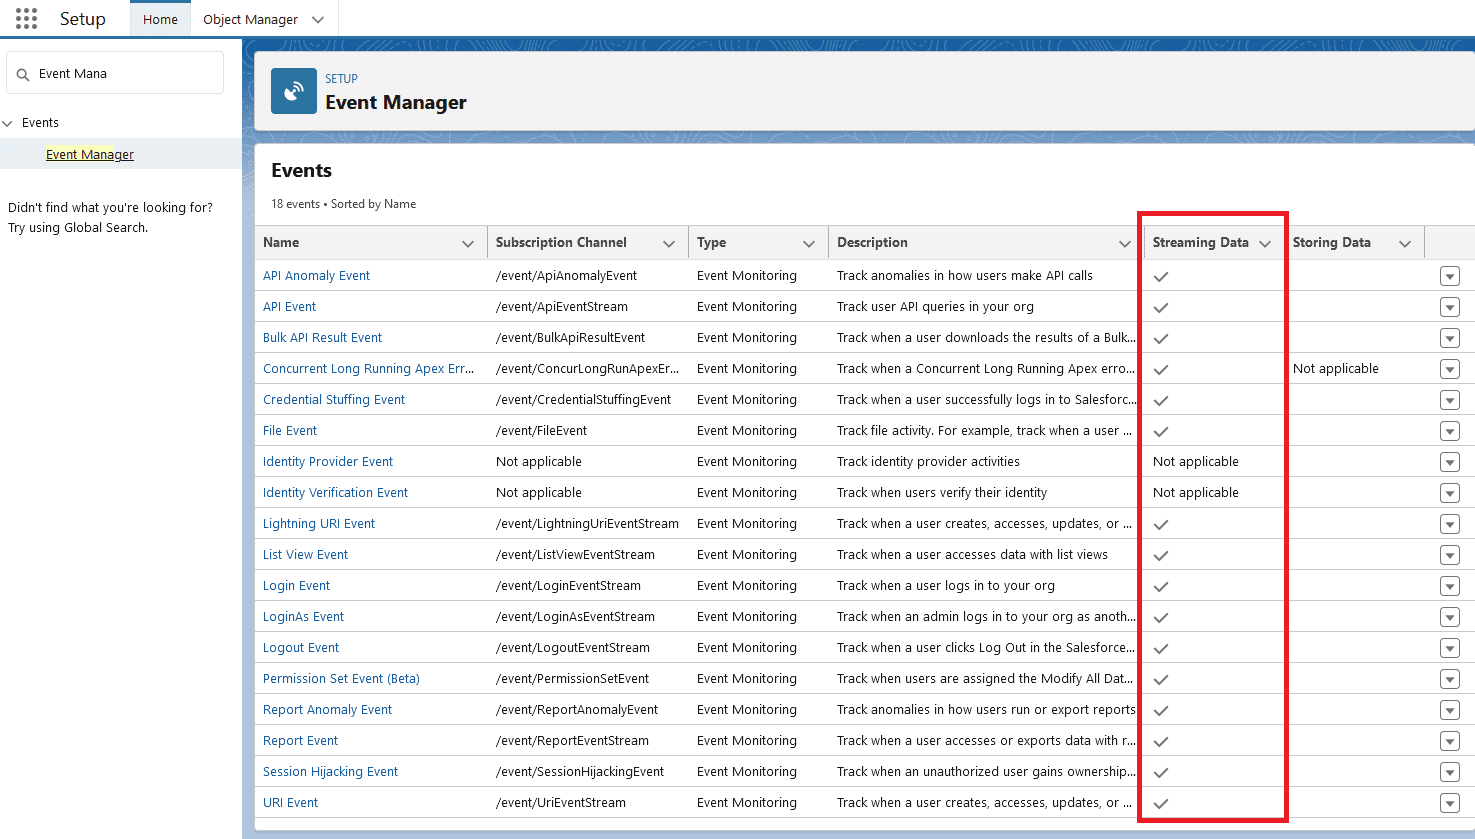
Salesforce Account
- Under
Setup->Event ManagerenableStreaming Datafor the events you want to capture. - Obtain the credentials needed for the extension to connect to Salesforce.
- For Username + Password authentication, check the User and Password Authentication section of this documentation
- For Connected App authentication, check the Connected App Authentication section of this documentation
Dynatrace
OpenKit Reporting
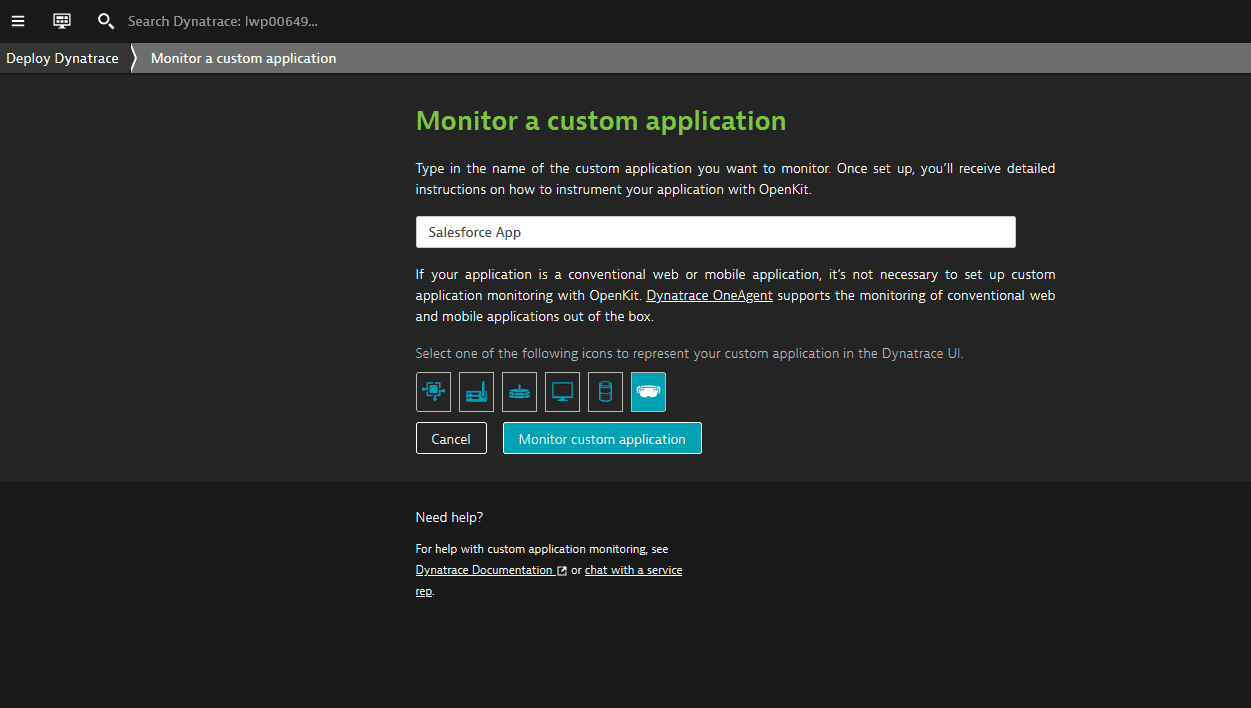
Create a Custom Application to receive the data:
- Navigate to
Digital Experiences->Custom Applications->Create custom application. - Give it a name and an icon
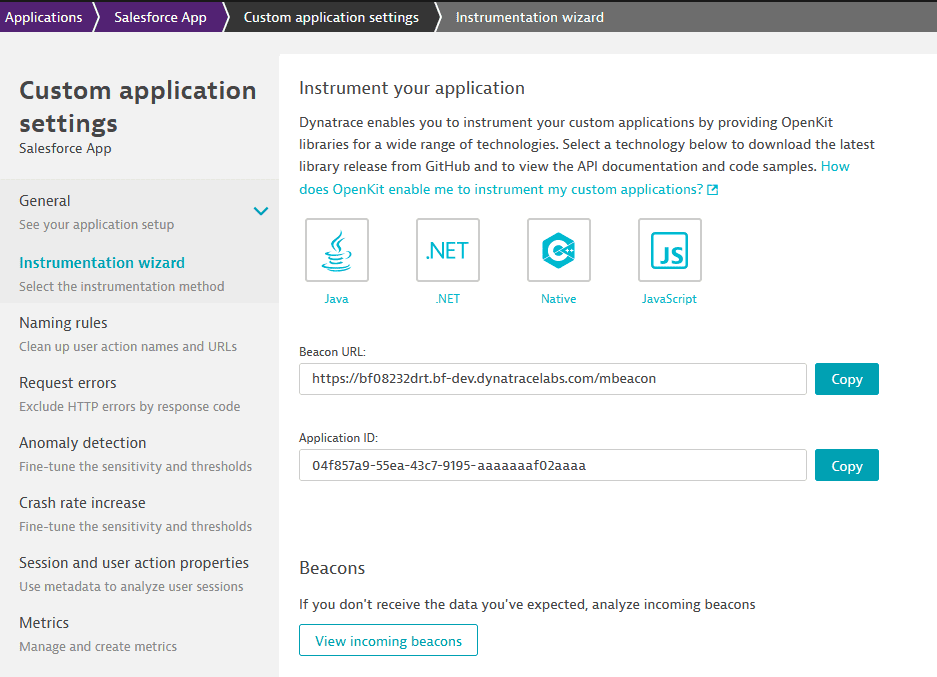
- Under the application settings, navigate to
Instrumentation Wizardand save the Application ID for later
Activate the extension:
- Navigate to the Dynatrace Hub and activate the extension.
- Create a monitoring configuration on the extension page.
- Select an Activegate group.
- One of these servers will need to access the salesforce API, which is on the internet.
- The login URLs are:
https://login.salesforce.comorhttps://test.salesforce.com - The Pub Sub endpoints are:
api.pubsub.salesforce.com:7443orapi.deu.pubsub.salesforce.com:7443 - A proxy can be configured later if necessary.
The parameters for the monitoring configuration are:
| Parameter | Description |
|---|---|
| Endpoint name | A friendly name to identify the endpoint |
| Login URL | Chose from Production or Sandbox |
| Pub/Sub URL | Chose from Global Endpoint or Europe (Frankfurt) Endpoint |
| Reporting Mode | OpenKit or Business Events |
| Custom Application ID | The Dynatrace Custom Application ID for the app you created before |
| Authentication type | Choose from Username and Password or Connected App, see specific documentation below |
| Events filtering | Choose which real time events you'd like to send to Dynatrace, by default all are enabled |
| Usernames Blocklist | Optional list of Usernames to ignore, use this to block automation/api users from reporting |
| Proxy | Optional proxy, in case the Activegate cannot connect to the Salesforce URLs |
The data is sent to the Frontend Application that you created:
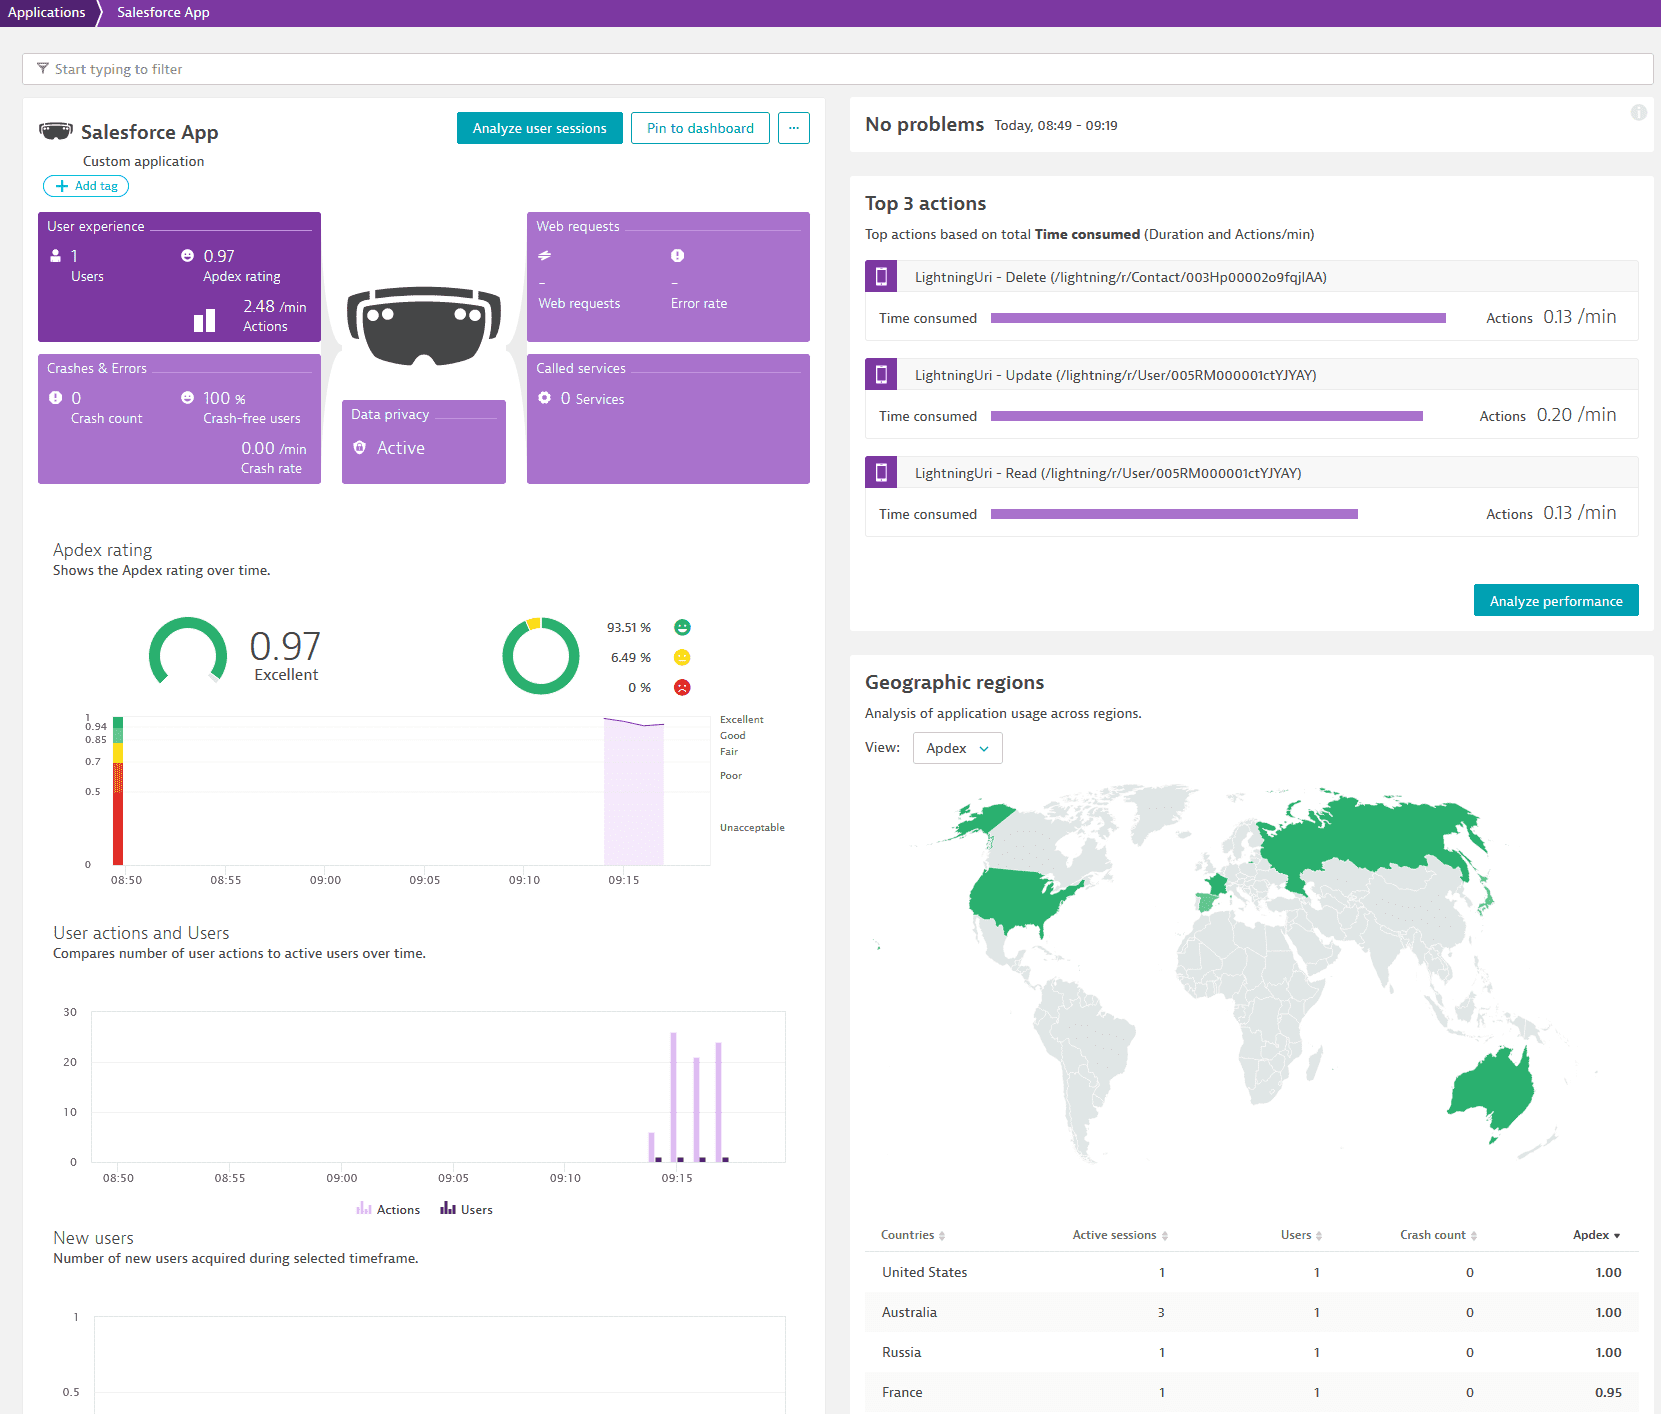
You can drill down to the Sessions:
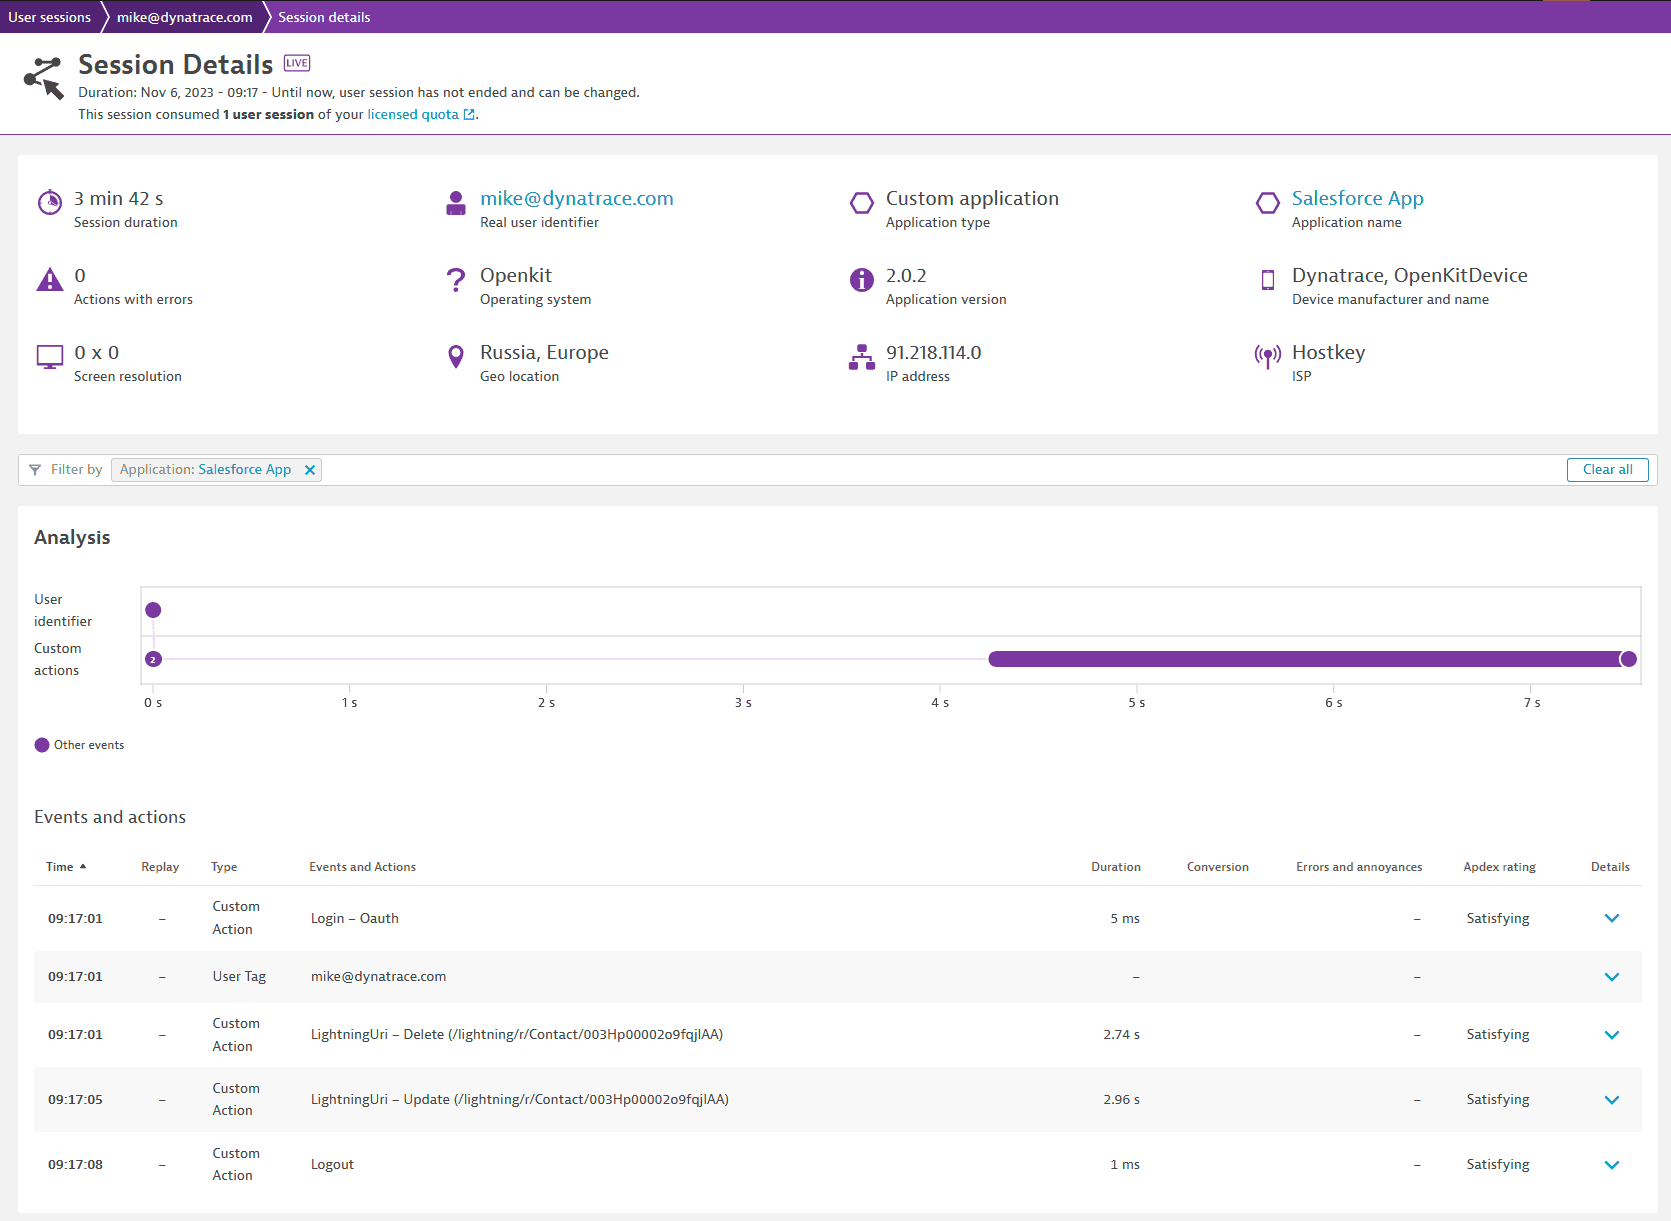
And to the individual properties, by clicking on the User Action > Perform waterfall analysis:
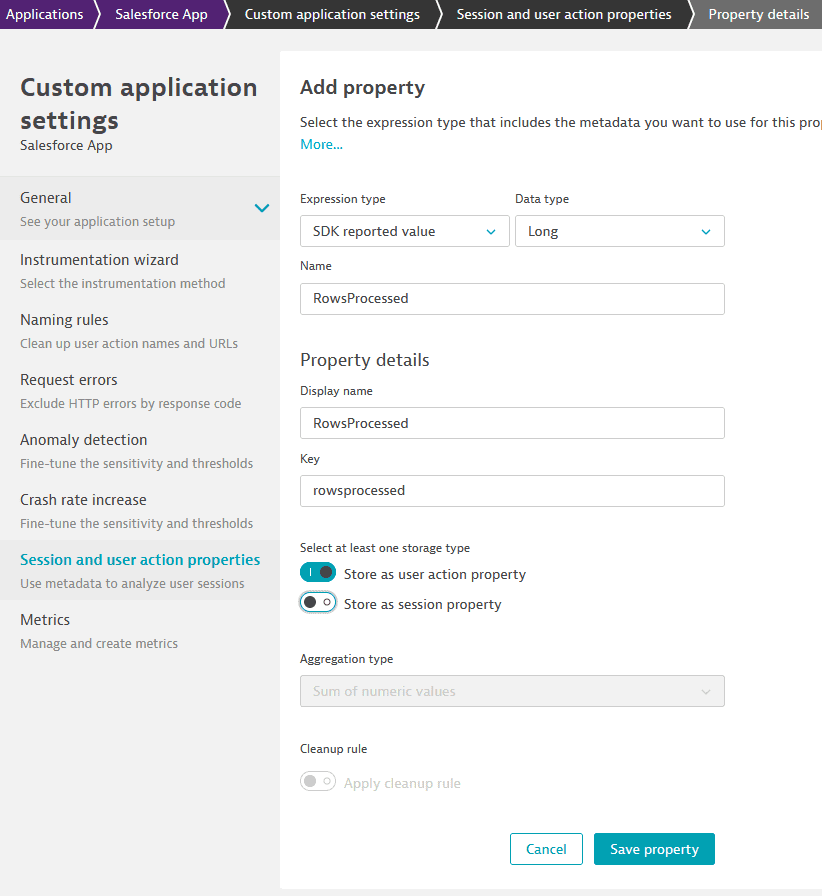
 To use these properties in User Sessions Query Language:
- Under the application settings, navigate to
Session and user action properties - Create a property. Note: the Name must match exactly the property name as documented in the Salesforce events.
Example: capturing the number of rows for a report:
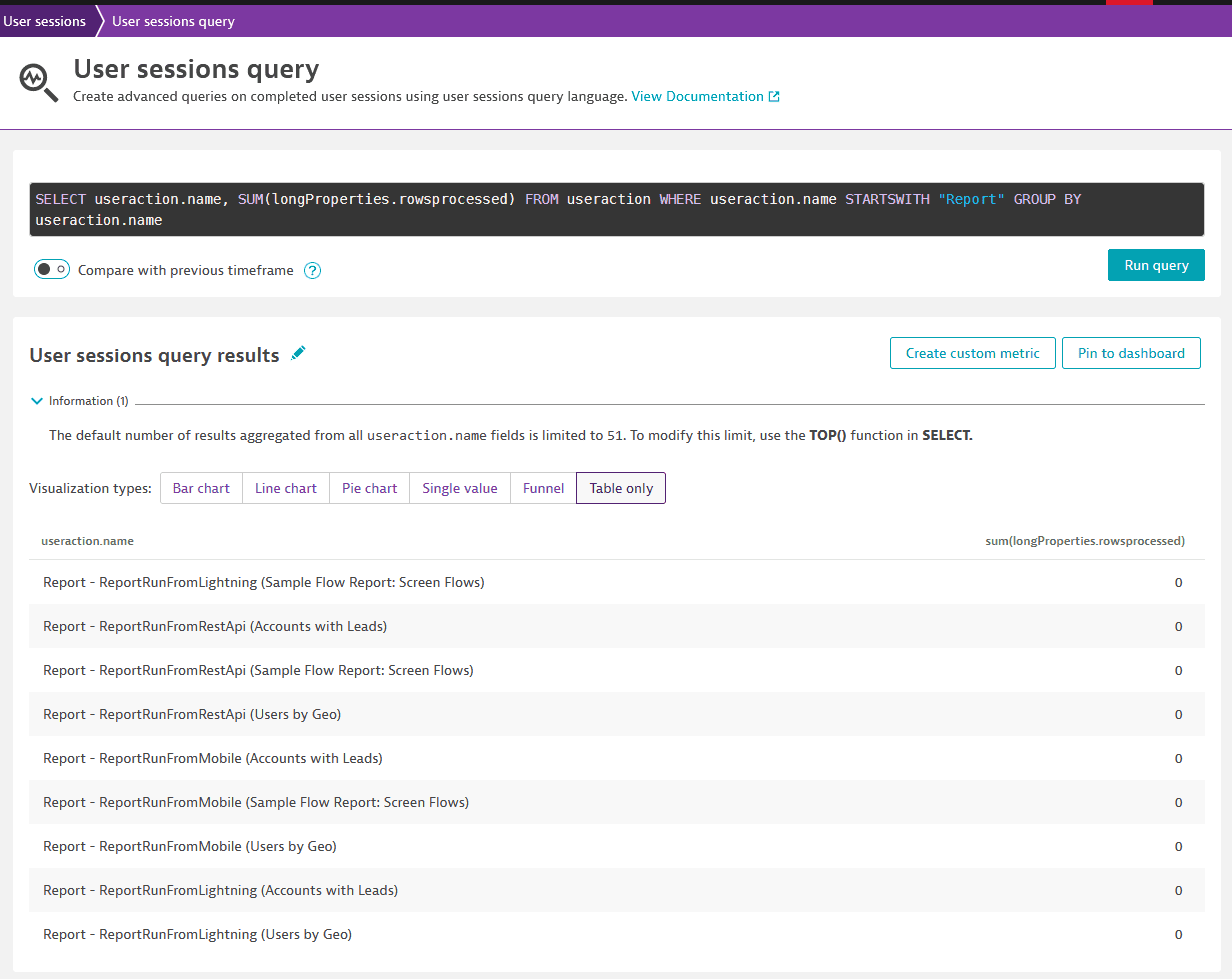
Querying the property:
SELECT useraction.name, SUM(longProperties.rowsprocessed) FROM useraction WHERE useraction.name STARTSWITH "Report" GROUP BY useraction.name
Business Events
For business events, all data is ingested using the business events API.
It can be queried using DQL:
fetch bizevents
| filter event.type == "salesforce.ApiEventStream"
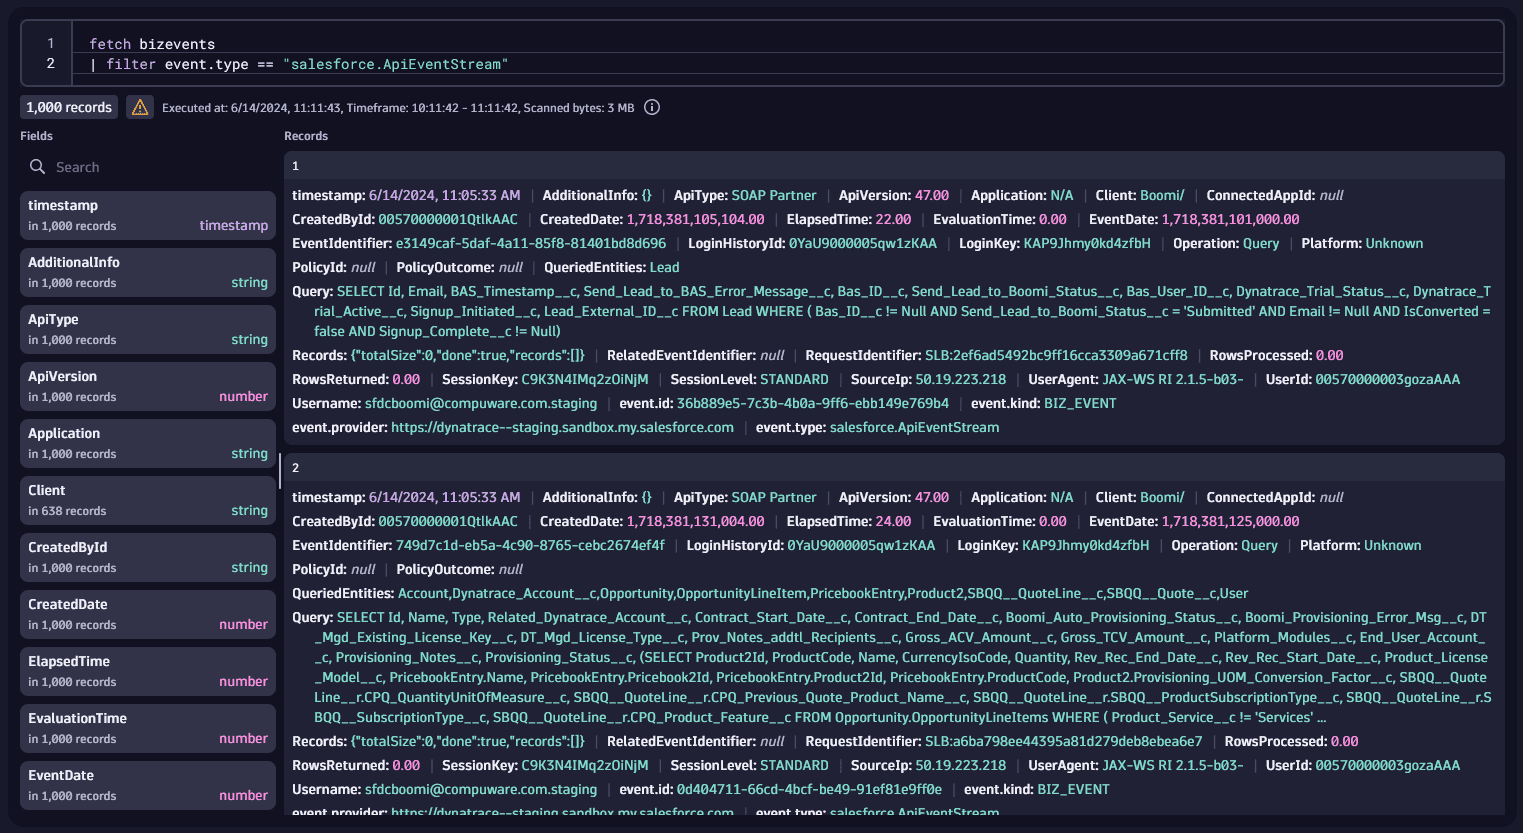
Each of the events of type salesforce.NameOfTheEvent will have all properties documented by Salesforce.
For instance, these are the properties for an ApiEventStream
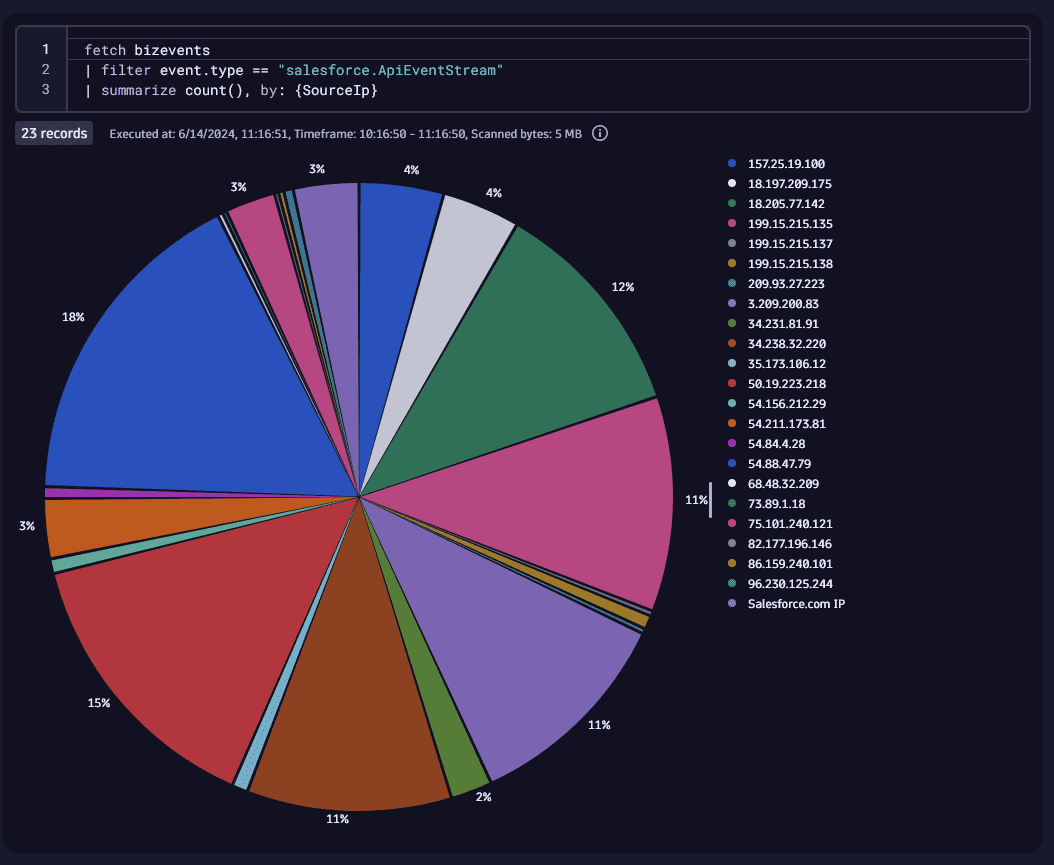
So we can create visualizations using all of these properties.
fetch bizevents
| filter event.type == "salesforce.ApiEventStream"
| summarize count(), by: {SourceIp}
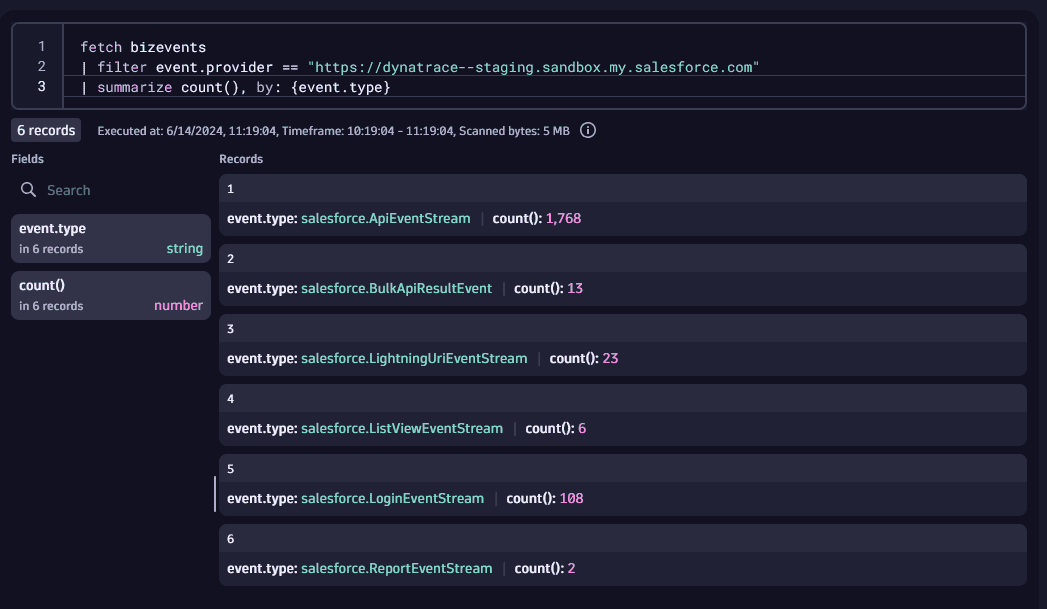
You can get a list of all event types with DQL:
fetch bizevents
| filter event.provider == "https://dynatrace--staging.sandbox.my.salesforce.com"
| summarize count(), by: {event.type}
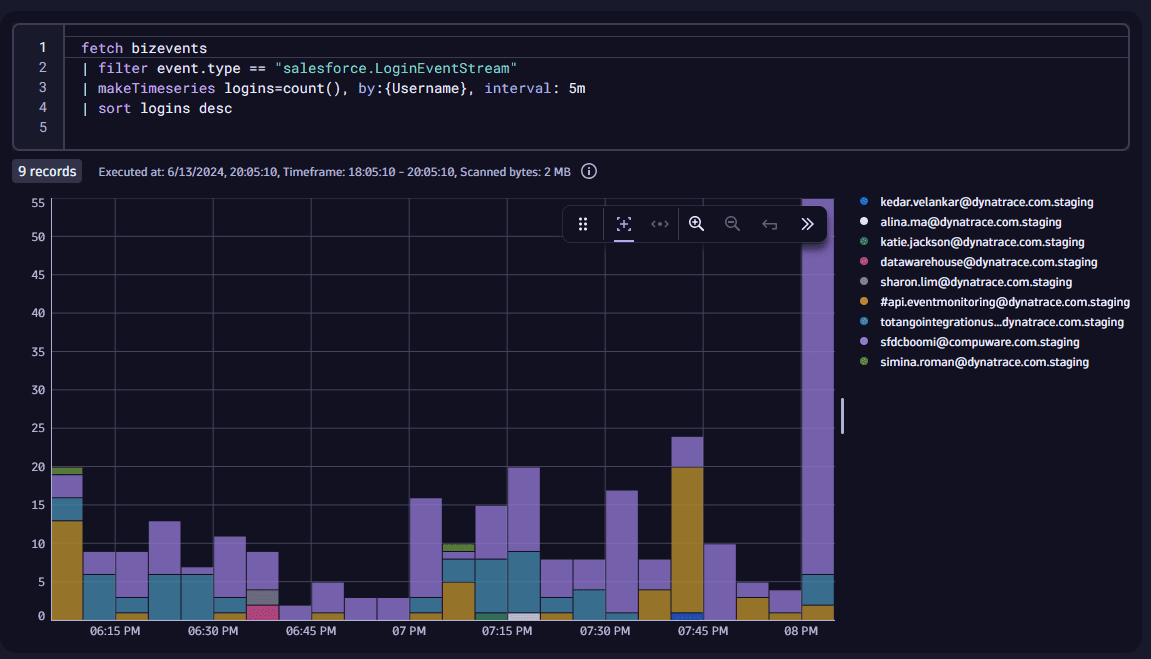
Example: Get Logins by User overtime
fetch bizevents
| filter event.type == "salesforce.LoginEventStream"
| makeTimeseries logins=count(), by:{Username}, interval: 5m
| sort logins desc
Event LogFile
Overview
The Event Log File configuration allows you to ingest log files from Salesforce into Dynatrace.
Requirements
- Event Log File needs to be enabled in Salesforce
- The user must have permissions to read event log files
Details
Create a new Event Log File configuration by clicking Configure Event Log File.
Note that under Events to capture all the different Log Files will be disabled by default.
Select which log files you would like to ingest.
Notes
Event Log data is delayed by several hours in Salesforce. Do not expect real time data out of this configuration, according to Salesforce:
For hourly log files, depending on event delivery and final processing time, expect an event to take place 3–6 hours from the time of the event to be available in the log file. However, it can take longer.
Visualization
The events are sent as Log Events to Dynatrace, and can be queries using DQL:
fetch logs
| filter query.type == "EventLogFile"
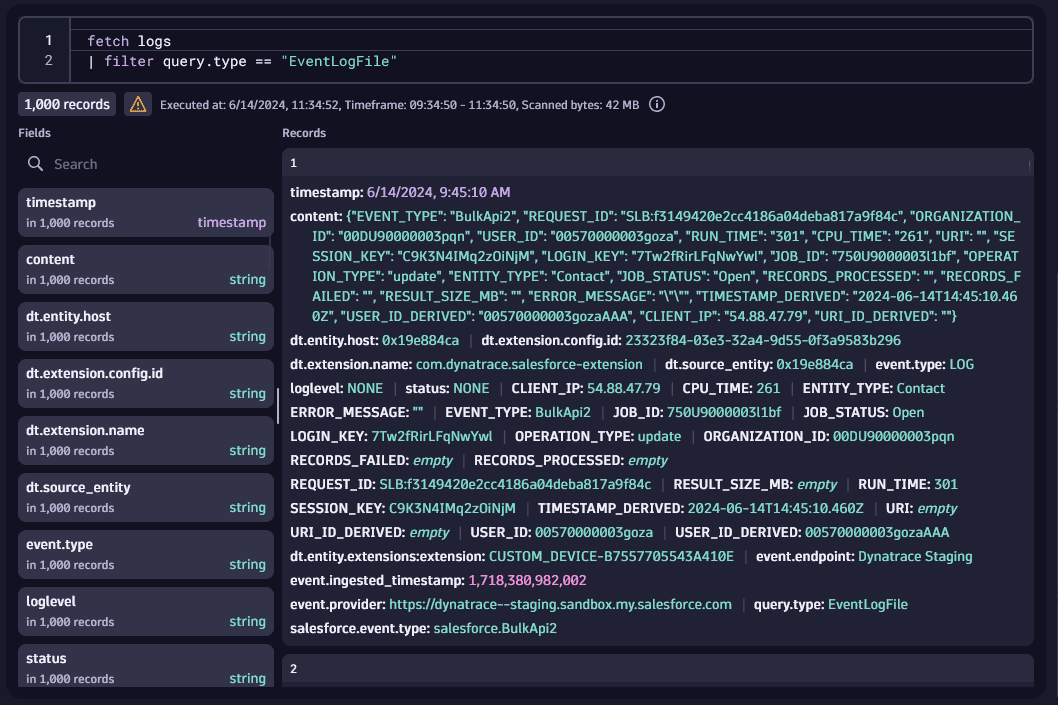
Every property for a certain Event Log File will be available.
You can find details for the fields here
Example:
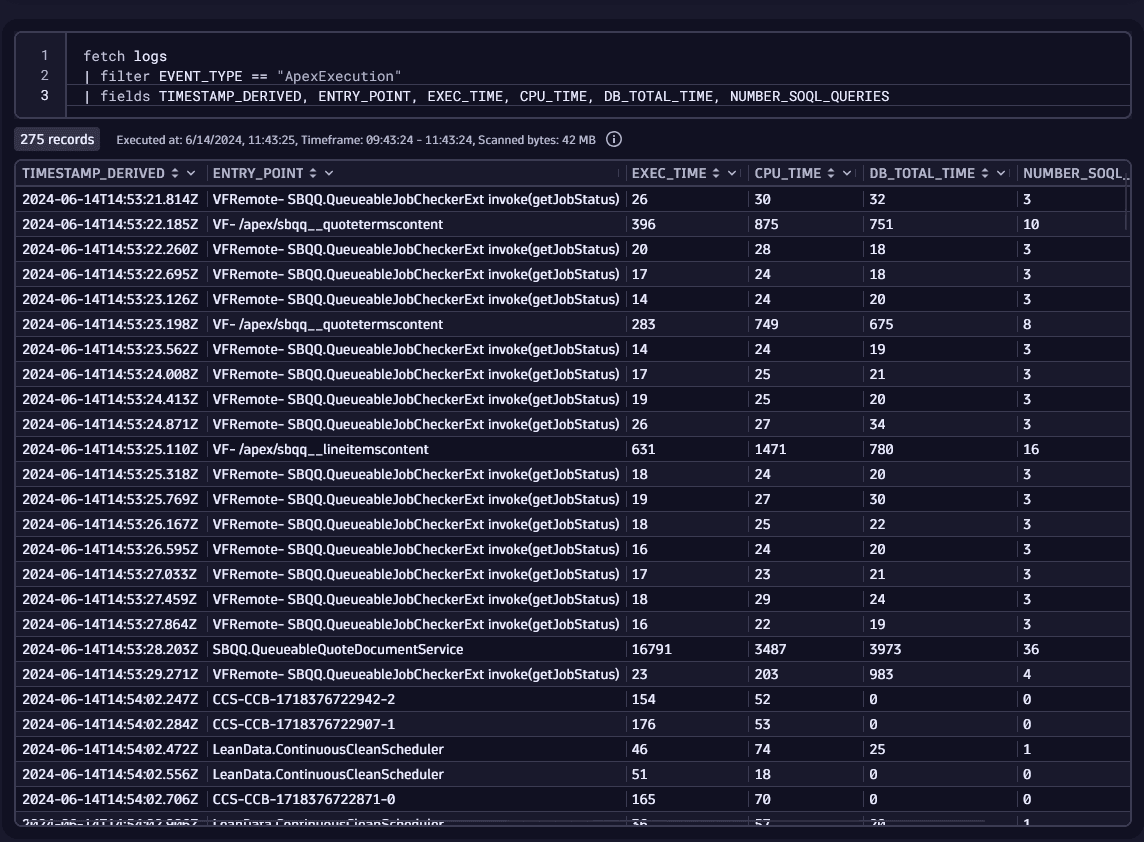
Get details about ApexExecution events:
fetch logs
| filter EVENT_TYPE == "ApexExecution"
| fields TIMESTAMP_DERIVED, ENTRY_POINT, EXEC_TIME, CPU_TIME, DB_TOTAL_TIME, NUMBER_SOQL_QUERIES
API Queries (SOQL)
Overview
The API Queries configuration allows you to ingest Salesforce Object Query Language (SOQL) data into Dynatrace.
Requirements
The user must have permissions to query the Salesforce API, and read the sObjects that are being queried.
Details
To ingest Salesforce Object Query Language (SOQL) data into Dynatrace, click Configure API queries
Add up to 100 SOQL queries to be executed at the specified interval.
Each query has the parameters:
- Query Name: A friendly name for the query, this helps you locate this query data later in Dynatrace Logs.
- Query: The SOQL query to be executed.
- The query must contain at least one datetime field.
- The placeholder
{last_execution_timestamp}must be used to filter the query results and deduplicate the data. - Example:
SELECT Id, CreatedDate, Field, NewValue, OldValue FROM OpportunityFieldHistory WHERE CreatedDate > {last_execution_timestamp}
- Frequency
- The frequency can be of type Interval or Cron.
- Interval: The query will be every X minutes.
- Cron: The query will be executed based on the cron expression provided, you can use crontab guru to generate the cron expression.
Visualization
The data is sent back to Dynatrace as log events.
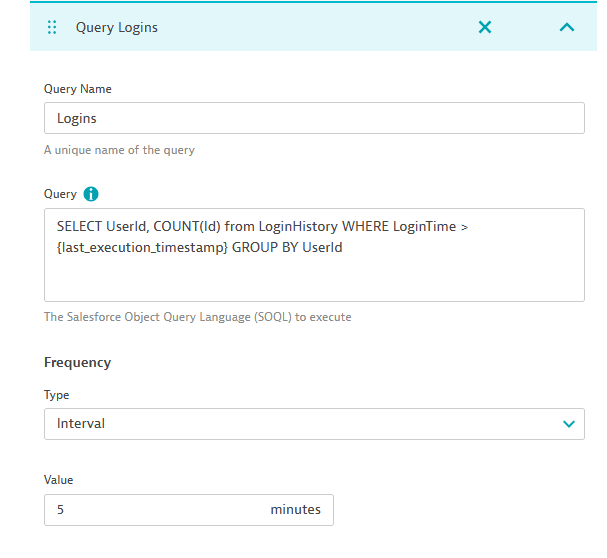
Let's consider this query configuration:
Name: Logins
Query: SELECT UserId, COUNT(Id) from LoginHistory WHERE LoginTime > {last_execution_timestamp} GROUP BY UserId
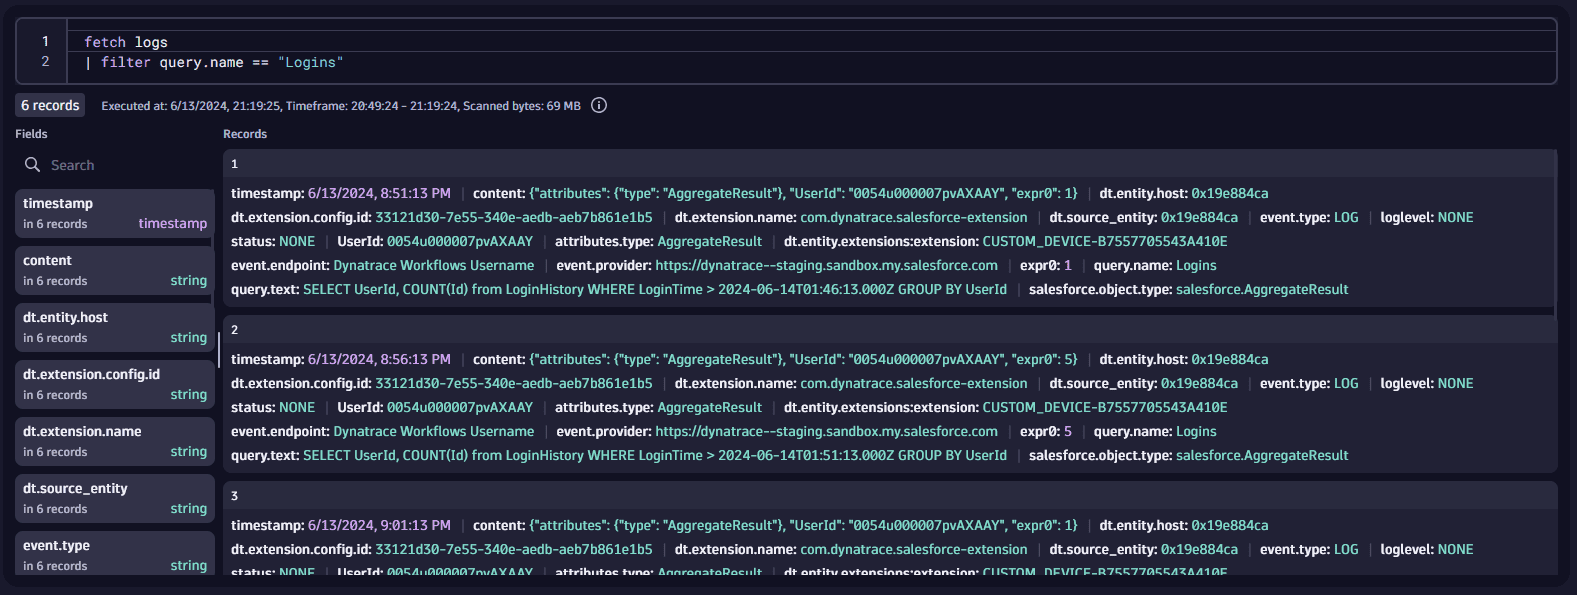
The results can be obtained with the DQL:
fetch logs
| filter query.name == "Logins"
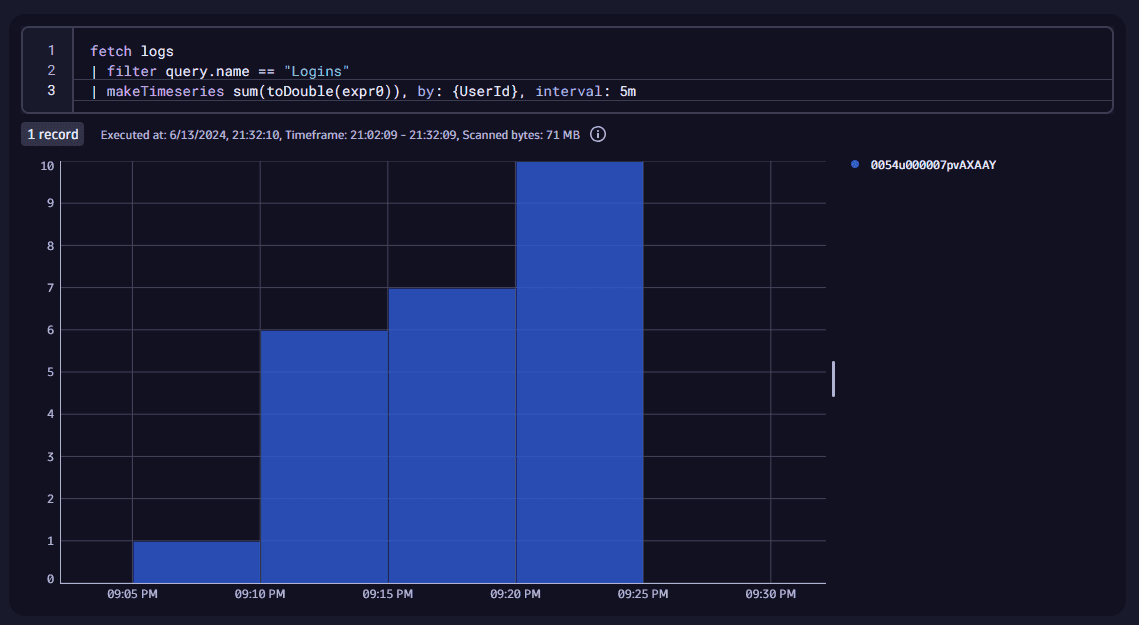
And a chart could be created with:
fetch logs
| filter query.name == "Logins"
| makeTimeseries sum(toDouble(expr0)), by: {UserId}, interval: 5m
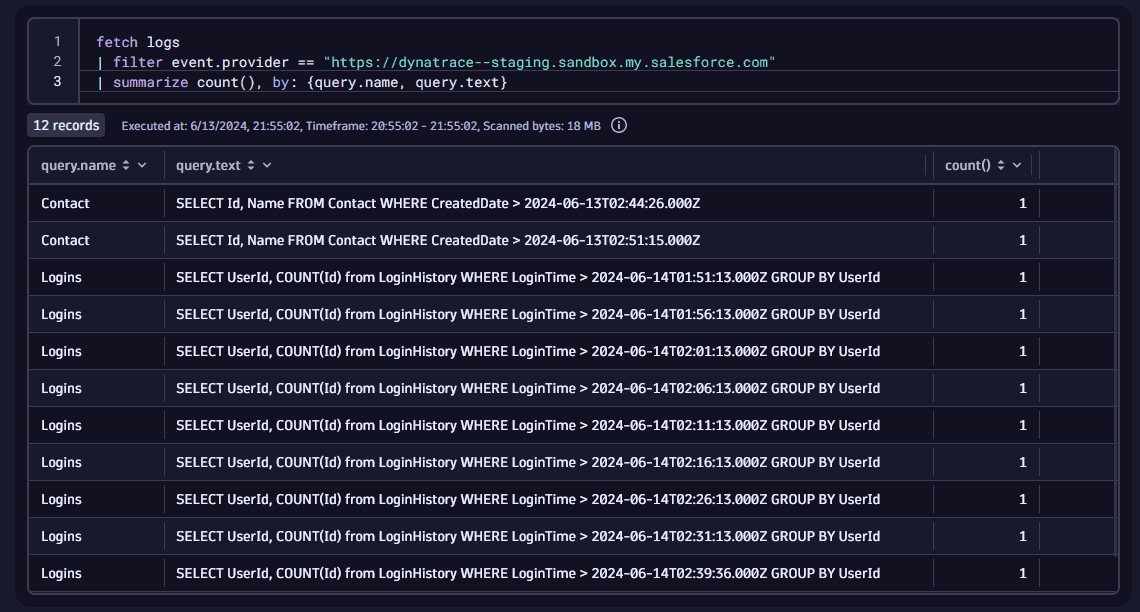
You can also fetch all the queries and their text configured for this Salesforce instance:
fetch logs
| filter event.provider == "https://dynatrace--staging.sandbox.my.salesforce.com"
| summarize count(), by: {query.name}
User and Password authentication
- A user with the permissions for the desired configuration
- The password for the user
- The security token for the user
Connected App authentication
In this mode the extension connects as a Connected App, this is the recommended method of authentication and no user password is required.
Technically, the app implements the OAuth 2.0 JWT Bearer Flow
Dynatrace will ask for:
- The Consumer Key of the Connected App
- The Private Key of the Connected App
- The Subject of the JWT token, this is the username of a user that is part of a Profile in the Connected App
Requirements
openssl(for generating the certificate, not needed if you already have a certificate and private key)
Note, on Windows if you have git installed you should also have a copy of openssl.
It would be under a directory like C:\Program Files\Git\mingw64\bin depending on your installation.
You can read more about the OAuth 2.0 JWT Bearer Flow here
Certificate
The connected app must have a certificate.
We later authenticate with Salesforce using this certificate's private key
This command generates a certificate and a private key:
openssl req -newkey rsa:2048 -nodes -keyout key.pem -x509 -days 365 -out cert.pem
The cert.pem file will be later added to the Connected App.
The key.pem file will be used by Dynatrace to authenticate with Salesforce.
Create the Connected App
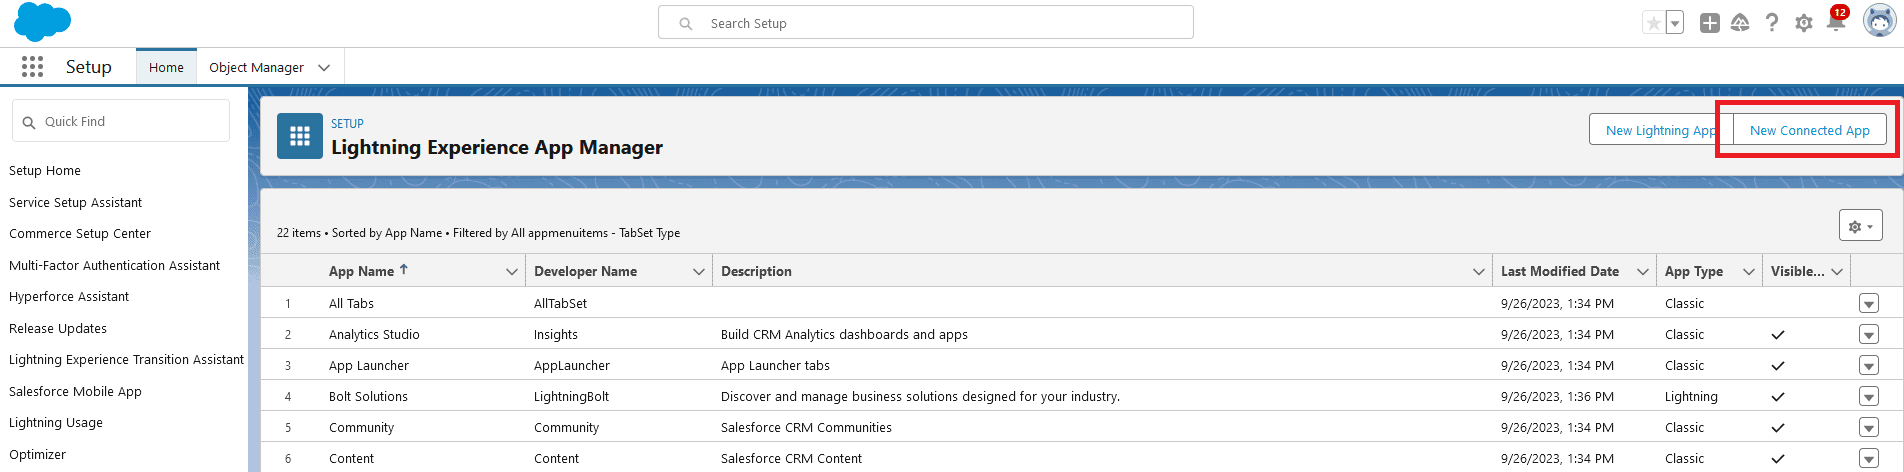
In Salesforce Lightning:
- Go to Setup > Apps > App Manager
- Select New Connected App
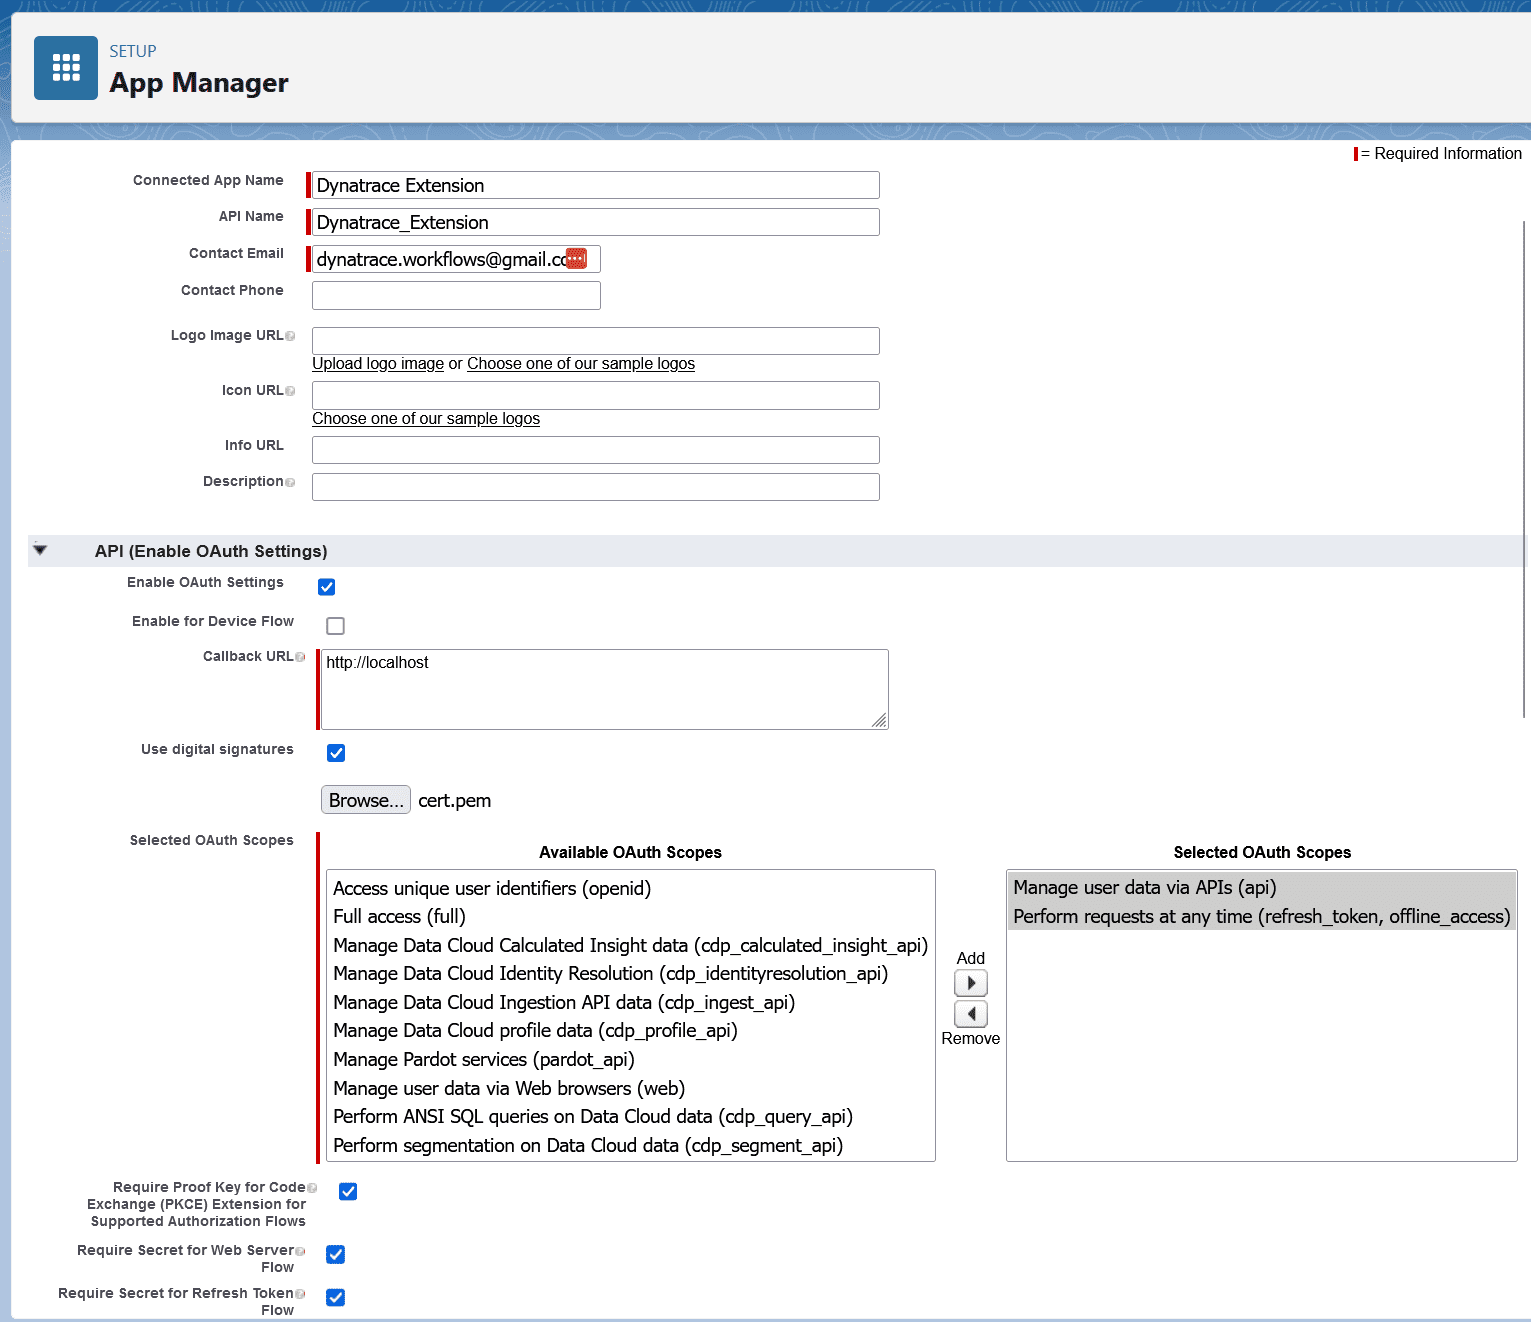
Give the app a name and add the contact email. Under API (Enable OAuth Settings):
- Check Enable OAuth Settings
- The Callback URL is not used, you can input
http://localhost - Check Use digital signatures
Upload the cert.pem file generated above under Use digital signatures.
Under Selected OAuth Scopes, Add these scopes:
- Manage use data via APIs (api)
- Perform requests at any time (refresh_token, offline_access)
Leave all other settings as default and click Save.
The Connected App screen should look like this (with your name, email and certificate):
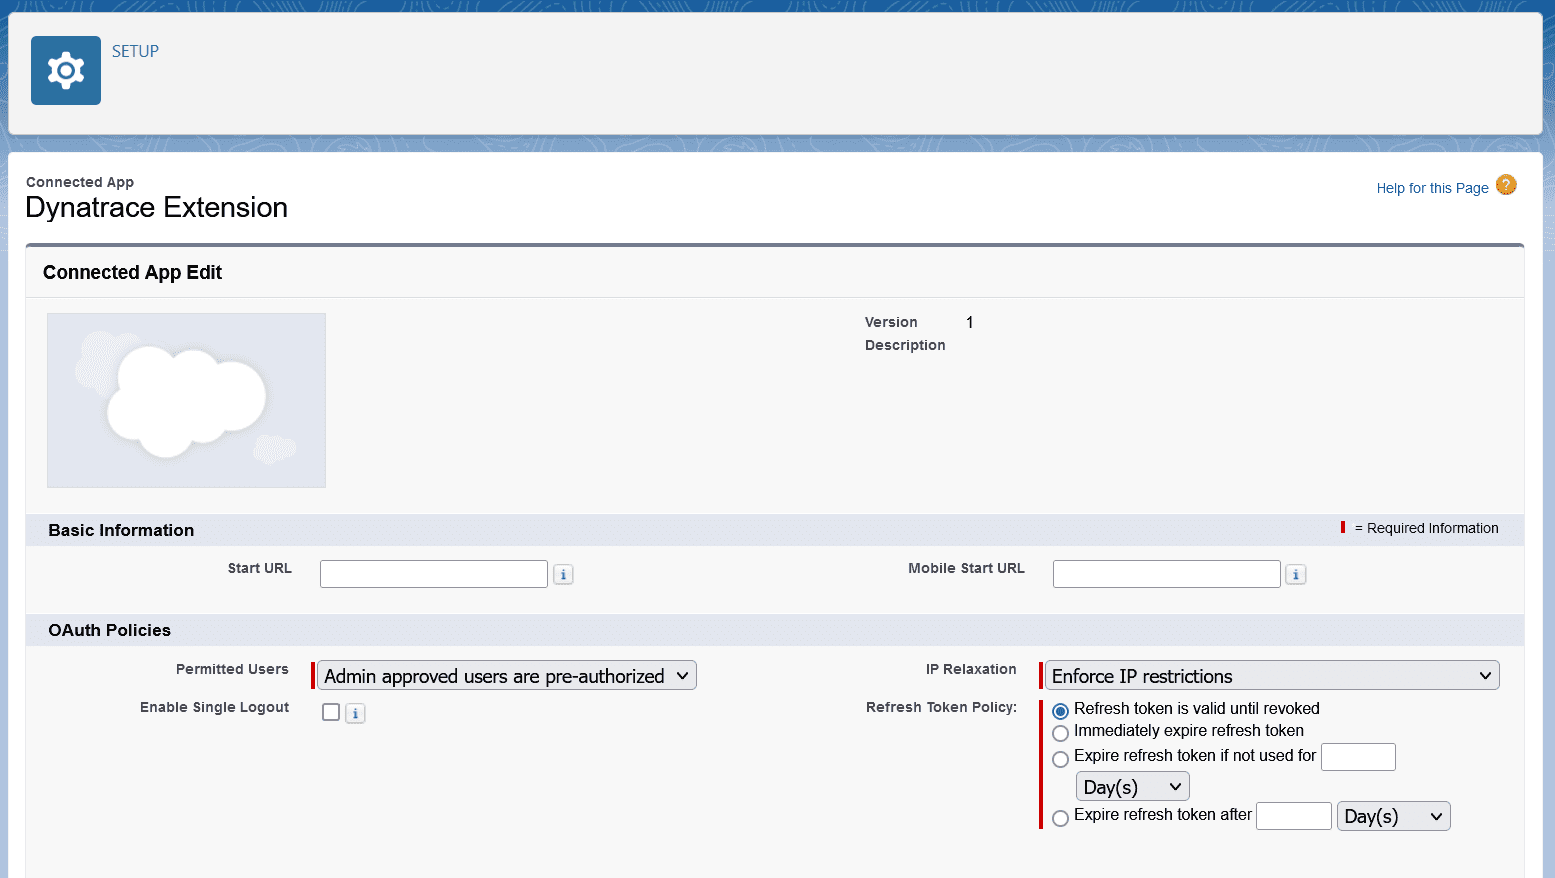
OAuth policy
Now set up the OAuth Policy permitted users.
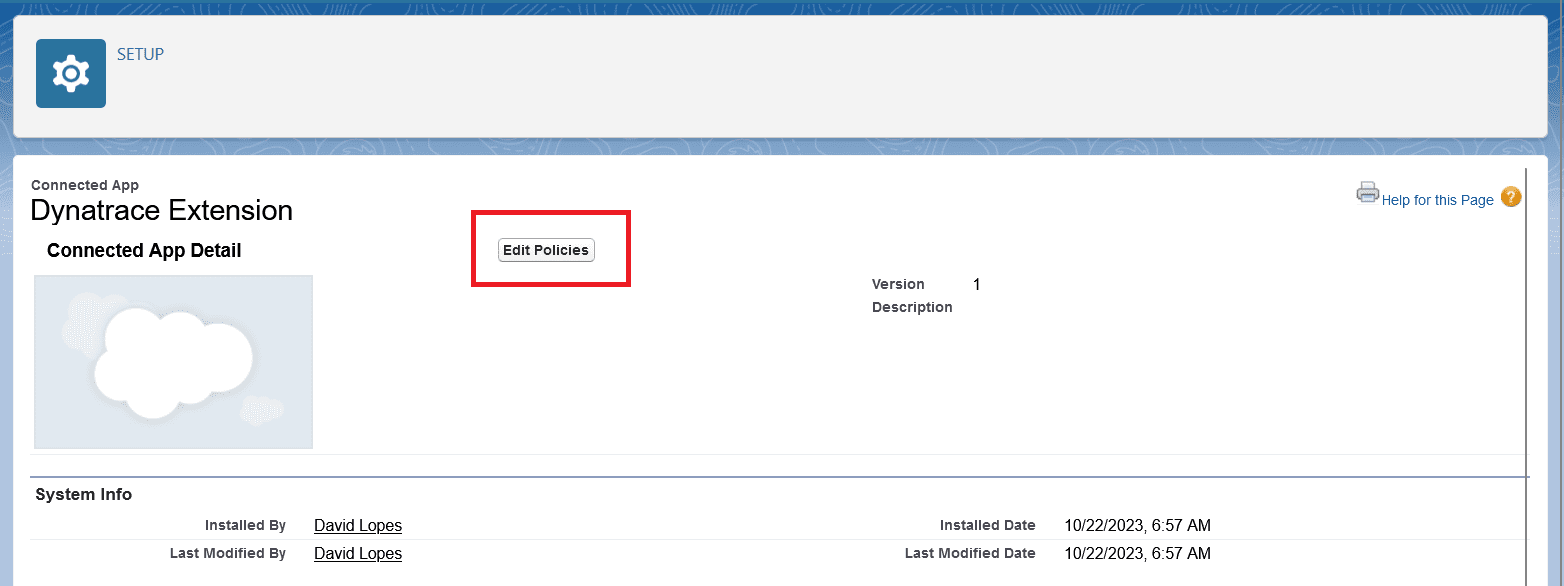
On the connected app page, select Manage, then Edit Policies.
Under OAuth Policies select Admin approved users are pre-authorized.
Click Save.
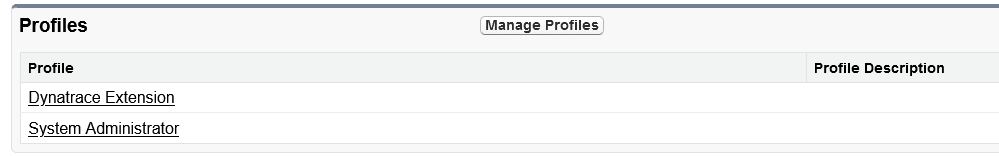
Approved users
Identify users that can use the app.
This is done by adding Profiles to the Application Profile Assignment list.
One the connected app page, under Profiles, click Manage Profiles.
Add profiles that can use the connected app.
Note: Later, any username from these profiles can be used as the Subject when configuring the extension.
Note that the profile needs the permissions for event streaming:
General User Permissions
View Real-Time Event Monitoring Data
Administrative Permissions
Customize ApplicationView All Data
Please check the needed permissions documentation here
Client ID authentication
For Client ID authentication, create an API Only user in Salesforce, and provide the Client ID and Client Secret.
Troubleshooting
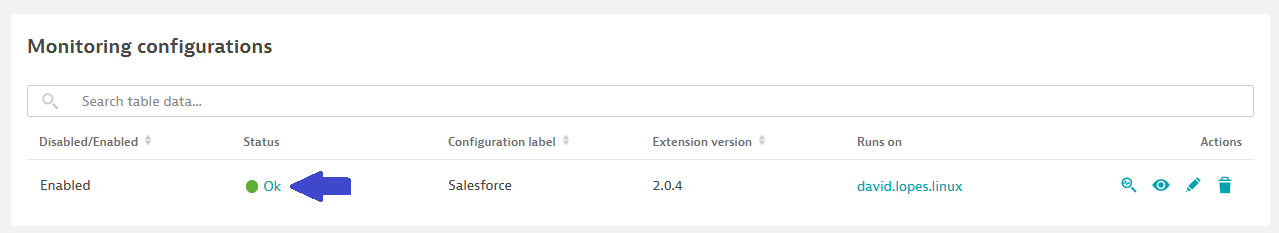
Logs
Error logs can be obtained via Dynatrace, by navigating to the Extension page, and clicking on the Status for each Monitoring Configuration.
Detailed logs can be obtained by creating an Activegate Diagnosis
Related to Salesforce Extension

Full version history
Full version history
Version 2.3.3
- Increase the limit of characters for the SOQL query to 5000
Full version history
Version 2.3.2
- Fix an issue where an import was missing when using a proxy
Full version history
Version 2.3.1
- Add support for EventLogFile ingestion
- Add support for Salesforce Object Query Language queries
Users can now ingest EventLogFile data and run SOQL queries against Salesforce, please check the hub for documentation on how to use these features.
Full version history
Version 2.2.6
- Fix an issue where private keys in the format
BEGIN RSA PRIVATE KEYwere not parsed correctly
Full version history
Version 2.2.5
- Fix an issue with logging the proxy URL
Full version history
Version 2.2.4
- Fix an issue where fields were being reported in lower case characters when capture pii was enabled
- Fix an issue where fields were being reported with an empty value instead of being removed when capture pii was enabled
Full version history
Version 2.2.3
- Capture PII is False by default
Full version history
Version 2.2.2
- Add the option to define the fields that should be considered PII
Full version history
Version 2.2.1
- Correctly set the extension log level as configured in the UI
Full version history
Version 2.2.0
- Users can now choose to not capture PII data
- Adds an option to report the events as Business Events instead of Openkit
Full version history
- Use latest version of OpenKit framework
Full version history
Version 2.1.1
- Add the option to use port 443 instead of 7443 for the pub sub API
- Fix an issue where sometimes beacons were too large for the VDA mode
Full version history
Version 2.0.15
- More aggressively clear the cache to reduce memory footprint
Full version history
Version 2.0.14
Fixes an issue where in some installations the install directory could not be determined
Full version history
Version 2.0.13
- Fix an issue with initialization
Full version history
Version 2.0.11
- Fix an issue where the Tenant ID could not be found if Dynatrace was installed in a non-default path
Full version history
Version 2.0.10
- Add option to manually input instance URL
- Fix an issue where proxies were not using during fastcheck
- Retry the connection on different pub sub errors
Full version history
Version 2.0.7
- Build with glibc 2.17 for compatibility with linux AGs running older glibc
Full version history
Version 2.0.6
- Reduce the http client timeout from 60 to 30 seconds, to better display error messages during the fastcheck
Full version history
Version 2.0.5
- Fix an issue where sometimes the thread ID for the OpenKit beacon was higher than what is allowed, causing data to not be reported.
Full version history
No release notes