0 Results
Found in 'Infrastructure Observability'
We couldn't find any results in Infrastructure Observability
You can search all listings, or try a different spelling or keyword. Still nothing? Dynatrace makes it easy to create custom apps.

Extend the platform,
empower your team.


 Salesforce Extension
The Salesforce extension can capture three types of Salesforce data:
The Event Streaming configuration allows you to monitor the usage of your Salesforce CRM account.
Enable use cases like:
The extension uses the Salesforce Pub/Sub API to listen for Event Streaming Events.
These events are captured and sent as User Actions with all their respective properties sent as Action Properties. The event properties can be seen by
clicking on an User Action > Perform waterfall analysis
A detailed description of every event and their properties can be found on the Salesforce documentation.
The current events being captured are:
The extension is limited to events that Salesforce produces as Real Time Events.
Setup -> Event Manager enable Streaming Data for the events you want to capture.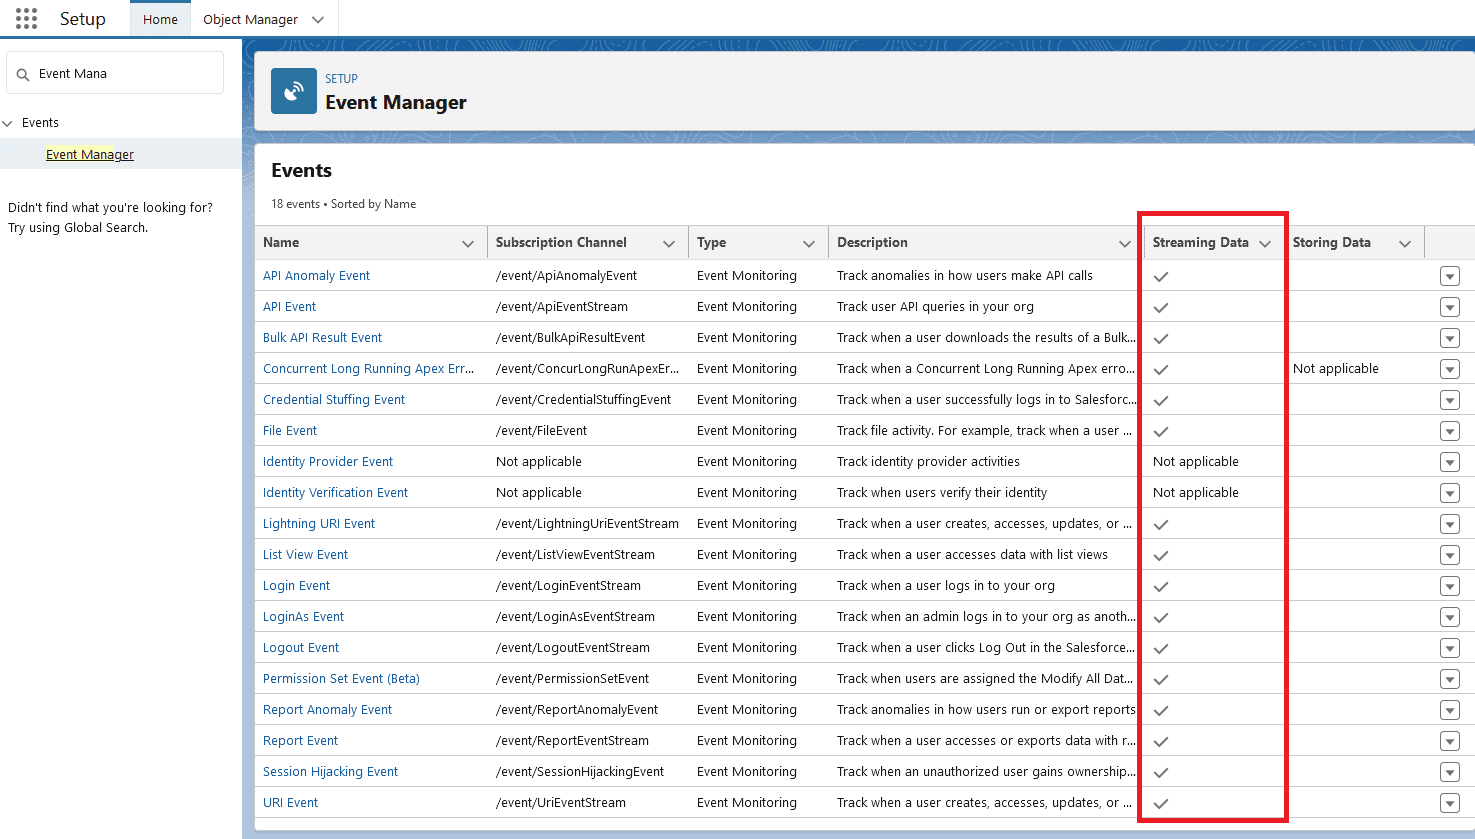
Create a Custom Application to receive the data:
Digital Experiences -> Custom Applications -> Create custom application.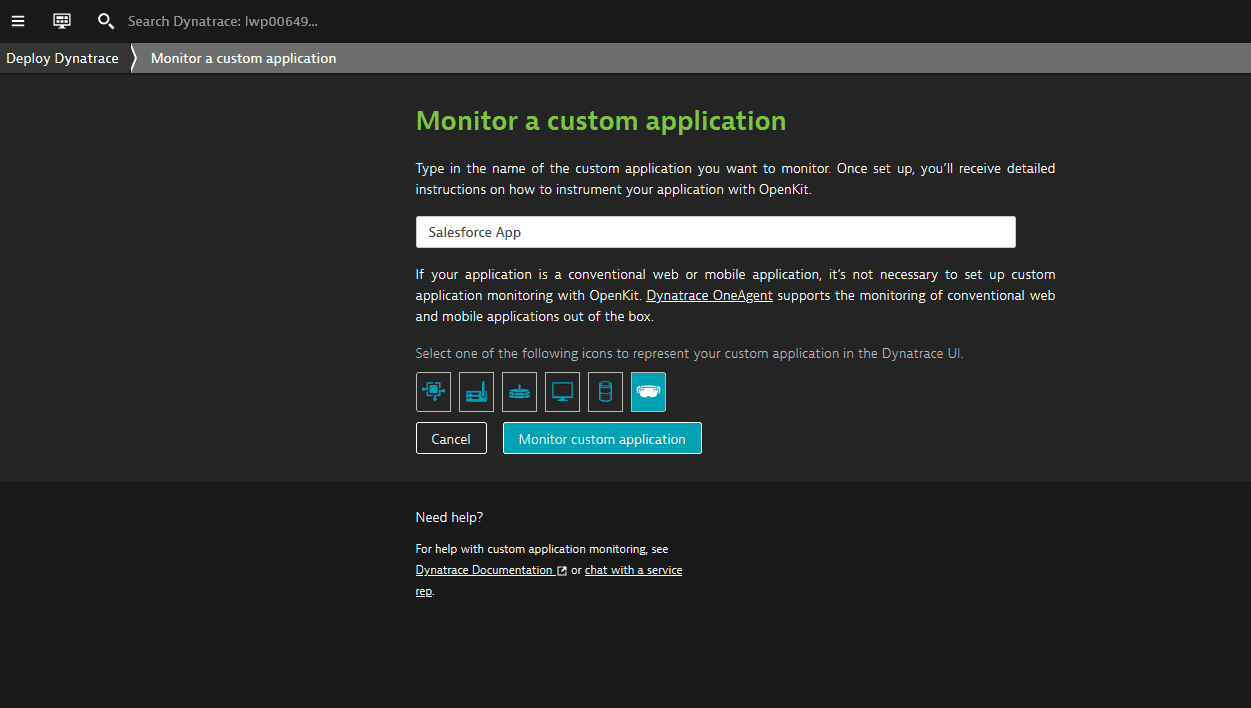
Instrumentation Wizard and save the Application ID for later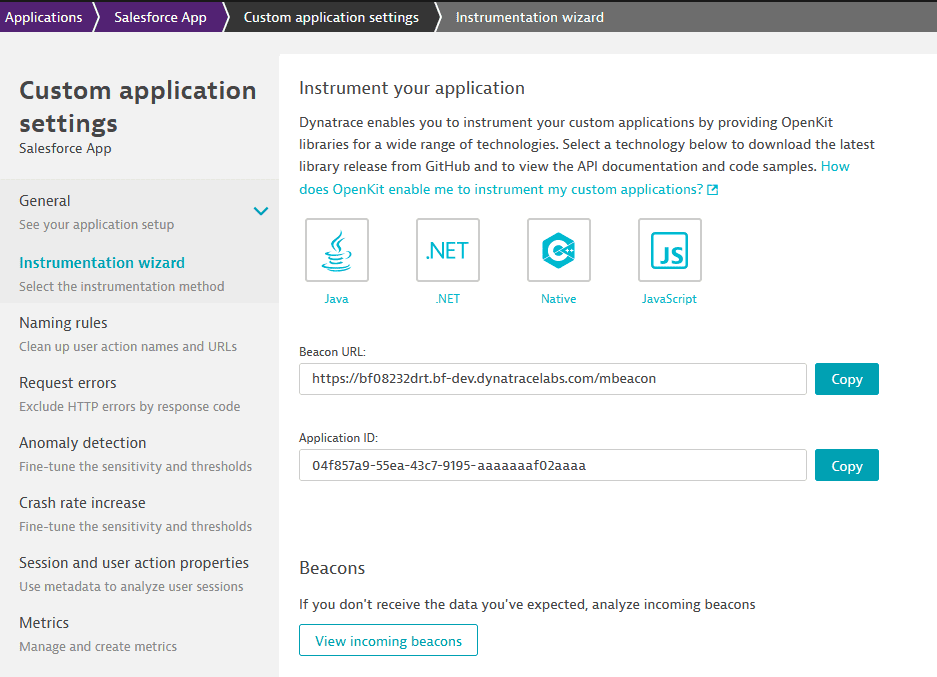
Activate the extension:
https://login.salesforce.com or https://test.salesforce.comapi.pubsub.salesforce.com:7443 or api.deu.pubsub.salesforce.com:7443The parameters for the monitoring configuration are:
| Parameter | Description |
|---|---|
| Endpoint name | A friendly name to identify the endpoint |
| Login URL | Chose from Production or Sandbox |
| Pub/Sub URL | Chose from Global Endpoint or Europe (Frankfurt) Endpoint |
| Reporting Mode | OpenKit or Business Events |
| Custom Application ID | The Dynatrace Custom Application ID for the app you created before |
| Authentication type | Choose from Username and Password or Connected App, see specific documentation below |
| Events filtering | Choose which real time events you'd like to send to Dynatrace, by default all are enabled |
| Usernames Blocklist | Optional list of Usernames to ignore, use this to block automation/api users from reporting |
| Proxy | Optional proxy, in case the Activegate cannot connect to the Salesforce URLs |
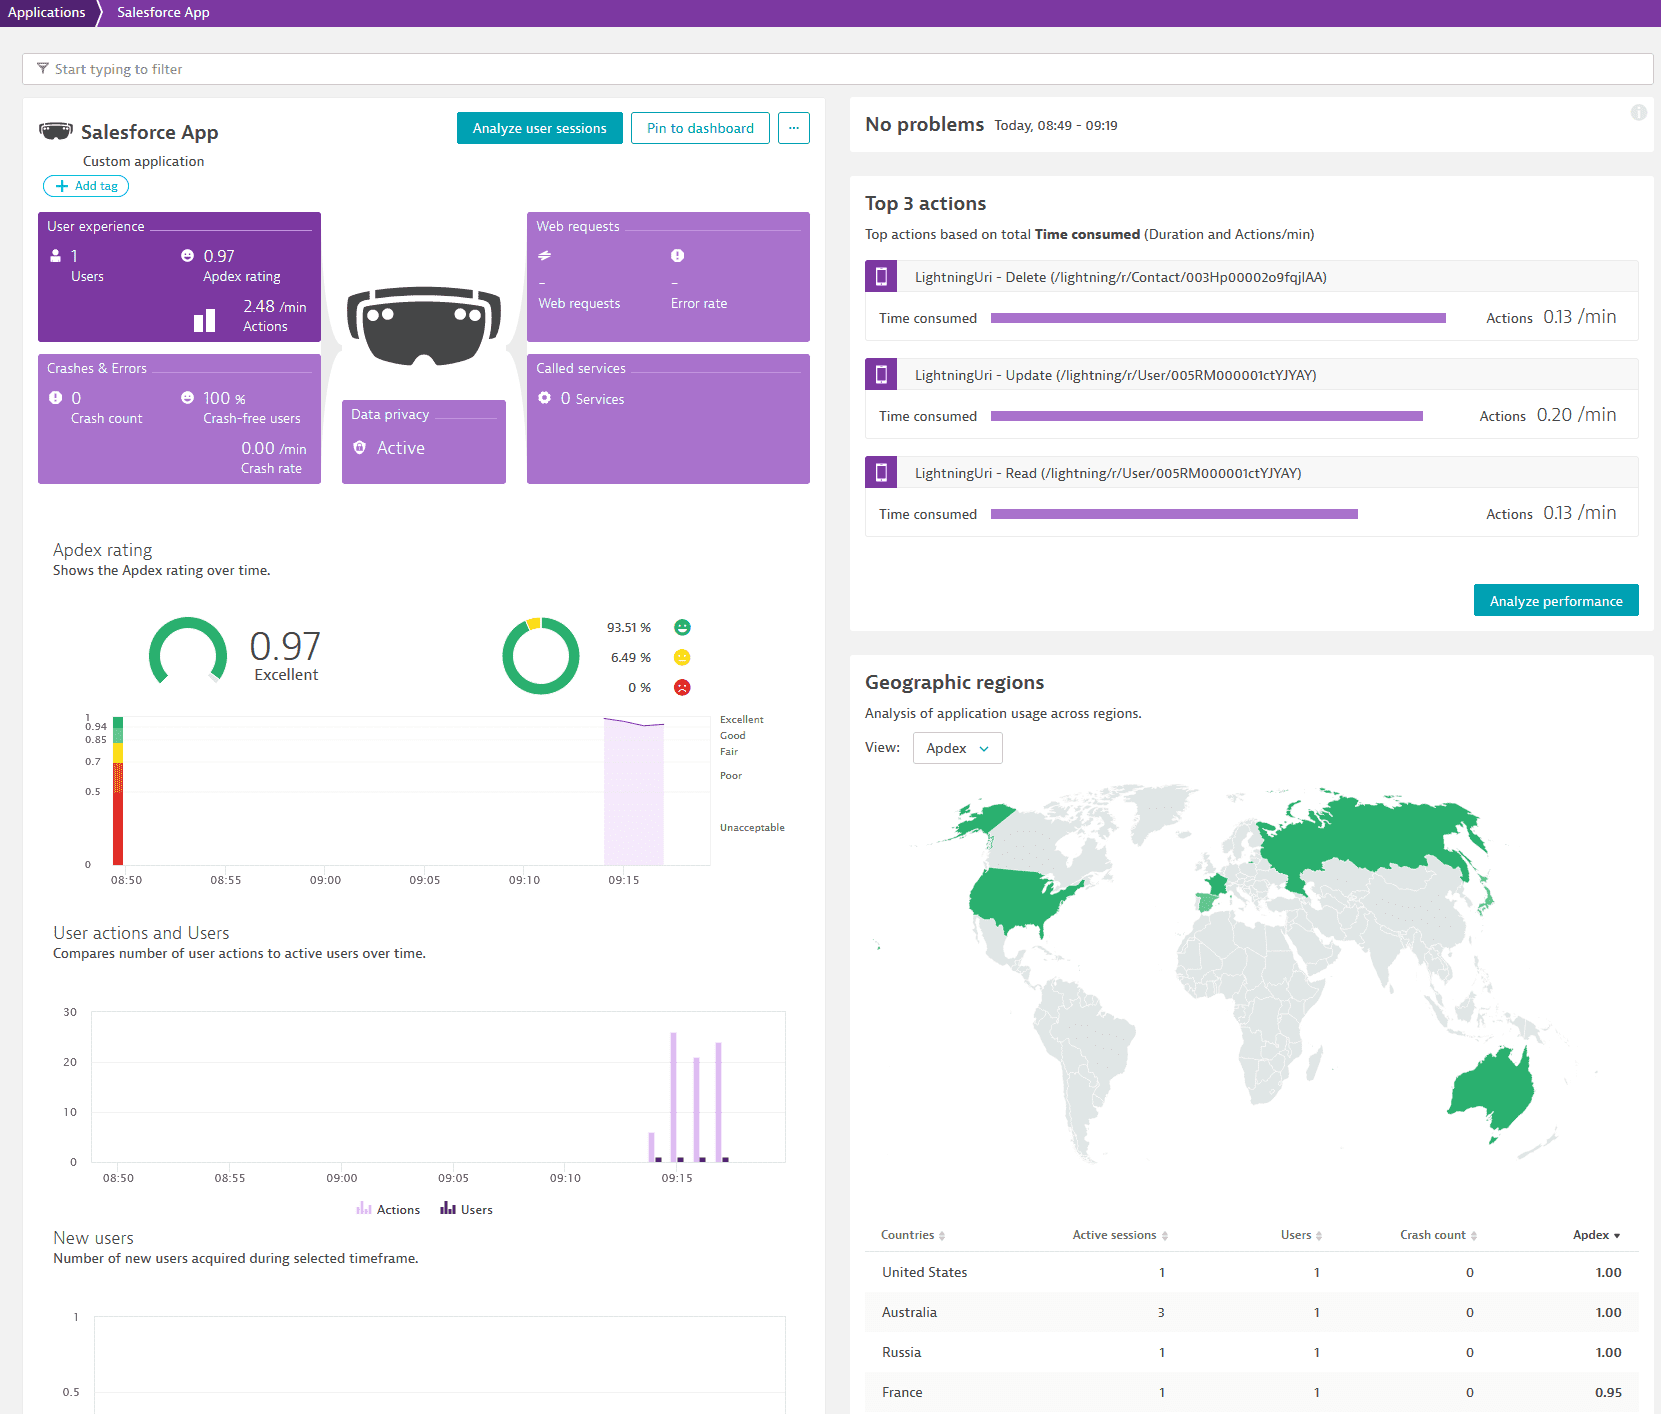
The data is sent to the Frontend Application that you created:
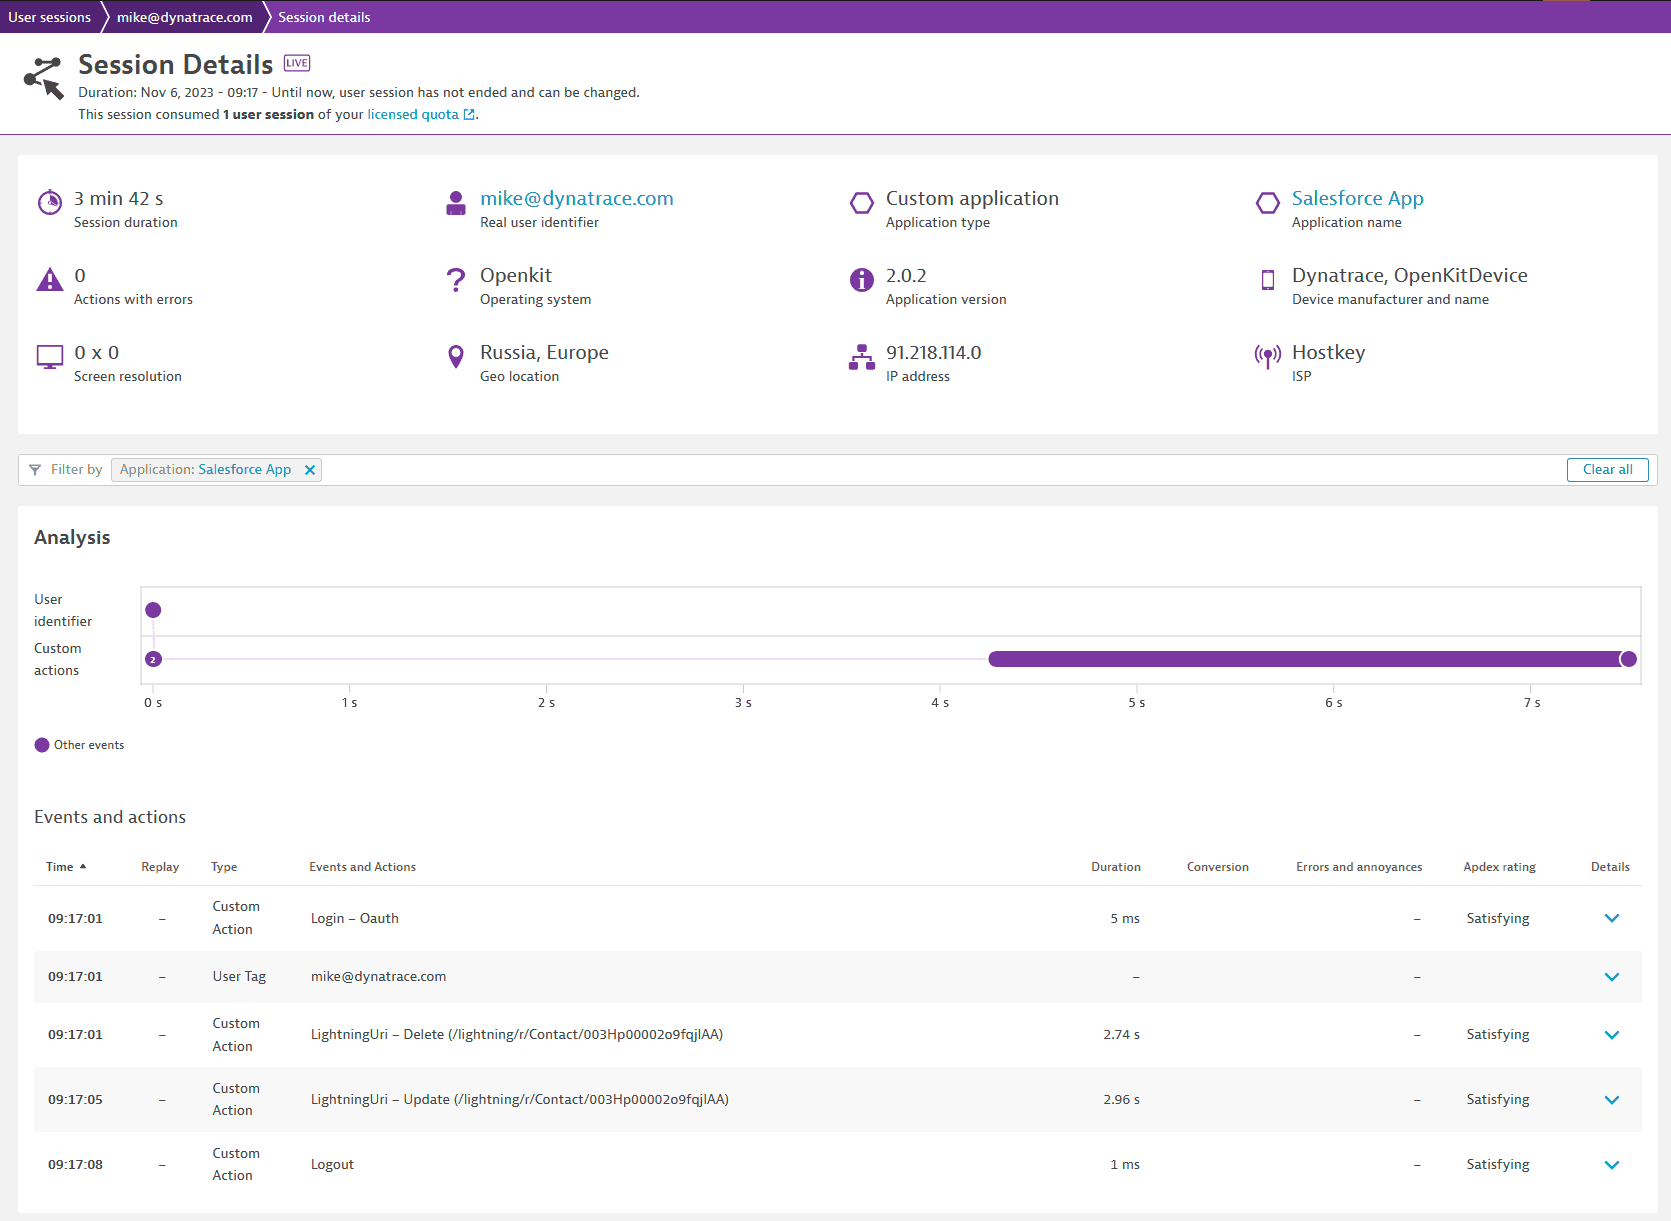
You can drill down to the Sessions:
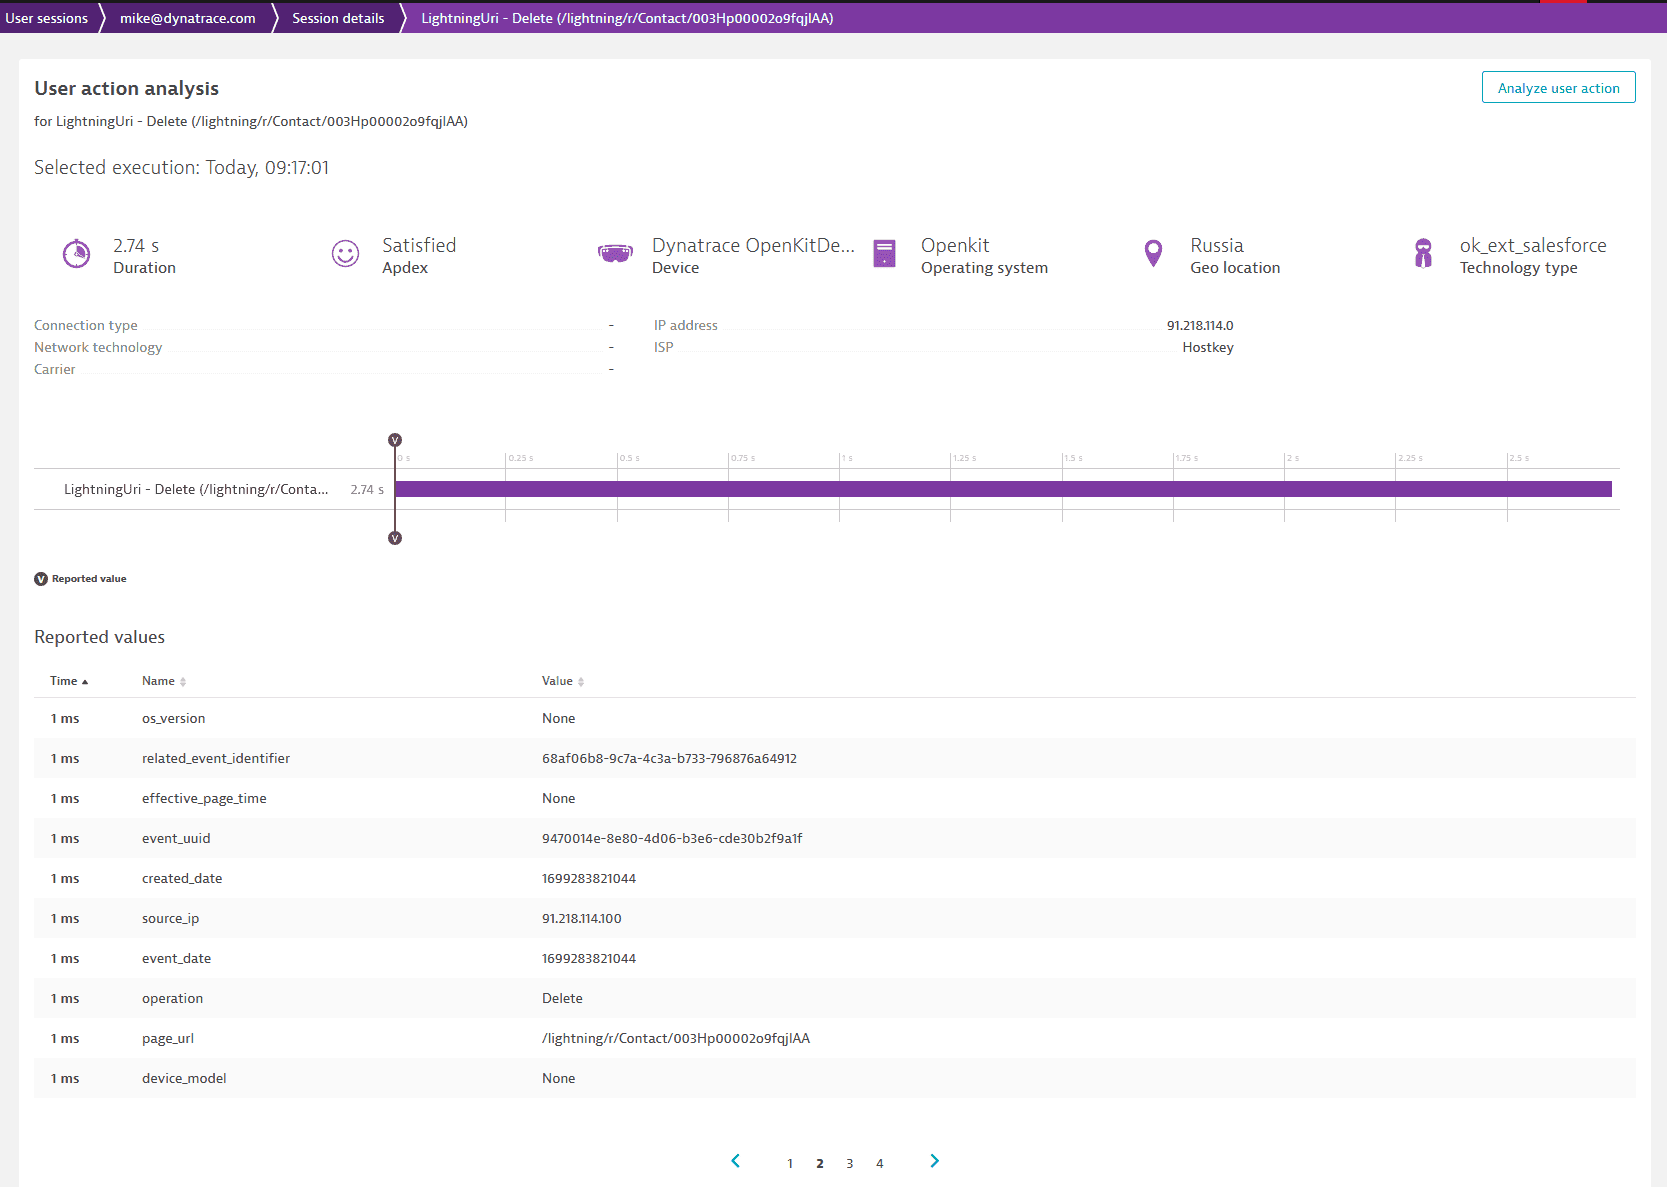
And to the individual properties, by clicking on the User Action > Perform waterfall analysis:
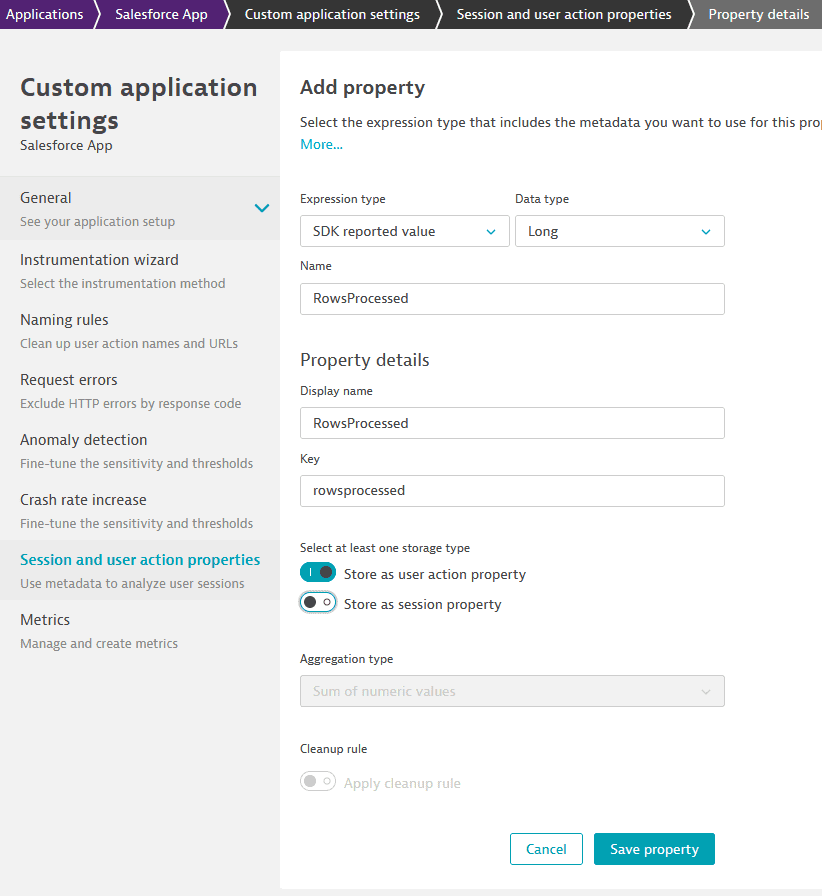
 To use these properties in User Sessions Query Language:
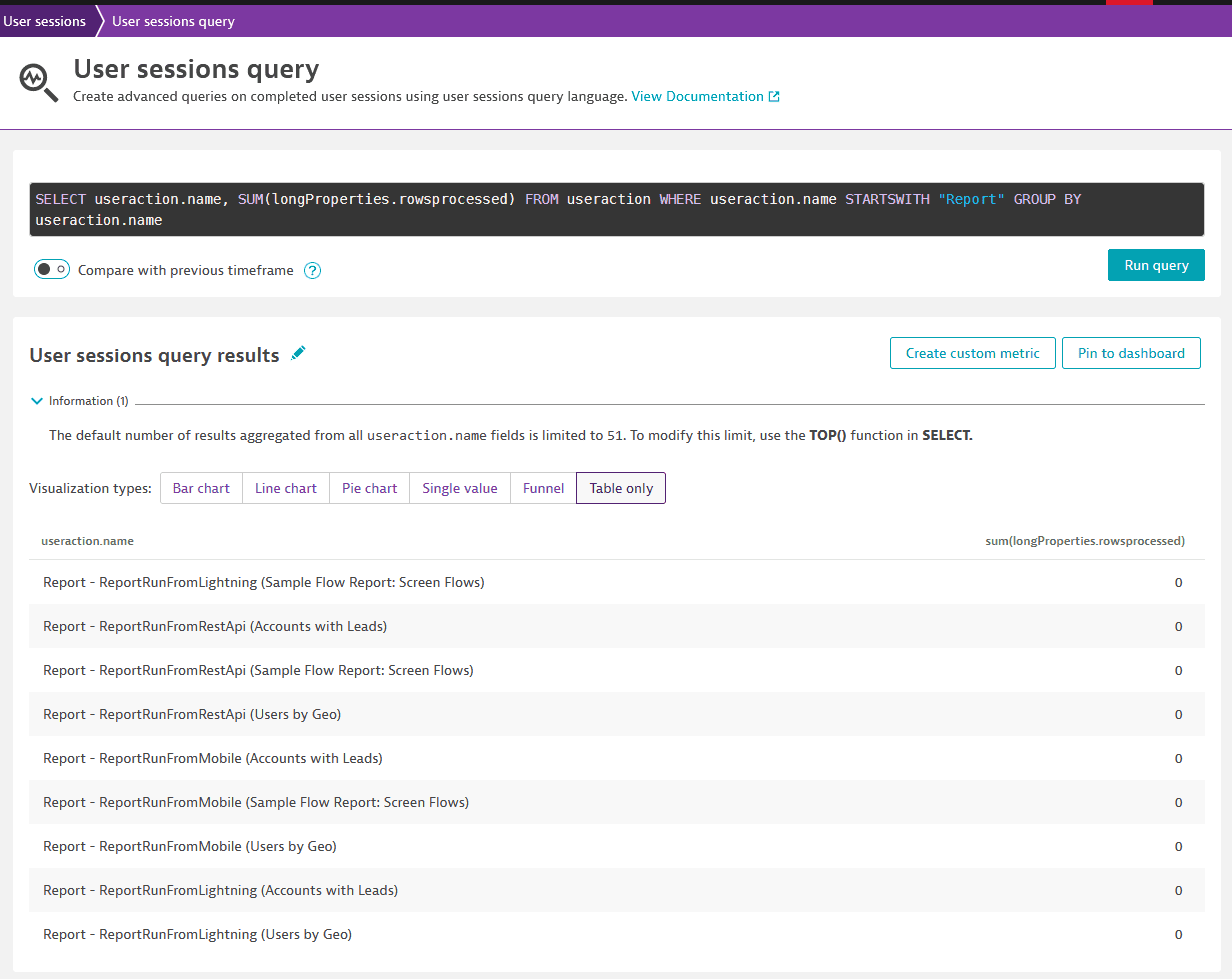
Session and user action propertiesExample: capturing the number of rows for a report:
Querying the property:
SELECT useraction.name, SUM(longProperties.rowsprocessed) FROM useraction WHERE useraction.name STARTSWITH "Report" GROUP BY useraction.name
For business events, all data is ingested using the business events API.
It can be queried using DQL:
fetch bizevents
| filter event.type == "salesforce.ApiEventStream"
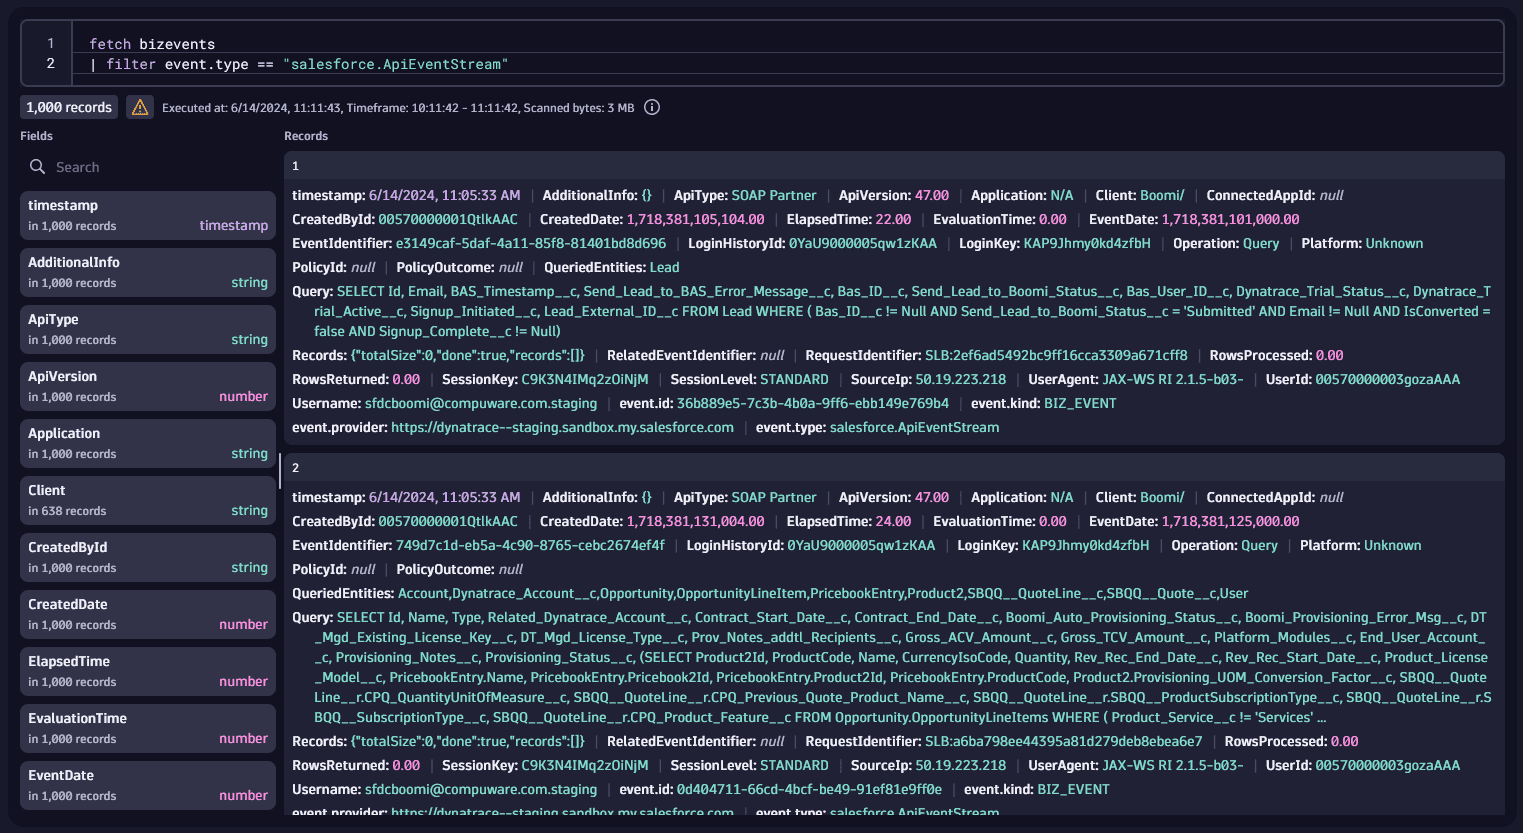
Each of the events of type salesforce.NameOfTheEvent will have all properties documented by Salesforce.
For instance, these are the properties for an ApiEventStream
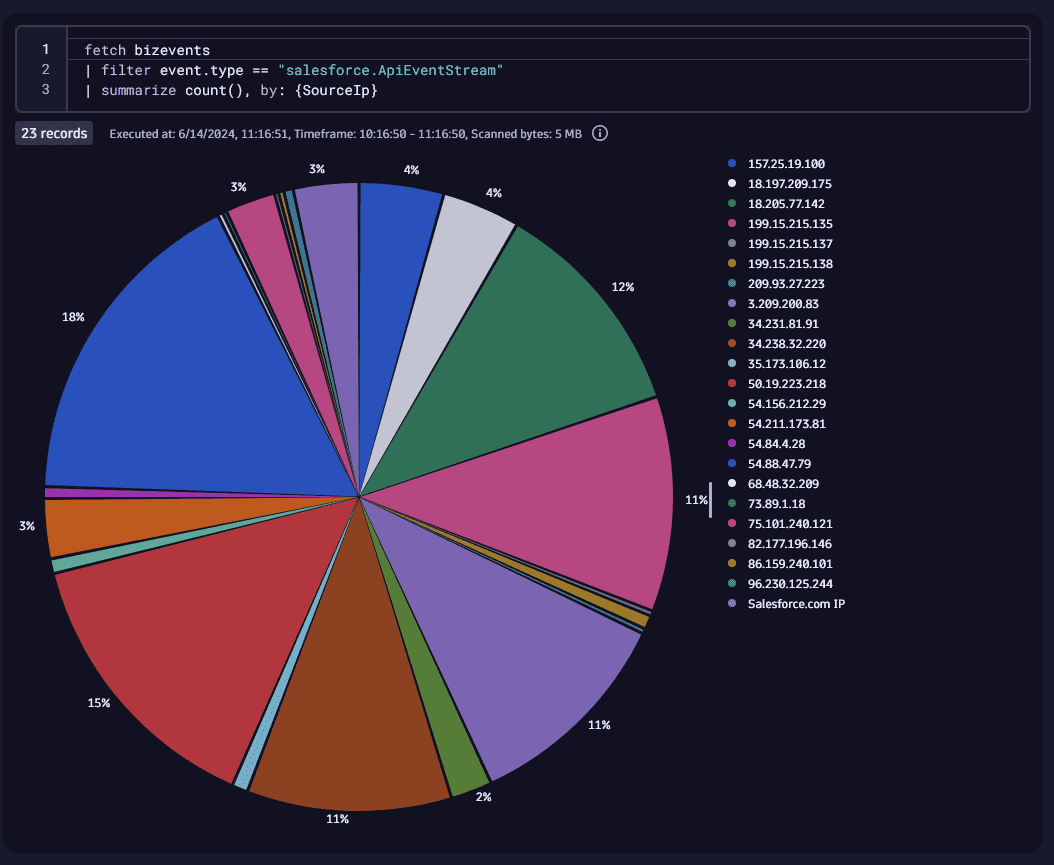
So we can create visualizations using all of these properties.
fetch bizevents
| filter event.type == "salesforce.ApiEventStream"
| summarize count(), by: {SourceIp}
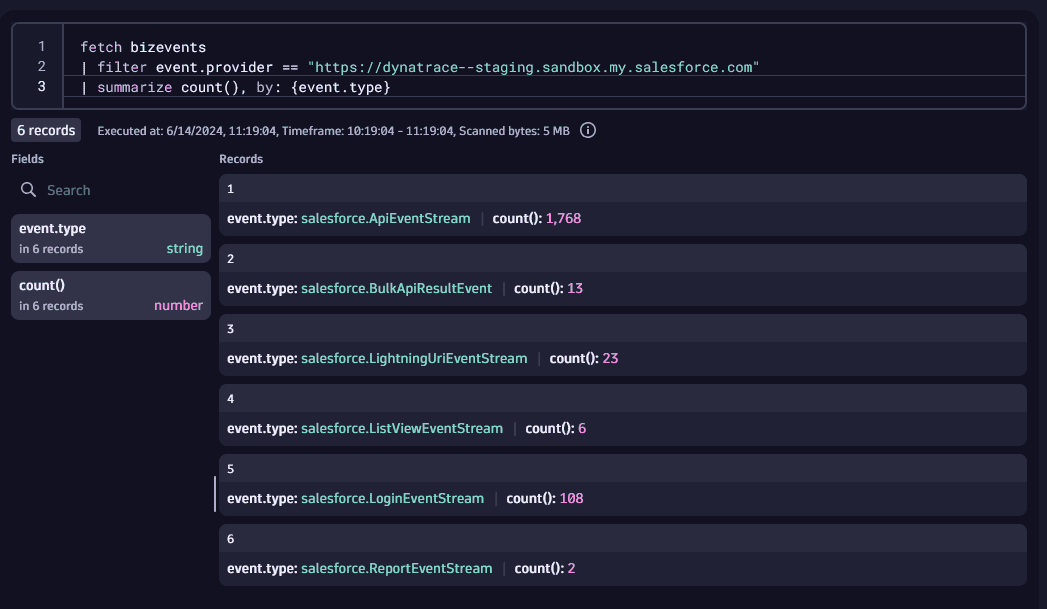
You can get a list of all event types with DQL:
fetch bizevents
| filter event.provider == "https://dynatrace--staging.sandbox.my.salesforce.com"
| summarize count(), by: {event.type}
Example: Get Logins by User overtime
fetch bizevents
| filter event.type == "salesforce.LoginEventStream"
| makeTimeseries logins=count(), by:{Username}, interval: 5m
| sort logins desc
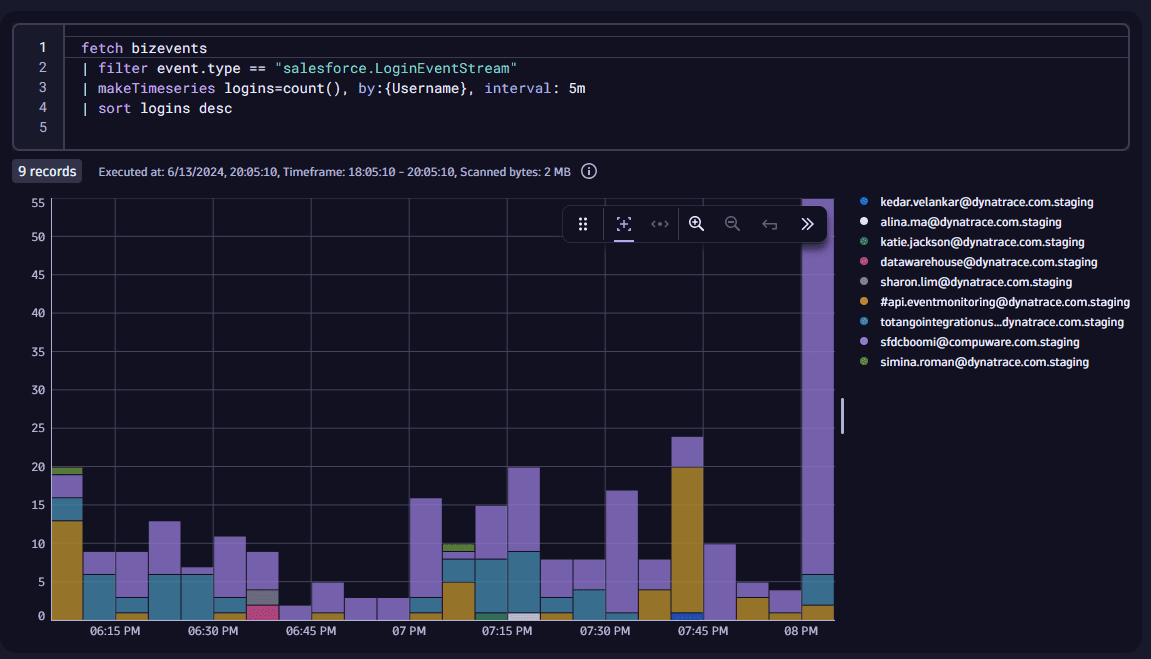
The Event Log File configuration allows you to ingest log files from Salesforce into Dynatrace.
Create a new Event Log File configuration by clicking Configure Event Log File.
Note that under Events to capture all the different Log Files will be disabled by default.
Select which log files you would like to ingest.
Event Log data is delayed by several hours in Salesforce. Do not expect real time data out of this configuration, according to Salesforce:
For hourly log files, depending on event delivery and final processing time, expect an event to take place 3–6 hours from the time of the event to be available in the log file. However, it can take longer.
The events are sent as Log Events to Dynatrace, and can be queries using DQL:
fetch logs
| filter query.type == "EventLogFile"
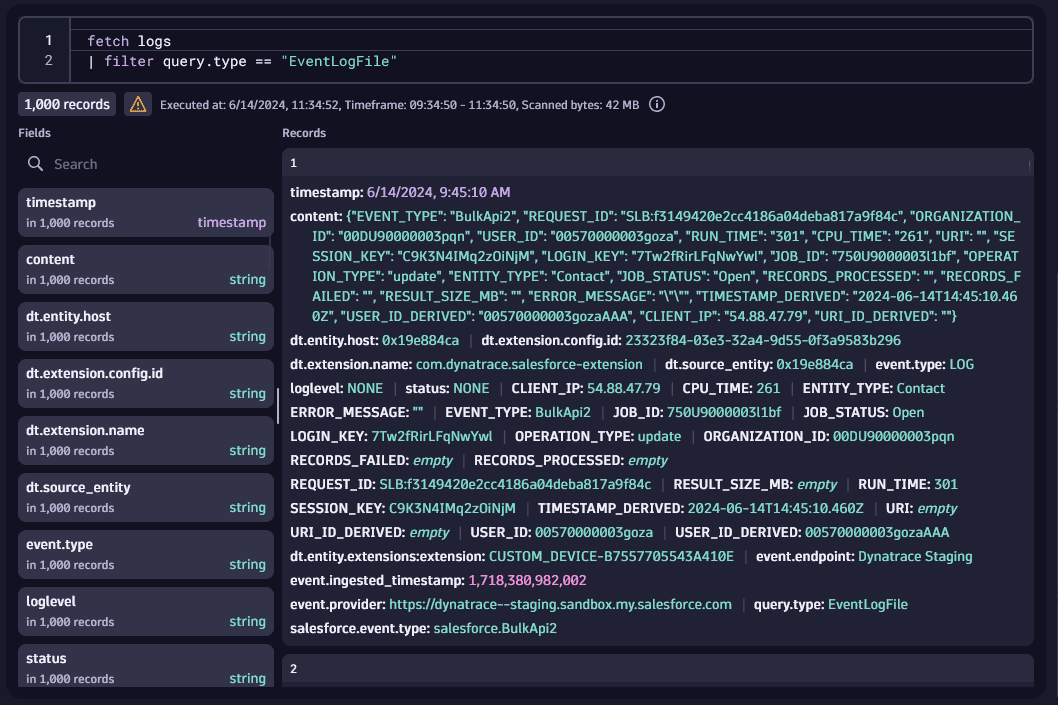
Every property for a certain Event Log File will be available.
You can find details for the fields here
Example:
Get details about ApexExecution events:
fetch logs
| filter EVENT_TYPE == "ApexExecution"
| fields TIMESTAMP_DERIVED, ENTRY_POINT, EXEC_TIME, CPU_TIME, DB_TOTAL_TIME, NUMBER_SOQL_QUERIES
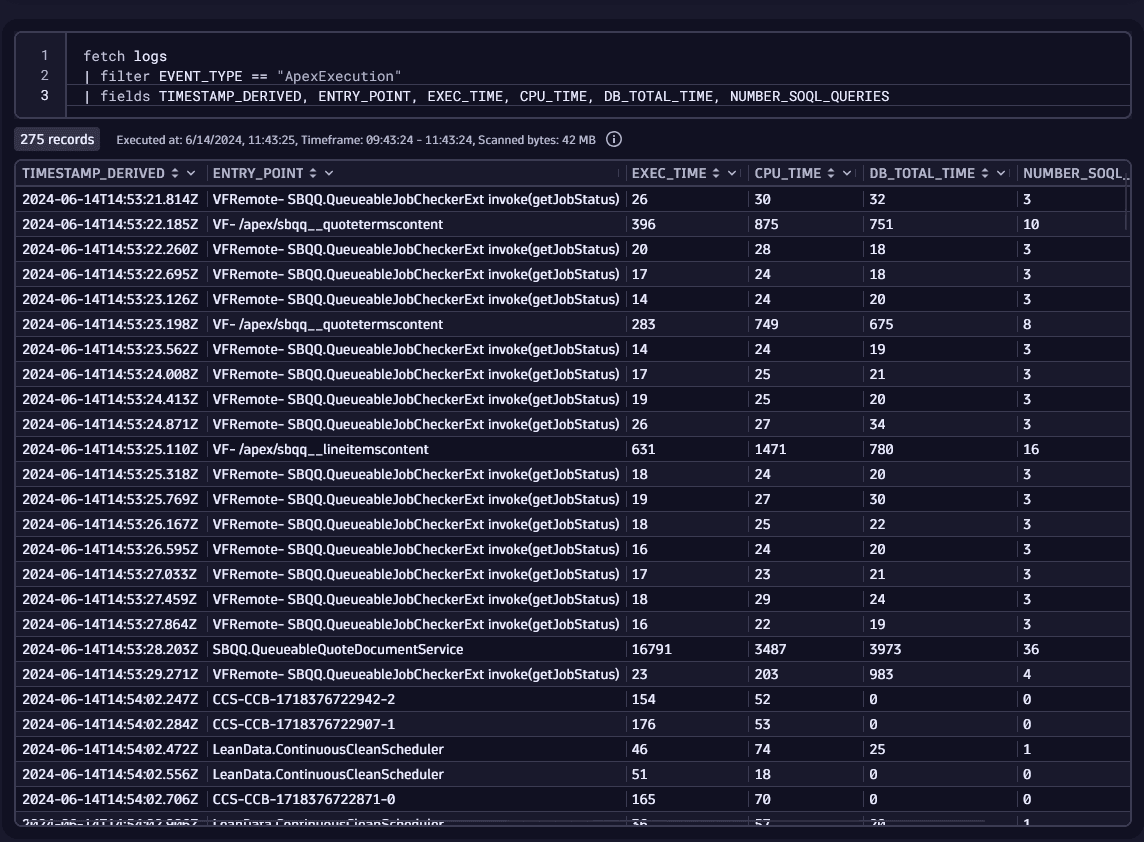
The API Queries configuration allows you to ingest Salesforce Object Query Language (SOQL) data into Dynatrace.
The user must have permissions to query the Salesforce API, and read the sObjects that are being queried.
To ingest Salesforce Object Query Language (SOQL) data into Dynatrace, click Configure API queries
Add up to 100 SOQL queries to be executed at the specified interval.
Each query has the parameters:
{last_execution_timestamp} must be used to filter the query results and deduplicate the data.SELECT Id, CreatedDate, Field, NewValue, OldValue FROM OpportunityFieldHistory WHERE CreatedDate > {last_execution_timestamp}The data is sent back to Dynatrace as log events.
Let's consider this query configuration:
Name: Logins
Query: SELECT UserId, COUNT(Id) from LoginHistory WHERE LoginTime > {last_execution_timestamp} GROUP BY UserId
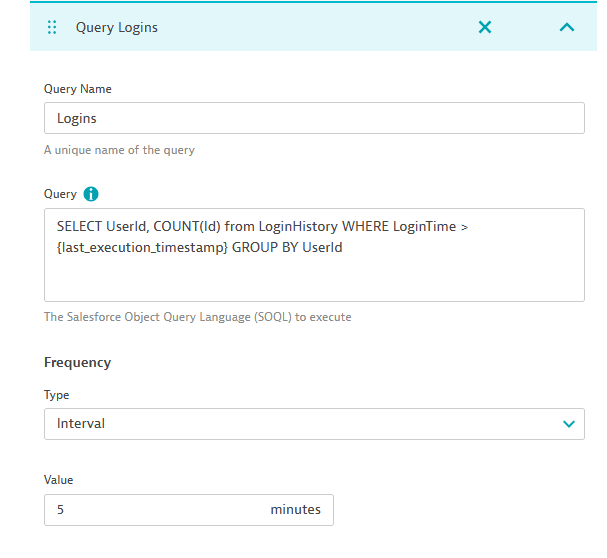
The results can be obtained with the DQL:
fetch logs
| filter query.name == "Logins"
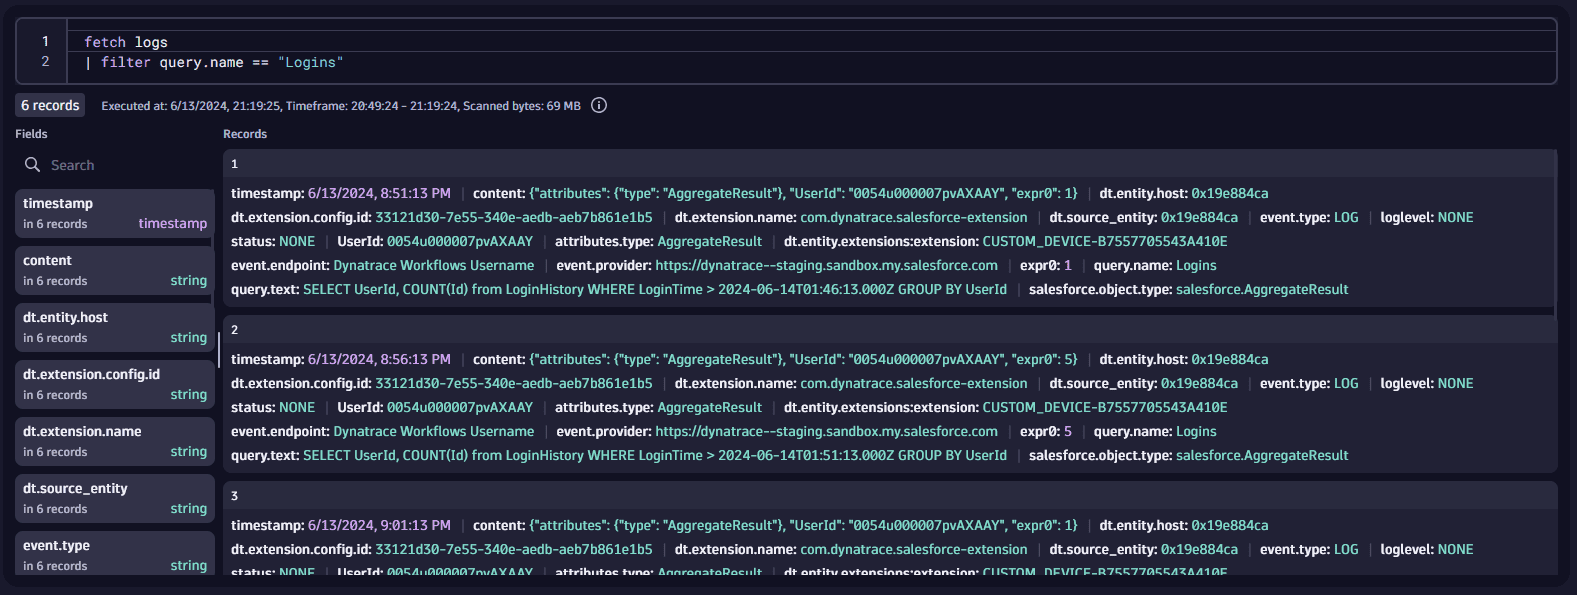
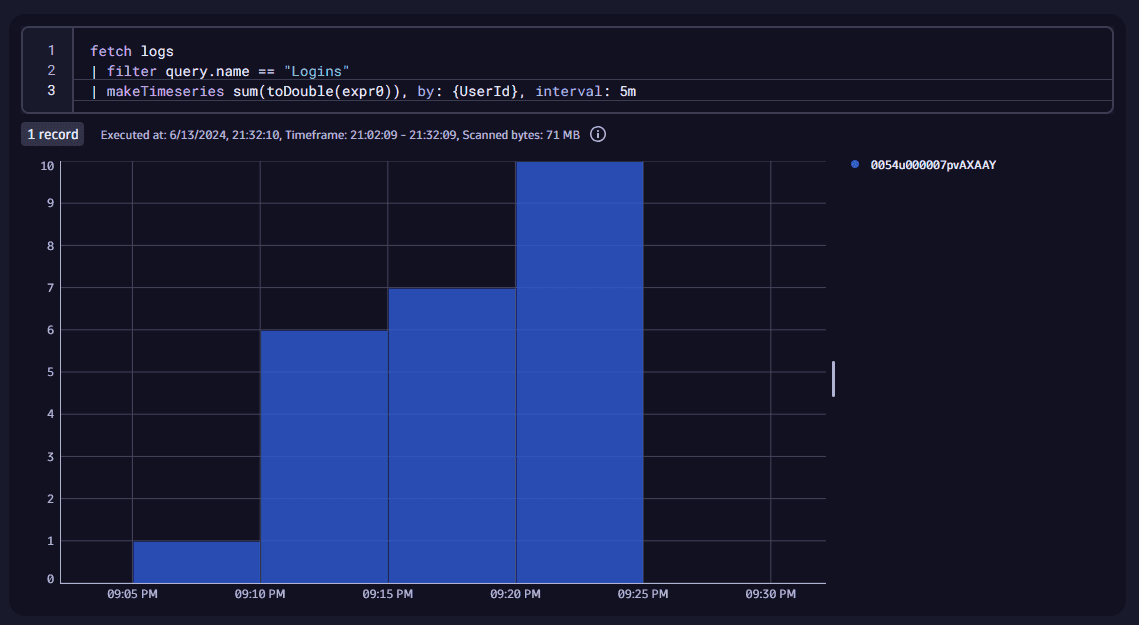
And a chart could be created with:
fetch logs
| filter query.name == "Logins"
| makeTimeseries sum(toDouble(expr0)), by: {UserId}, interval: 5m
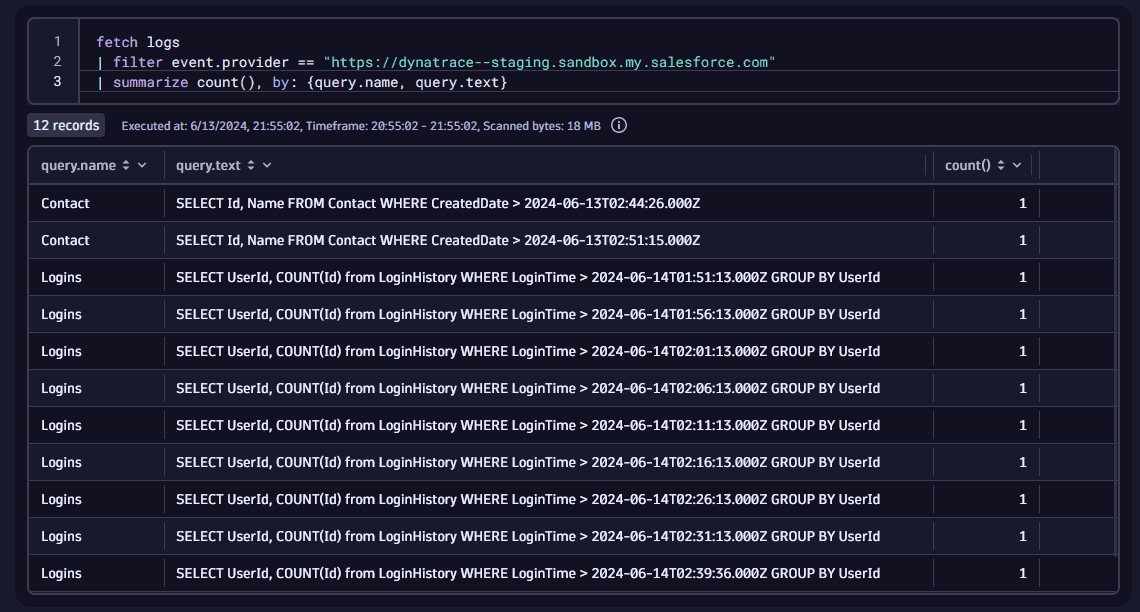
You can also fetch all the queries and their text configured for this Salesforce instance:
fetch logs
| filter event.provider == "https://dynatrace--staging.sandbox.my.salesforce.com"
| summarize count(), by: {query.name}
In this mode the extension connects as a Connected App, this is the recommended method of authentication and no user password is required.
Technically, the app implements the OAuth 2.0 JWT Bearer Flow
Dynatrace will ask for:
openssl (for generating the certificate, not needed if you already have a certificate and private key)Note, on Windows if you have git installed you should also have a copy of openssl.
It would be under a directory like C:\Program Files\Git\mingw64\bin depending on your installation.
You can read more about the OAuth 2.0 JWT Bearer Flow here
The connected app must have a certificate.
We later authenticate with Salesforce using this certificate's private key
This command generates a certificate and a private key:
openssl req -newkey rsa:2048 -nodes -keyout key.pem -x509 -days 365 -out cert.pem
The cert.pem file will be later added to the Connected App.
The key.pem file will be used by Dynatrace to authenticate with Salesforce.
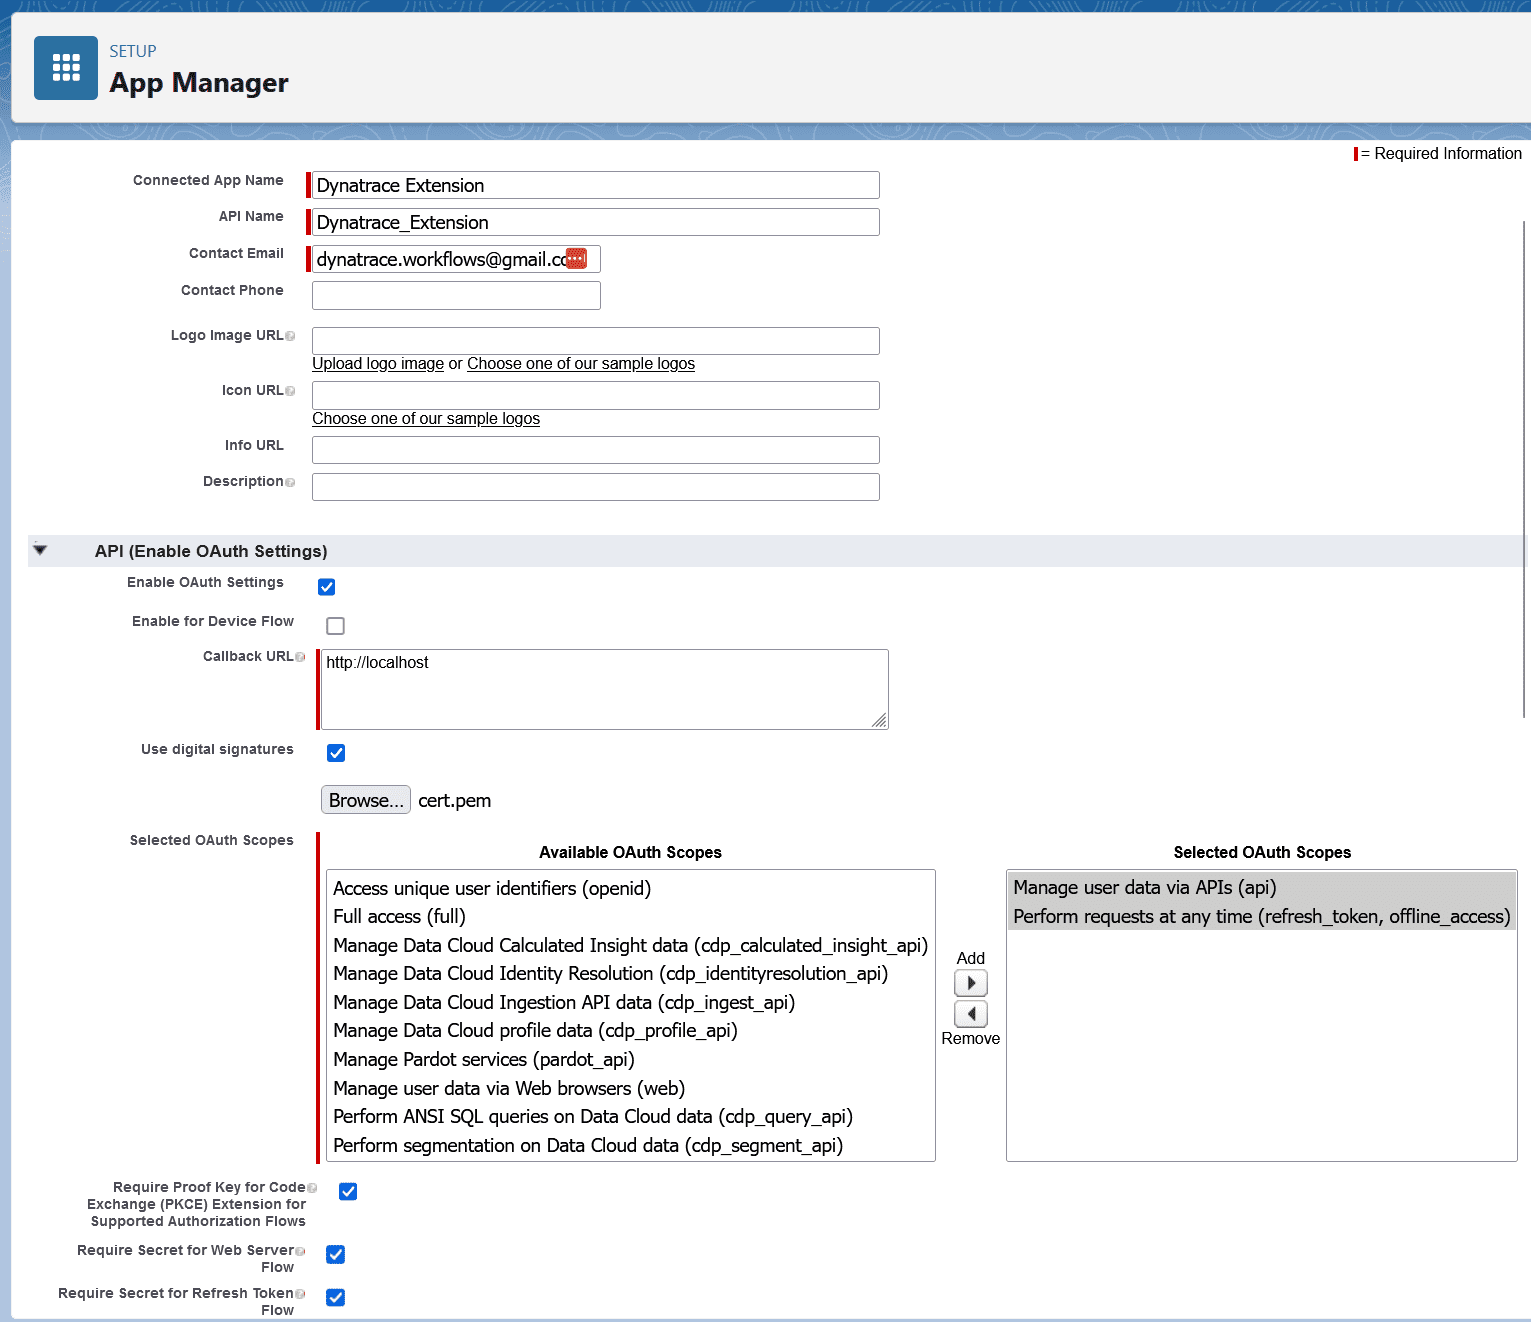
In Salesforce Lightning:

Give the app a name and add the contact email. Under API (Enable OAuth Settings):
http://localhostUpload the cert.pem file generated above under Use digital signatures.
Under Selected OAuth Scopes, Add these scopes:
Leave all other settings as default and click Save.
The Connected App screen should look like this (with your name, email and certificate):
Now set up the OAuth Policy permitted users.
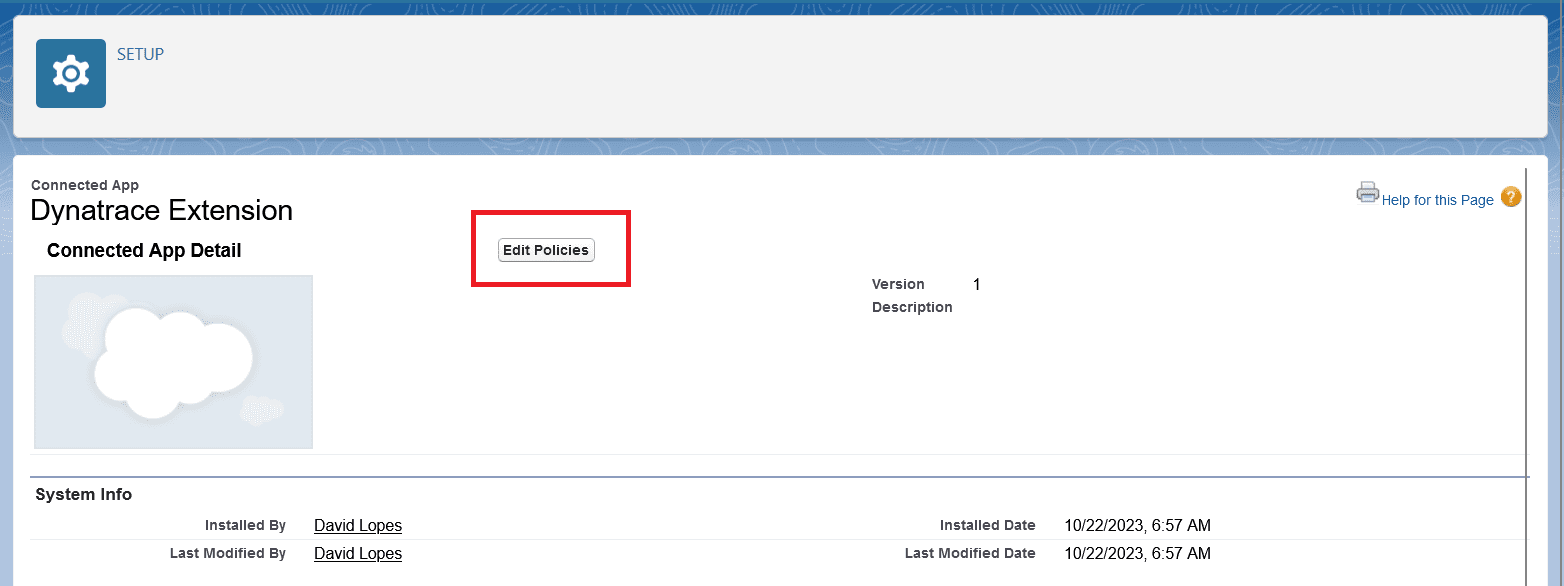
On the connected app page, select Manage, then Edit Policies.
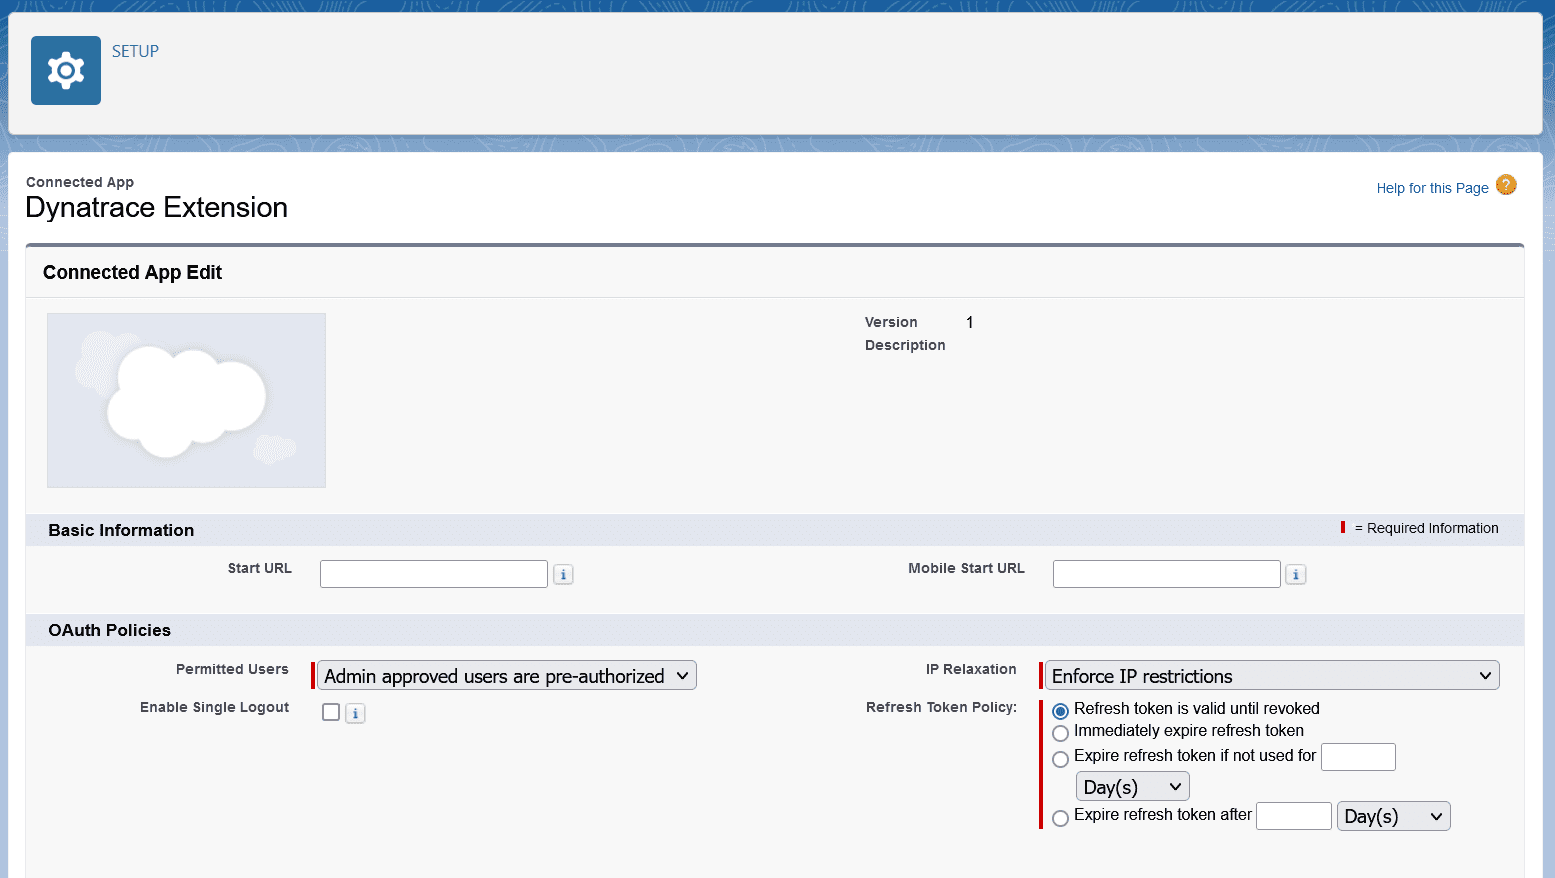
Under OAuth Policies select Admin approved users are pre-authorized.
Click Save.
Identify users that can use the app.
This is done by adding Profiles to the Application Profile Assignment list.
One the connected app page, under Profiles, click Manage Profiles.
Add profiles that can use the connected app.
Note: Later, any username from these profiles can be used as the Subject when configuring the extension.
Note that the profile needs the permissions for event streaming:
General User Permissions
View Real-Time Event Monitoring DataAdministrative Permissions
Customize ApplicationView All DataPlease check the needed permissions documentation here

For Client ID authentication, create an API Only user in Salesforce, and provide the Client ID and Client Secret.
Error logs can be obtained via Dynatrace, by navigating to the Extension page, and clicking on the Status for each Monitoring Configuration.
Detailed logs can be obtained by creating an Activegate Diagnosis

Users can now ingest EventLogFile data and run SOQL queries against Salesforce, please check the hub for documentation on how to use these features.
BEGIN RSA PRIVATE KEY were not parsed correctlyFixes an issue where in some installations the install directory could not be determined
No release notes
You can search all listings, or try a different spelling or keyword. Still nothing? Dynatrace makes it easy to create custom apps.