 IBM i
IBM i- Product information
- Release notes
Overview
Dynatrace offers remote monitoring of IBM i hosts via this ActiveGate extension.
The ingested data provides Dynatrace with real-time visibility into host performance through interactive visualization tools, dashboards, unified analysis and events. When combined with OneAgent monitoring, you gain the ability to understand how IBM i interacts with the other components in your stack.
Get started
Requirements
Note: For best performance and data collection, these requirements are strict. Always keep your system up to date.
- ActiveGate must be 1.265+
- Dynatrace version 1.265+
- IBM has made significant performance improvements and introduced more accurate metrics in their latest Technology Refresh levels. For this reason, only the following IBM i Releases are supported:
- IBM i 7.3 Technology Refresh 12+ (must have PTF Group SF99703 Level 28+)
- IBM i 7.4 Technology Refresh 6+ (must have PTF Group SF99704 Level 20+)
- IBM i 7.5
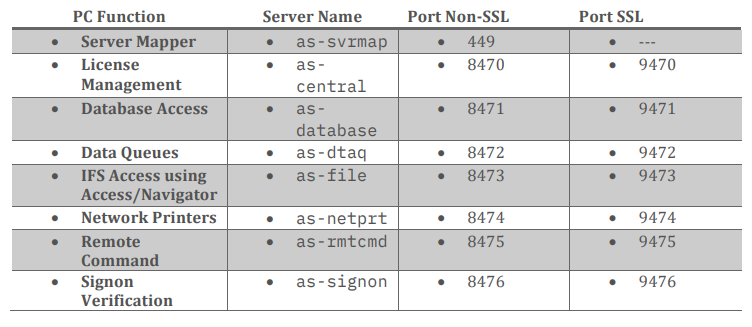
- Communication ports between ActiveGate and IBM i Hosts must be open.
- IBM i Access ODBC driver must be installed on ActiveGate. This is a specific driver provided by IBM for DB2 communication with IBM i hosts.
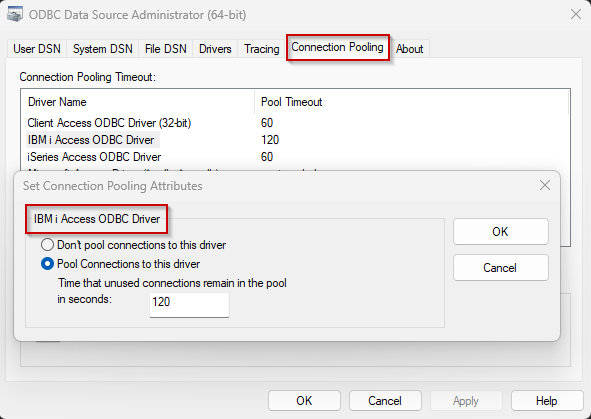
- Connection pooling must be enabled on ODBC driver. On Windows, this is enabled by default.
- Due to sensitive system data, IBM requires a user with SECOFR profile to access performance tables and all its functions. Failure to provide this access will cause issues with missing metrics, missing messages in queues, prohibited access to internal functions and calls made by IBM. You are free to configure other user classes with less privileges but it would not be supported.
Windows ActiveGates (For Linux, continue below)
ODBC driver installation
Follow these instructions if you are using ActiveGates running on Windows:
- Head to IBM's website.
- Click the Downloads for IBM i Access Solutions link.
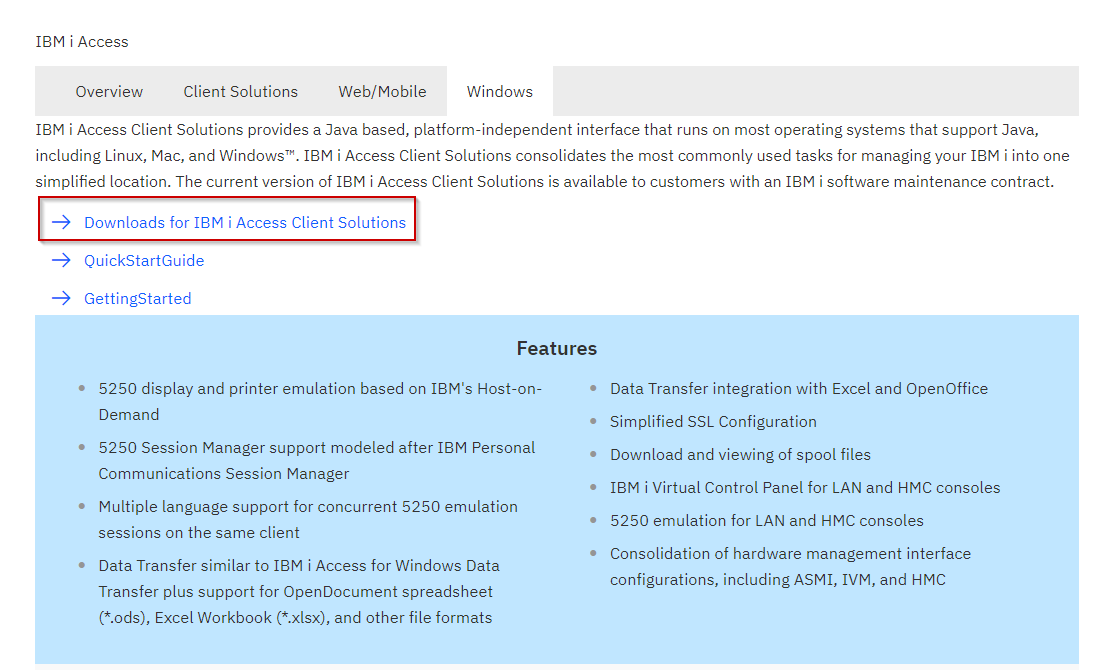
- Log in with your IBM account and accept the License terms.
- The correct ODBC driver comes only in the "IBM i Access Client Solutions - Windows Application Package for Windows.". Only this package contains the ODBC driver needed. Do not install the "IBM i Access Client". Make sure you download the Windows package.
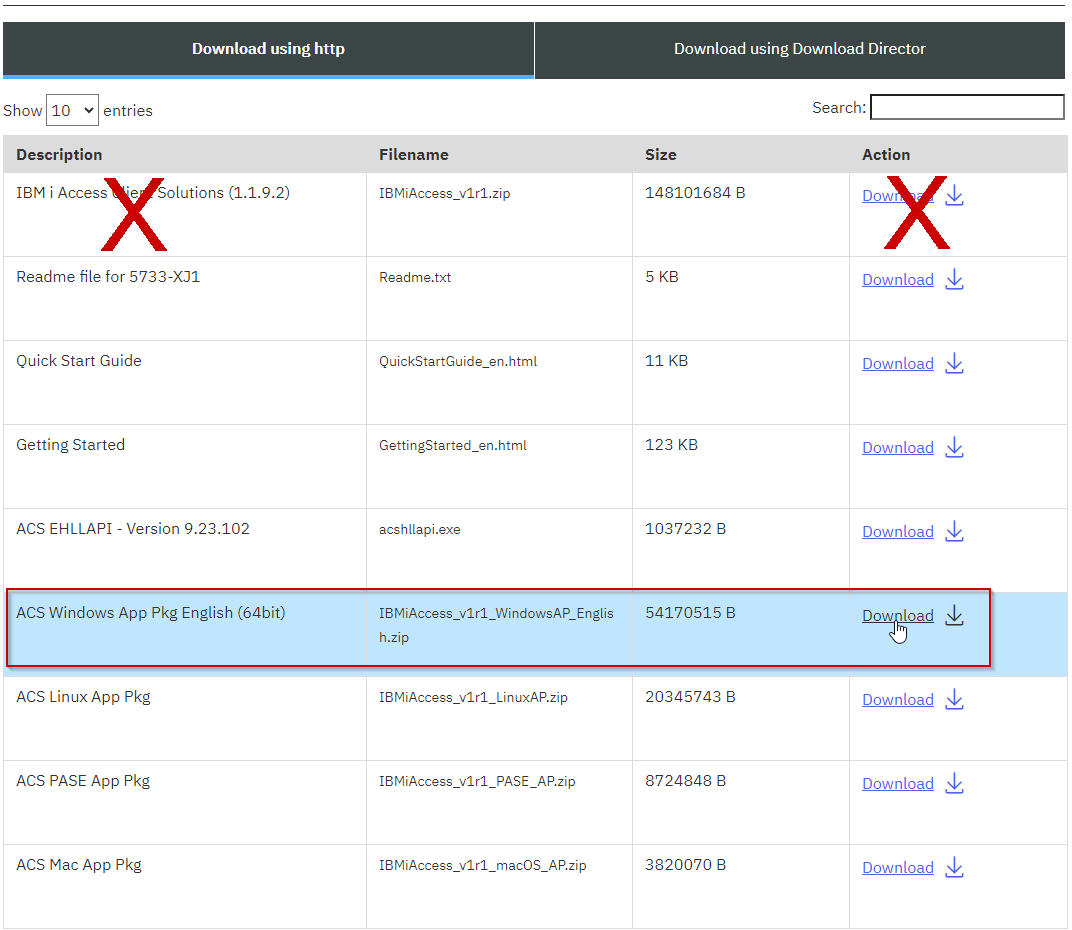
- Extract file zip archive and follow its instructions to install on the ActiveGate.
- After installation, confirm the IBM i Access driver is installed and Connection Pooling is enabled by running native ODBC Data Sources Windows application. You may increase its timeout to a number no less than 60.
Linux ActiveGates (Advanced setup)
Linux distributions do not come with an ODBC driver manager and this is needed to connect to IBM i. unixODBC is the most accepted, compatible driver manager for Linux and it is also approved by IBM.
- ⚠️ Installation of unixODBC requires advanced Linux knowledge.
- 🛑 You must install unixODBC 2.3.12 or higher. Earlier versions are not supported due to necessary fixes only available on version 2.3.12 and newer.
- Depending on your Linux distribution, this version might be available to your distribution (rpm, debian or others) or you may need to compile it from source code. This is the part where you might need a Linux administrator to make this determination.
Installing unixODBC, installs libraries and commands needed to connect to IBM i. Following this unixODBC, you must now install the IBM i Access ODBC Driver.
ODBC driver installation on Linux
- Head to IBM's website.
- Click the Downloads for IBM i Access Solutions link.
- Log in with your IBM account and accept the License terms.
- The correct ODBC driver comes only in the "IBM i Access Client Solutions -Linux Application Package for Linux.". Only this package contains the ODBC driver needed. Do not install the "IBM i Access Client". Make sure you download the Linux package.
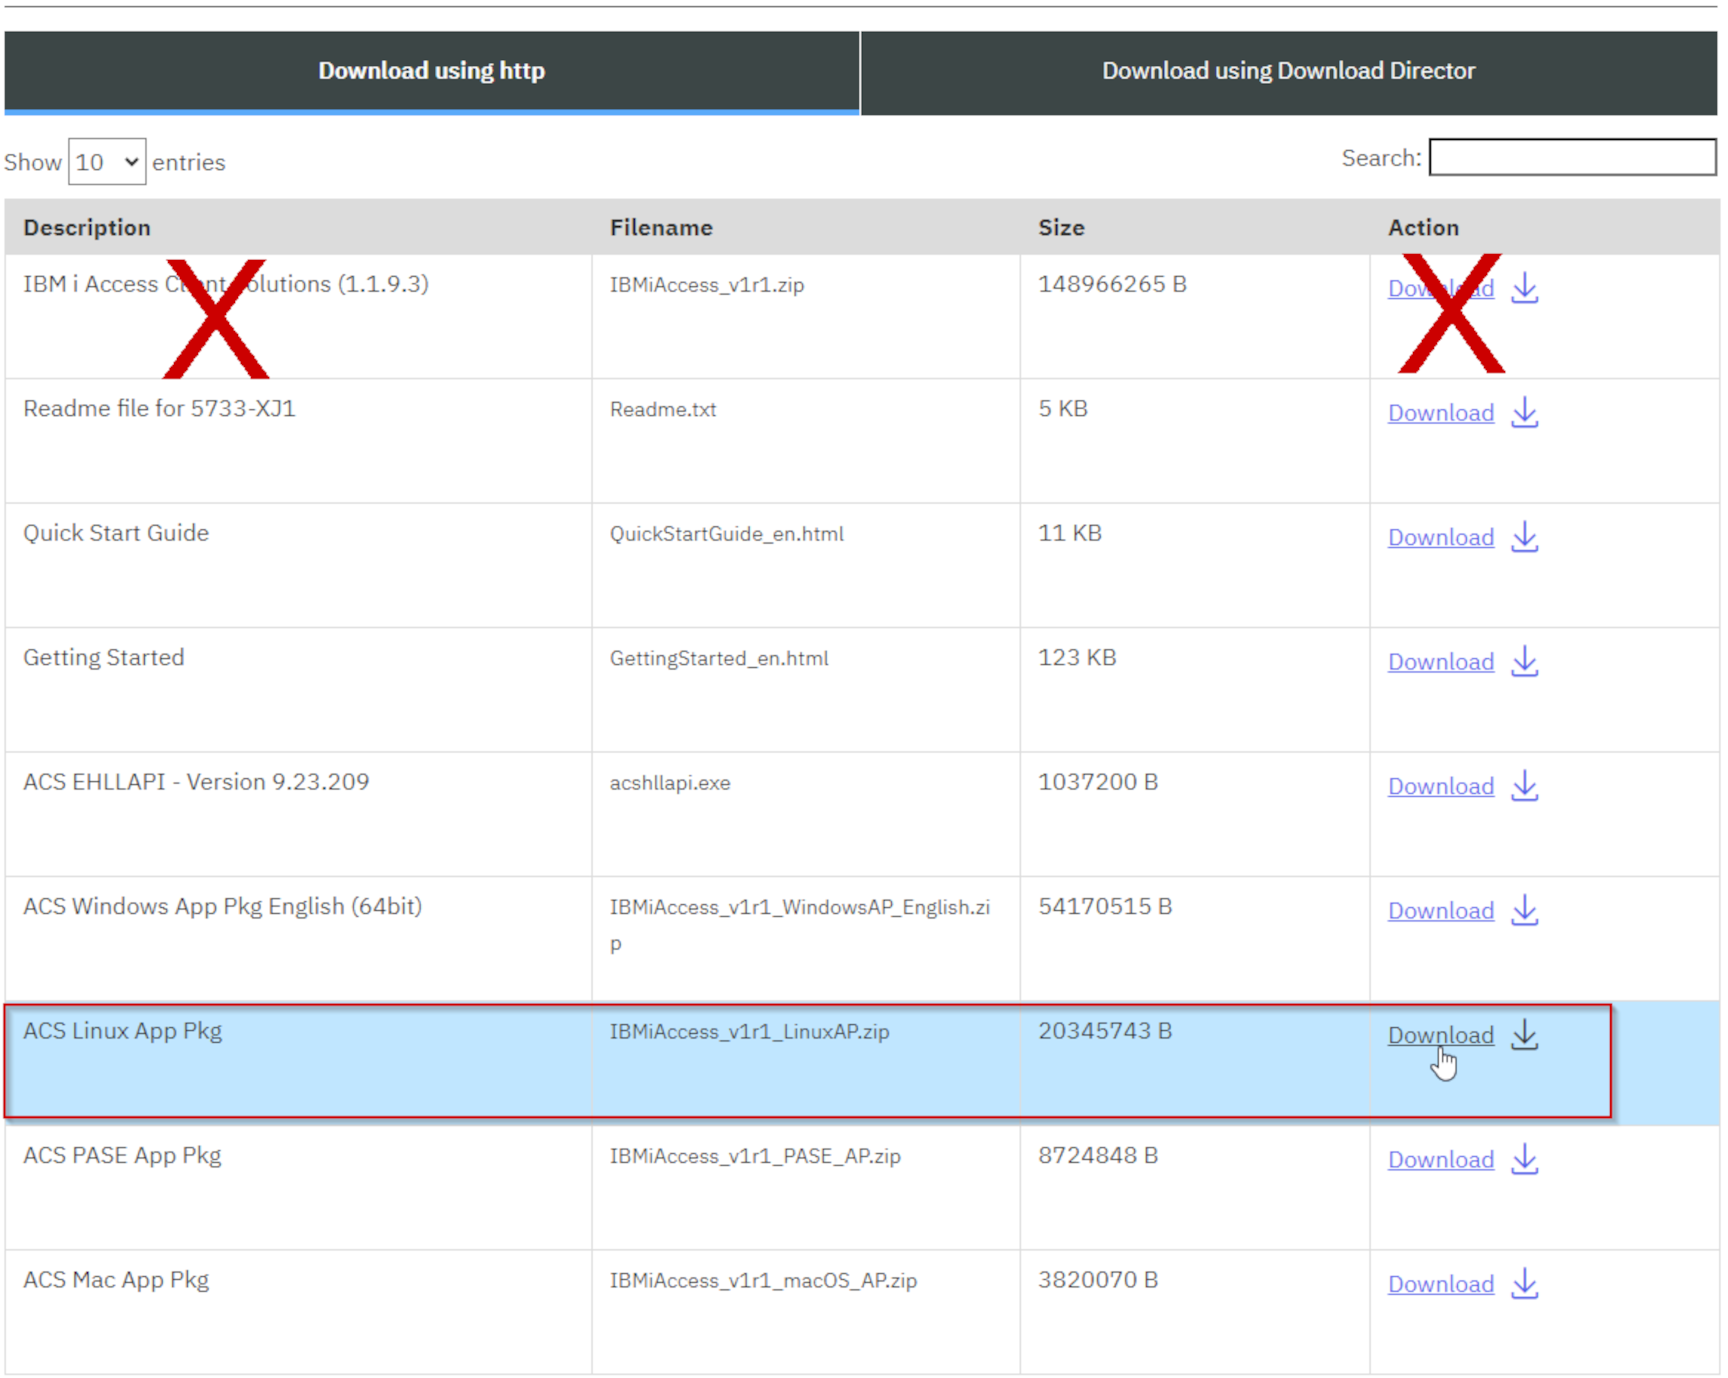
- Extract file zip archive and follow its instructions to install on the ActiveGate.
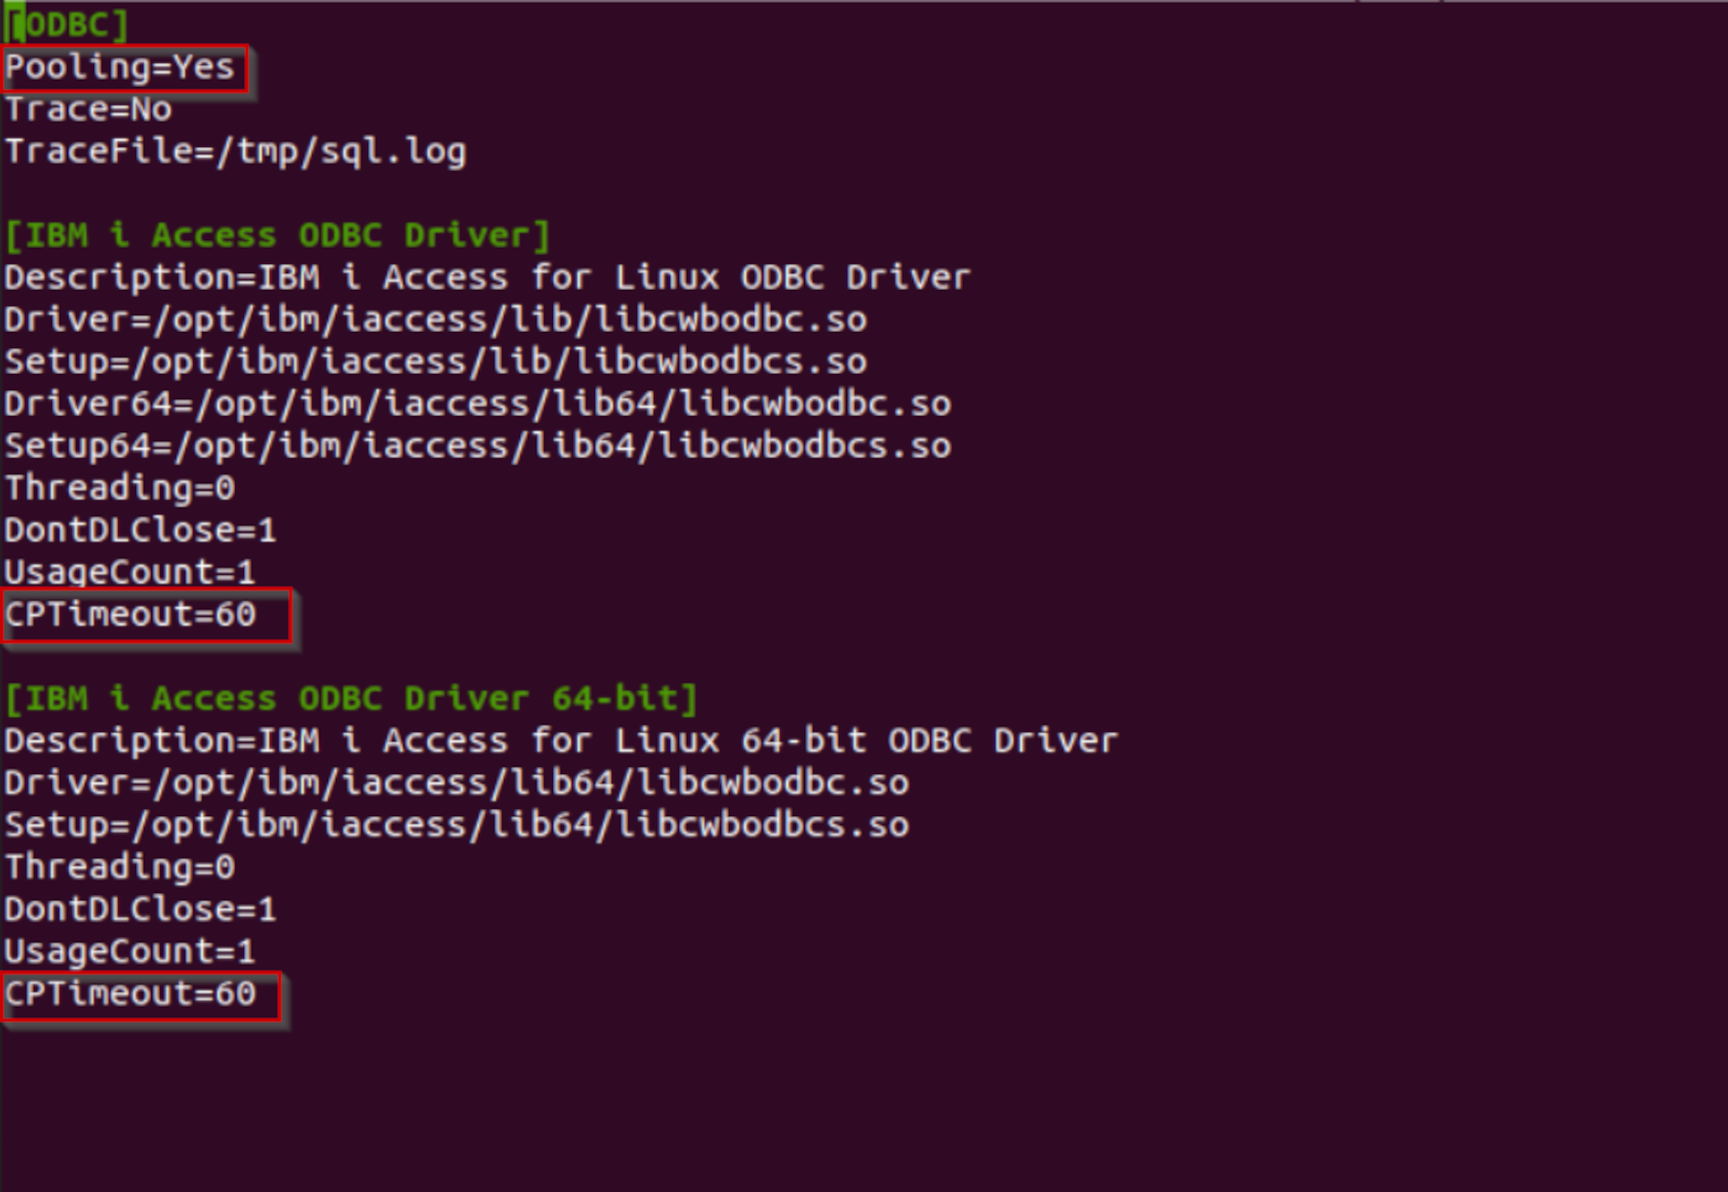
- After installation, you must now enable Connection Pooling in the IBM i Access ODBC Driver definition in the
odbcinst.inifile. - Locate your odbcinst.ini file, by default it is in
/etc/odbcinst.inior/etc/unixODBC/odbcinst.ini, then addCPTimeout=60to each driver definition. This setting is needed for the extension to run and provide accurate measurements.
- ⚠️Installing IBM i Access ODBC Driver may install older dependencies, including older versions of unixODBC. Verify that you are still running unixODBC 2.3.12+ afterwards.
Extension configuration
-
Log into your Dynatrace console.
-
Under
Extensionson the left menu, selectIBM i. -
Add a monitoring configuration.
This ActiveGate extension, also referred as "Remote", runs in ActiveGate groups.
-
Select which ActiveGate group will run this configuration. At least one ActiveGate must be in your group.
- Log level: Enable DEBUG only when troubleshooting or support instructs you to do so.
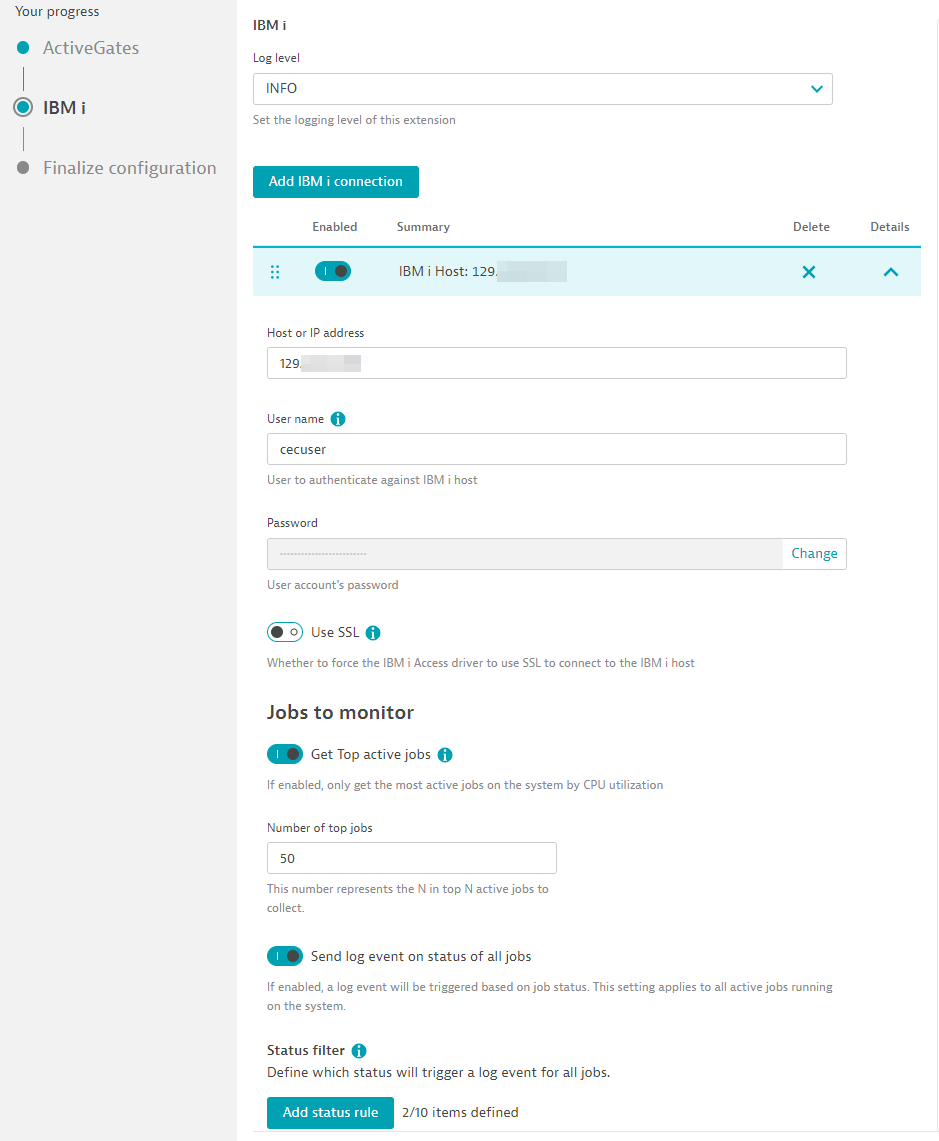
- Add an IBM i Host: Click to configure each connection to individual hosts. All these connections will be run from this ActiveGate group.
Host
- Host or IP address: Hostname or IP of the IBM i Host.
- User name: Due to sensitive system data, table functions and internal stored procedures, a user with SECOFR access to the IBM i Host is required.
- Password: Password to user above.
- Use SSL: Toggle if connecting to host using SSL.
Jobs
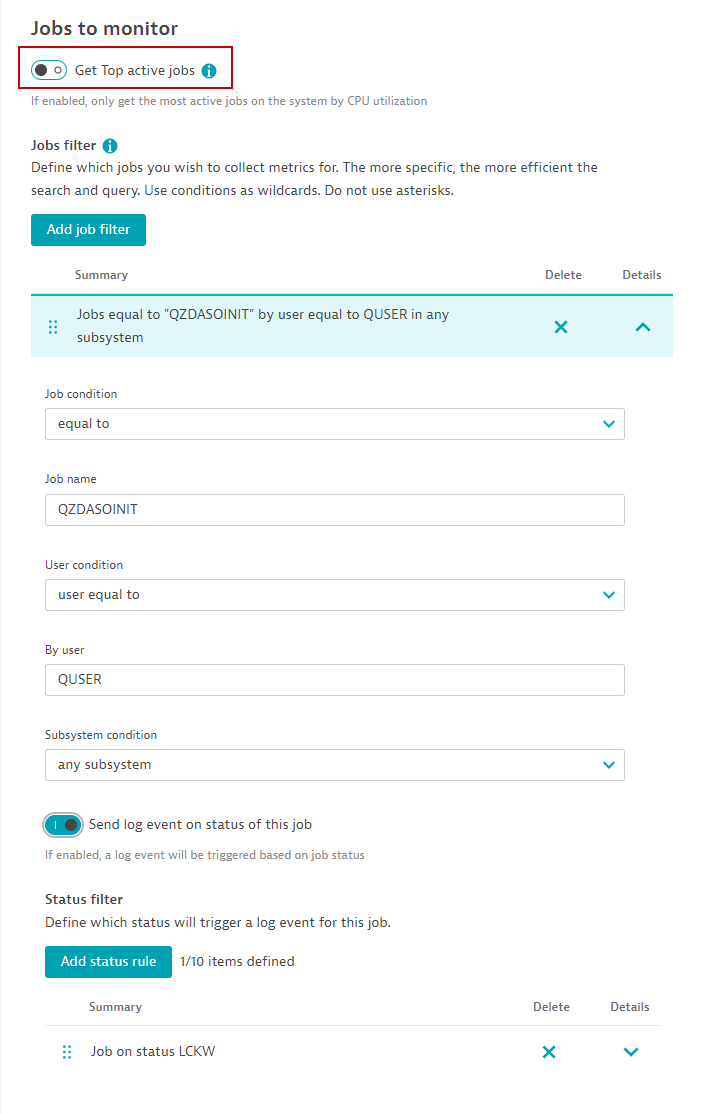
- Get Top active jobs: Toggle to collect Top N CPU consuming jobs. (Max 500). This requires the least amount of configuration as it automatically collects most taxing jobs by CPU. Disabling this toggle allows you to manually configure which jobs by certain filters.
- Send log event on status of all jobs: Toggle this button to configure rules that will trigger a log event for any job on the system that matches a status. Resulting log event will include the job number as well.
- Add job filter: If Top active jobs is disabled, you can manually configure rules that match certain jobs, by user and by subsystem too.
- Send log event on status of this job: Toggle this button to configure rules that will trigger a log event if this job is in that status. Resulting log event will include the job number as well.
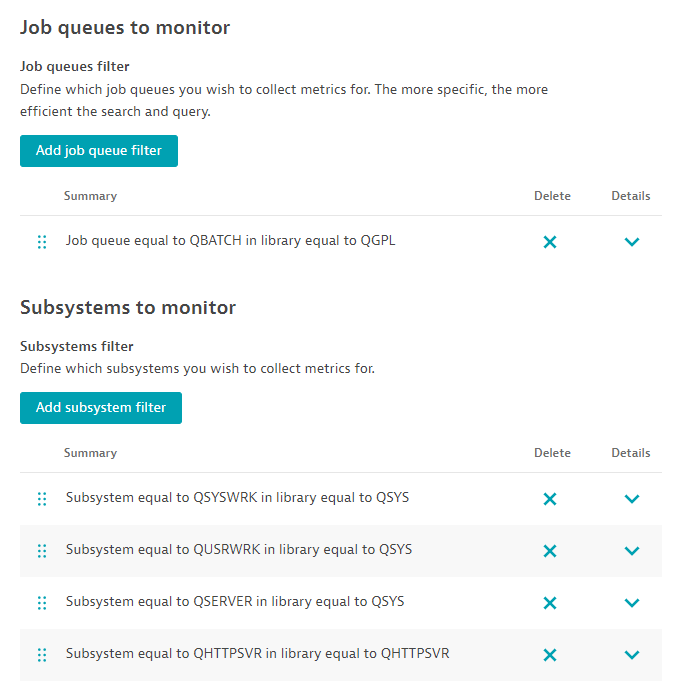
Job queues
- Add job queue filter: Configure a rule for job queues matching a name and/or library they are in.
Subsystems
- Add subsystem filter: Configure a rule for subsystems matching a name and/or library they are in.
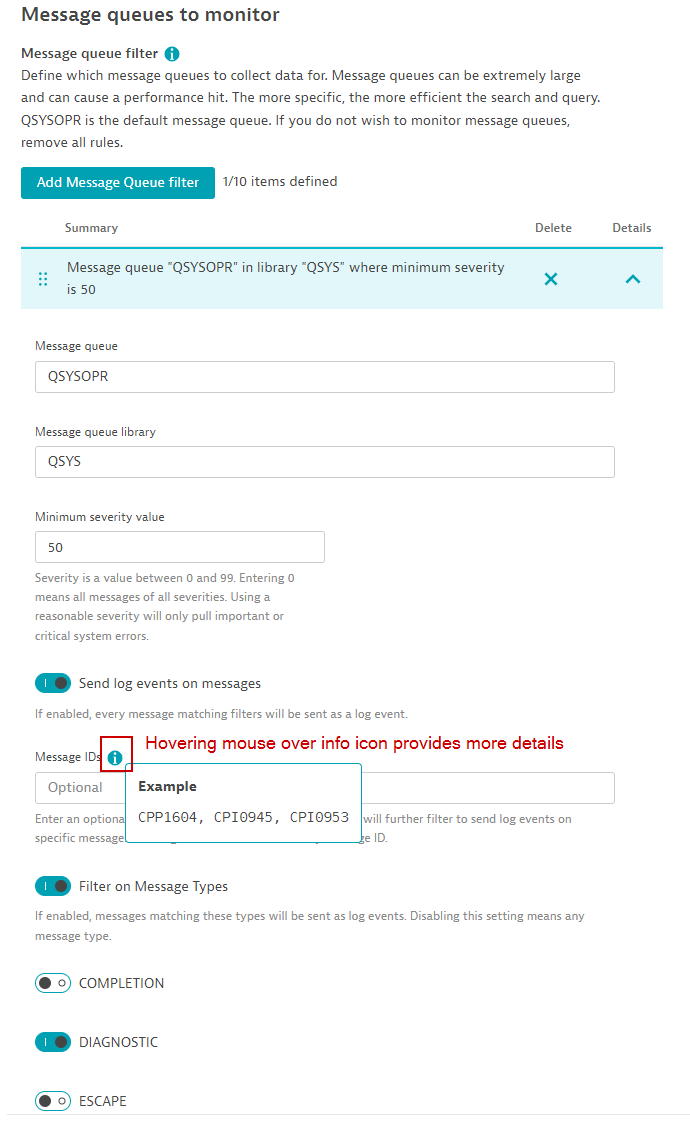
Message queues to monitor
- Add Message Queue filter: A default message queue is configured, QSYSOPR. Most system messages are in this queue. However, you may add more rules for other message queues. Only messages in these queues that have a minimum severity will be counted. Optionally you may see individual messages by triggering log events for those messages that match a criteria.
- Minimum severity: Messages have a severity level from 0 to 99. Using this filter will eliminate noise and messages that are not critical.
- Send log events on message: Toggle this button to trigger log events on messages that match severity and Message IDs and/or Message types.
- Message IDs: Enter a comma-separated list of important Message IDs. You may leave this blank to match any message ID.
- Filter on message types: Toggle which Message types to filter on. Leave this blank to filter on any of them.
History log messages to collect
- Define rule: Most messages, even the ones from message queues, go into the History Log. You may filter what messages you are interested in. Multiple rules will collect different type of messages. Only messages that have a minimum severity and matching criteria will be counted. All messages found will be automatically sent as Dynatrace log events.
- Minimum severity: Messages have a severity level from 0 to 99. Using this filter will eliminate noise and messages that are not critical.
- Message IDs: Enter a comma-separated list of important Message IDs. You may leave this blank to match any message ID.
- Filter on message types: Toggle which Message types to filter on. Leave this blank to filter on any of them.
- Minimum severity: Messages have a severity level from 0 to 99. Using this filter will eliminate noise and messages that are not critical.
Output queues
- Add Output queue filter: Configure rules to collect output queues and information about their spooled files.
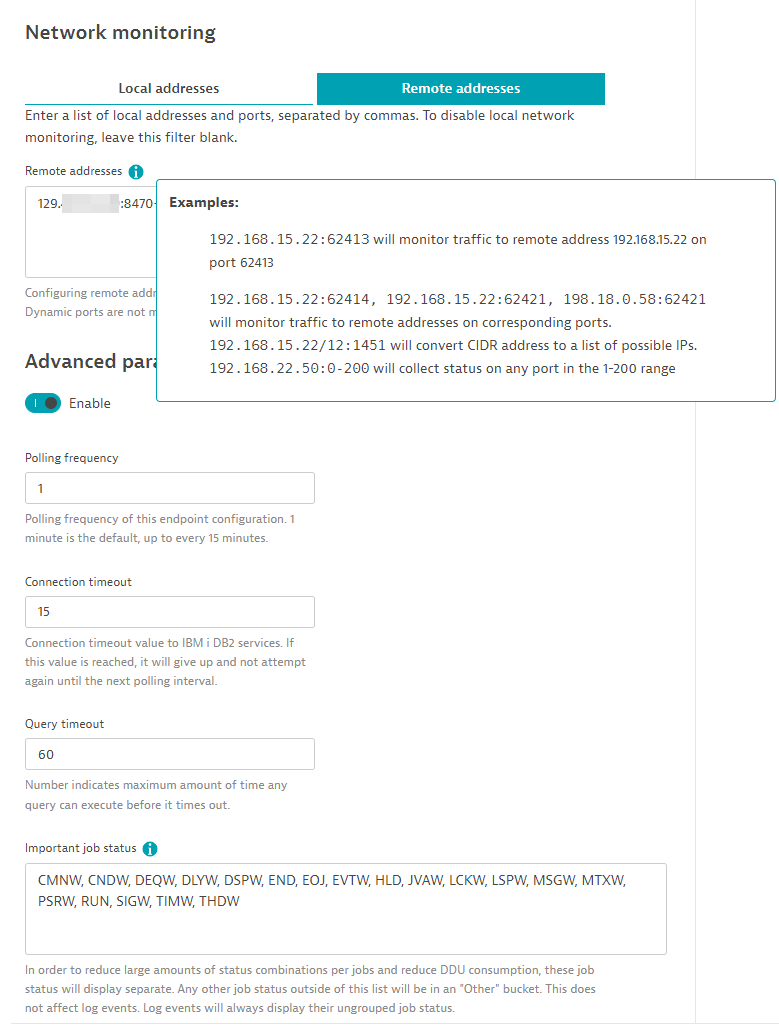
Network monitoring
- Local addresses: Enter a comma-separated list of IP addresses or CIDR addresses and their port numbers. This is useful to see traffic incoming traffic statistics to certain ports.
- Remote addresses: Enter a comma-separated list of IP addresses or CIDR addresses and their port numbers. This is useful to see traffic outgoing traffic statistics to certain ports.
Advanced parameters
- Polling frequency: By default, data is collected every 1 minute but you may configure frequency here. 1 minute data provides most accurate data.
- Connection timeout: Time in seconds before it gives up trying to connect to IBM i Host. This should be fairly quick and should not be beyond 30 seconds.
- Query timeout: Time in seconds before running a query timesout.
- Important job statuses: A list of common job statuses. This list will keep the possible combination of job statuses to a minimum to avoid consuming too many DDUs. Any status not in this list will be placed in an "Other" status bucket. Log events triggered from job statuses will not be impacted by this list and will always match its true status.
- Lastly, select which feature sets (metric groups) you would like this configuration to collect. Selecting too few will not give you the proper visibility and you may miss out on important performance data causing gaps or empty screens.
Compatibility information
- Windows and Linux ActiveGates
- Supported releases:
- IBM i 7.3 Technology Refresh 12+ (must have PTF Group SF99703 Level 28+)
- IBM i 7.4 Technology Refresh 6+ (must have PTF Group SF99704 Level 20+)
- IBM i 7.5
For Linux ActiveGates:
- unixODBC 2.3.12 and higher
FAQ
Q: What is the DDU Consumption of this extension?
A: The formula for DDU consumption of the extension is:
  (15 + (11 * Memory pools) +  (7 * Jobs) +
  (9 * ASPs) +  (12 * Disk unit) + (5 * Job queues) +
  ((3 * Output queues) * (3 * Spooled files)) +
  (1 * Subsystems) + (1 * Network interfaces) +
  (7 * Network connections) + (1 * Message queues) + 1 History Log ) * 525.6 DDUs/year, per Host
The following example assumes you collect all feature sets (metric groups) every minute.
Example, monitoring 1 Host with 4 Memory pools, 5 Subsystems, 1 ASP with 20 Disk units, 10 Job queues, 200 Jobs, 1 Message queue, 3 Interfaces, 5 Network connections, 3 Output queues and each one with 5 spooled files produces the following:
(15 + (11 * 4) + (7 * 200) + (9 * 10) + (12 * 20) + (10 * 5) + ((3 * 3) * (3 * 5)) + (1 *5) + (1 * 3) + (7 * 5) * (1 *1) +1) * 525.6 DDUs/year = 1,061,185 (1M) DDUs/year
DDU cost above does not include any possible Log events or Custom events triggered by the extension. For more information on this, please visit the DDU log event cost and DDU custom event cost pages.
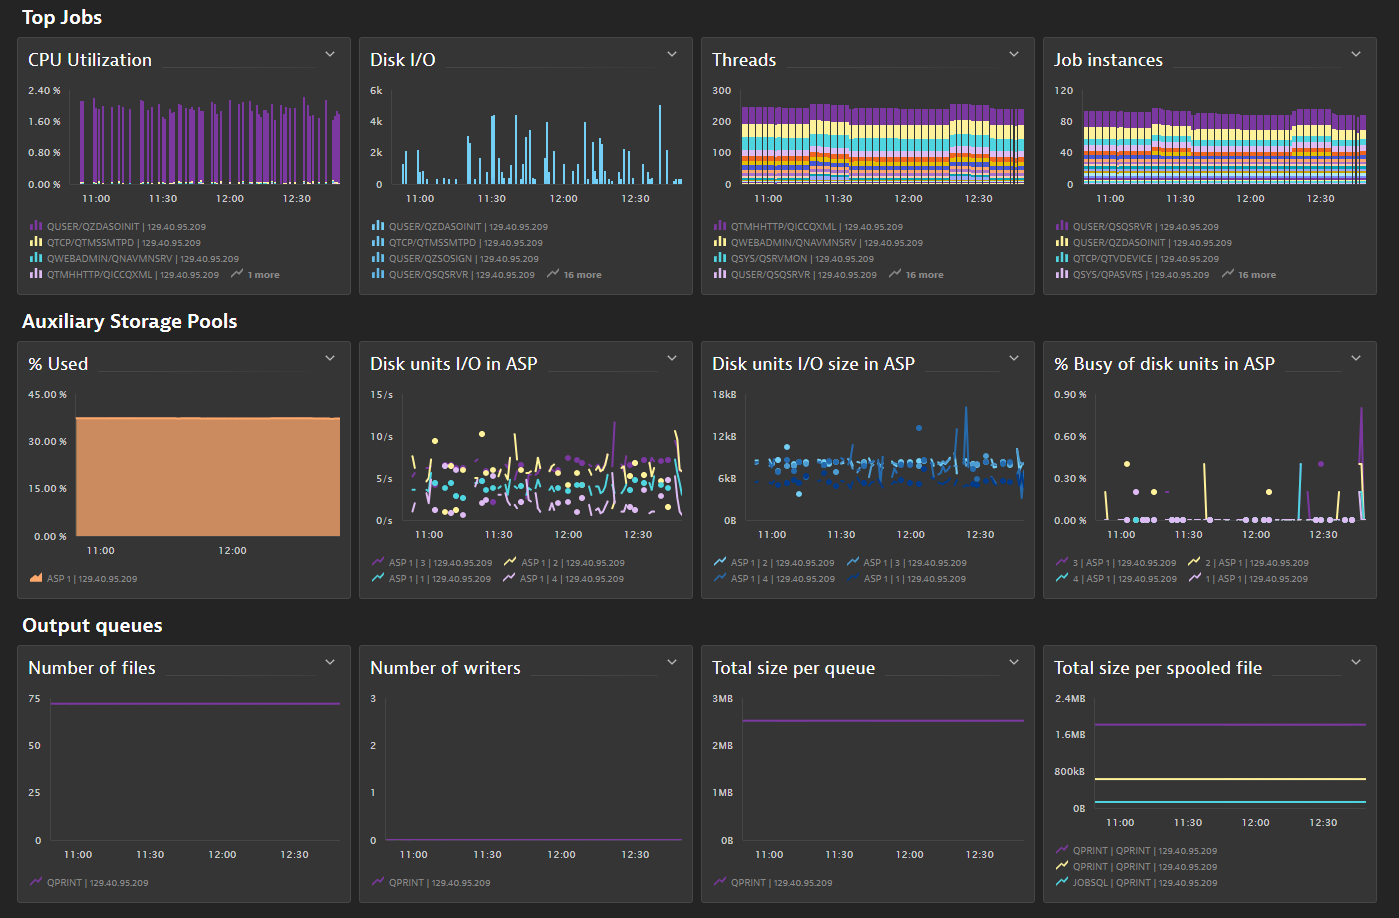
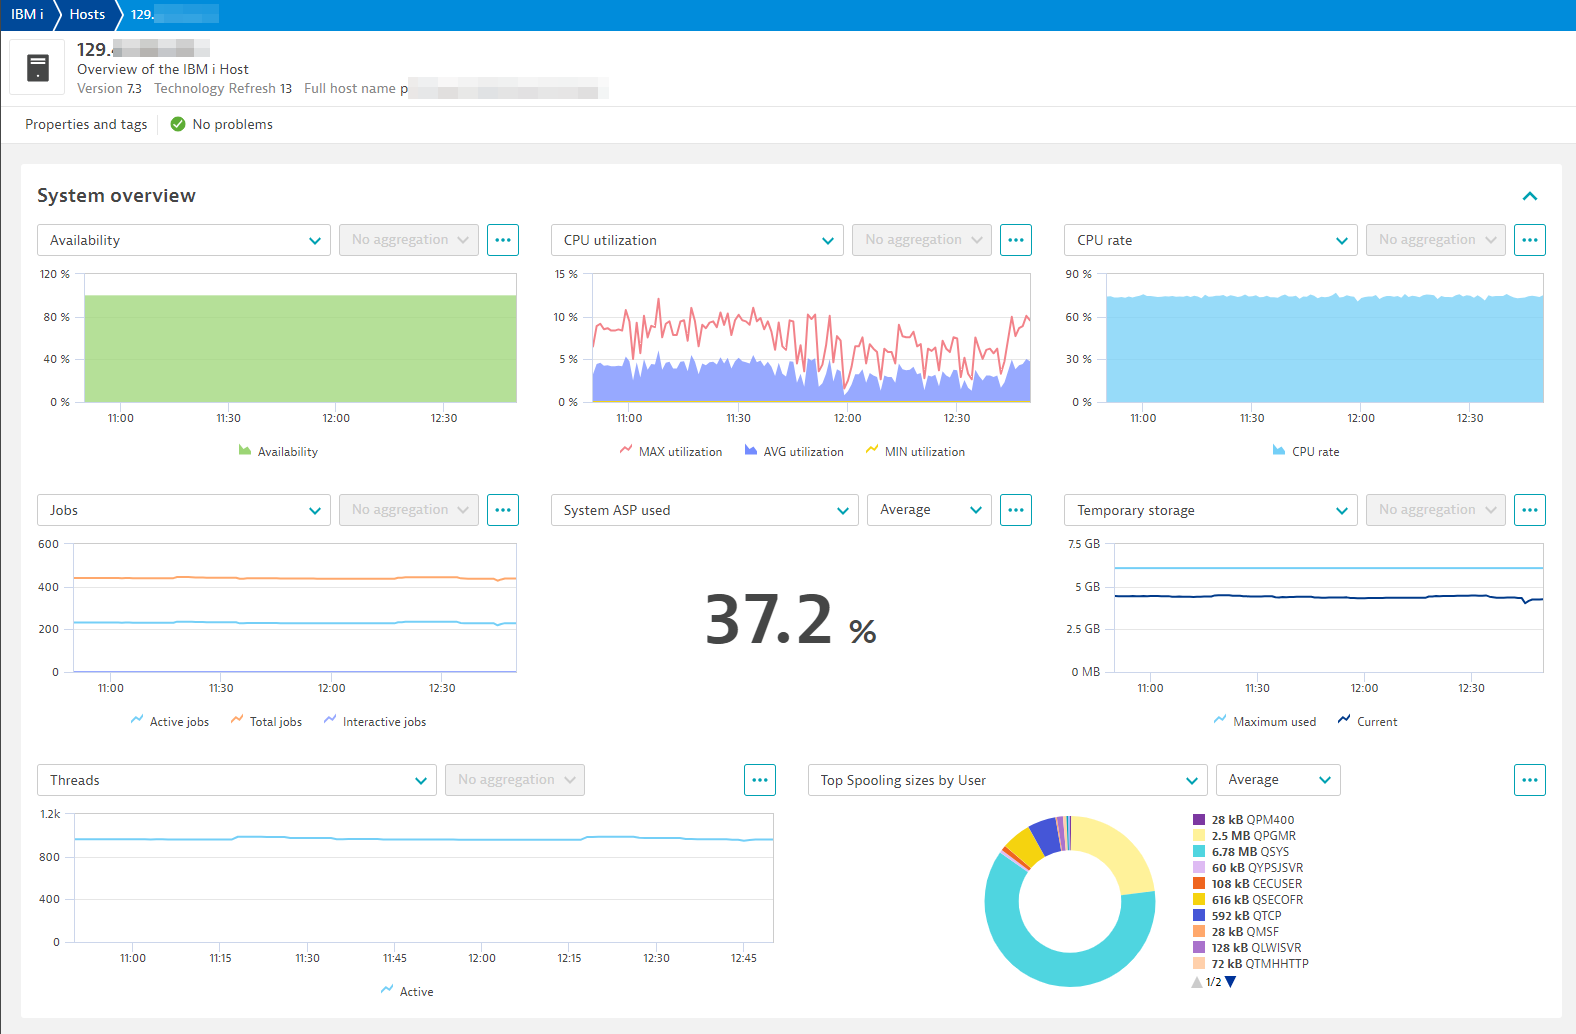
Screenshots
Included dashboards:
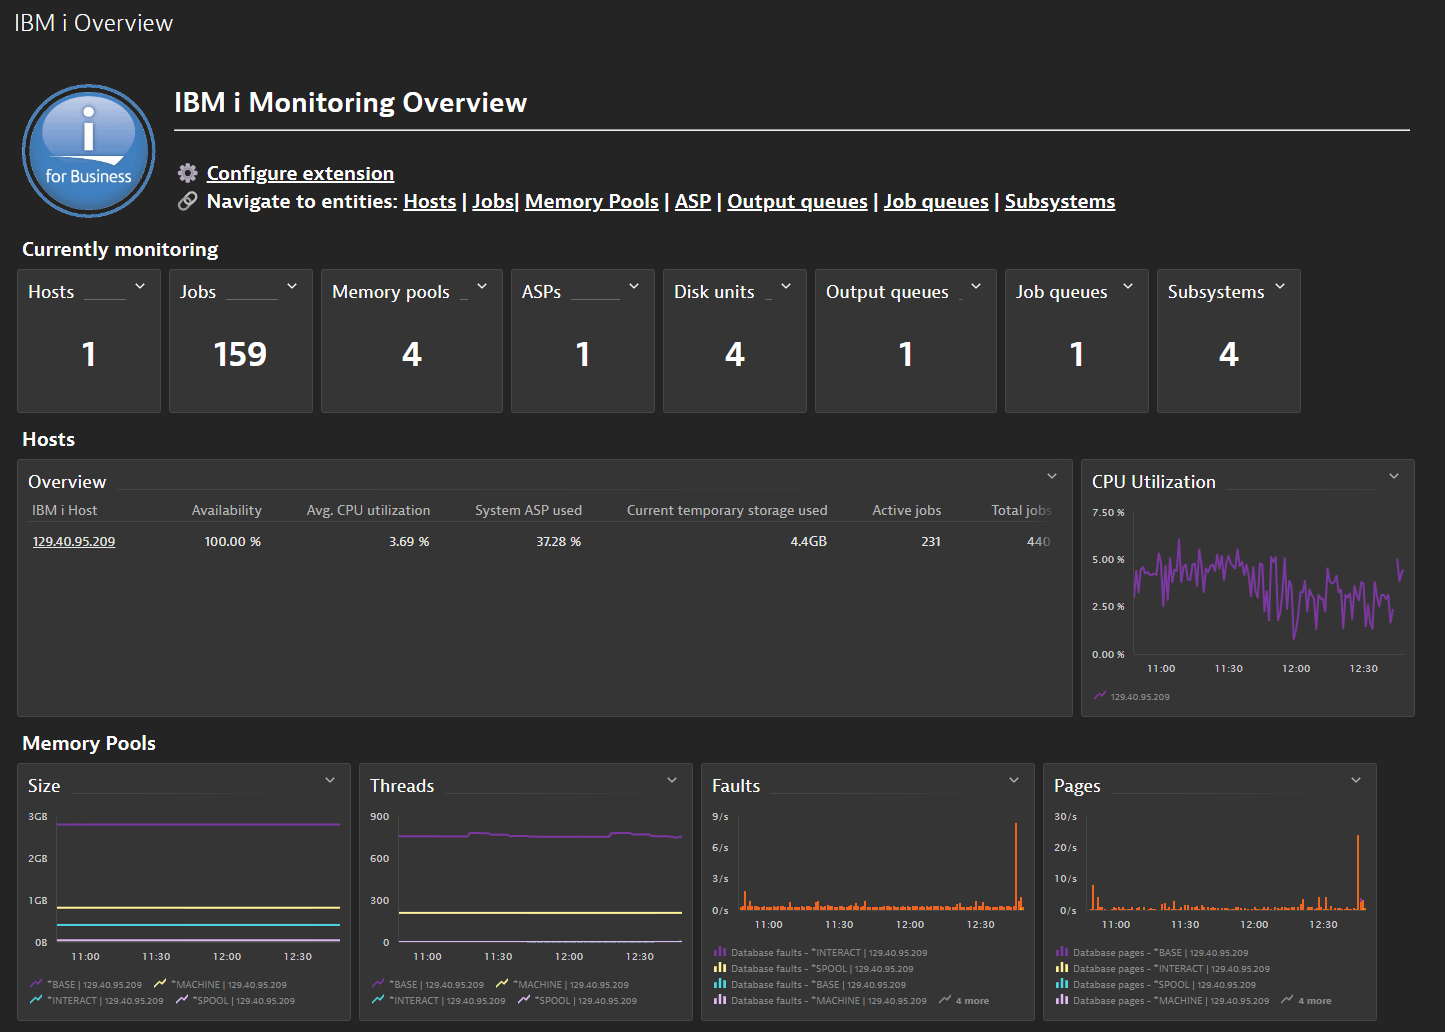
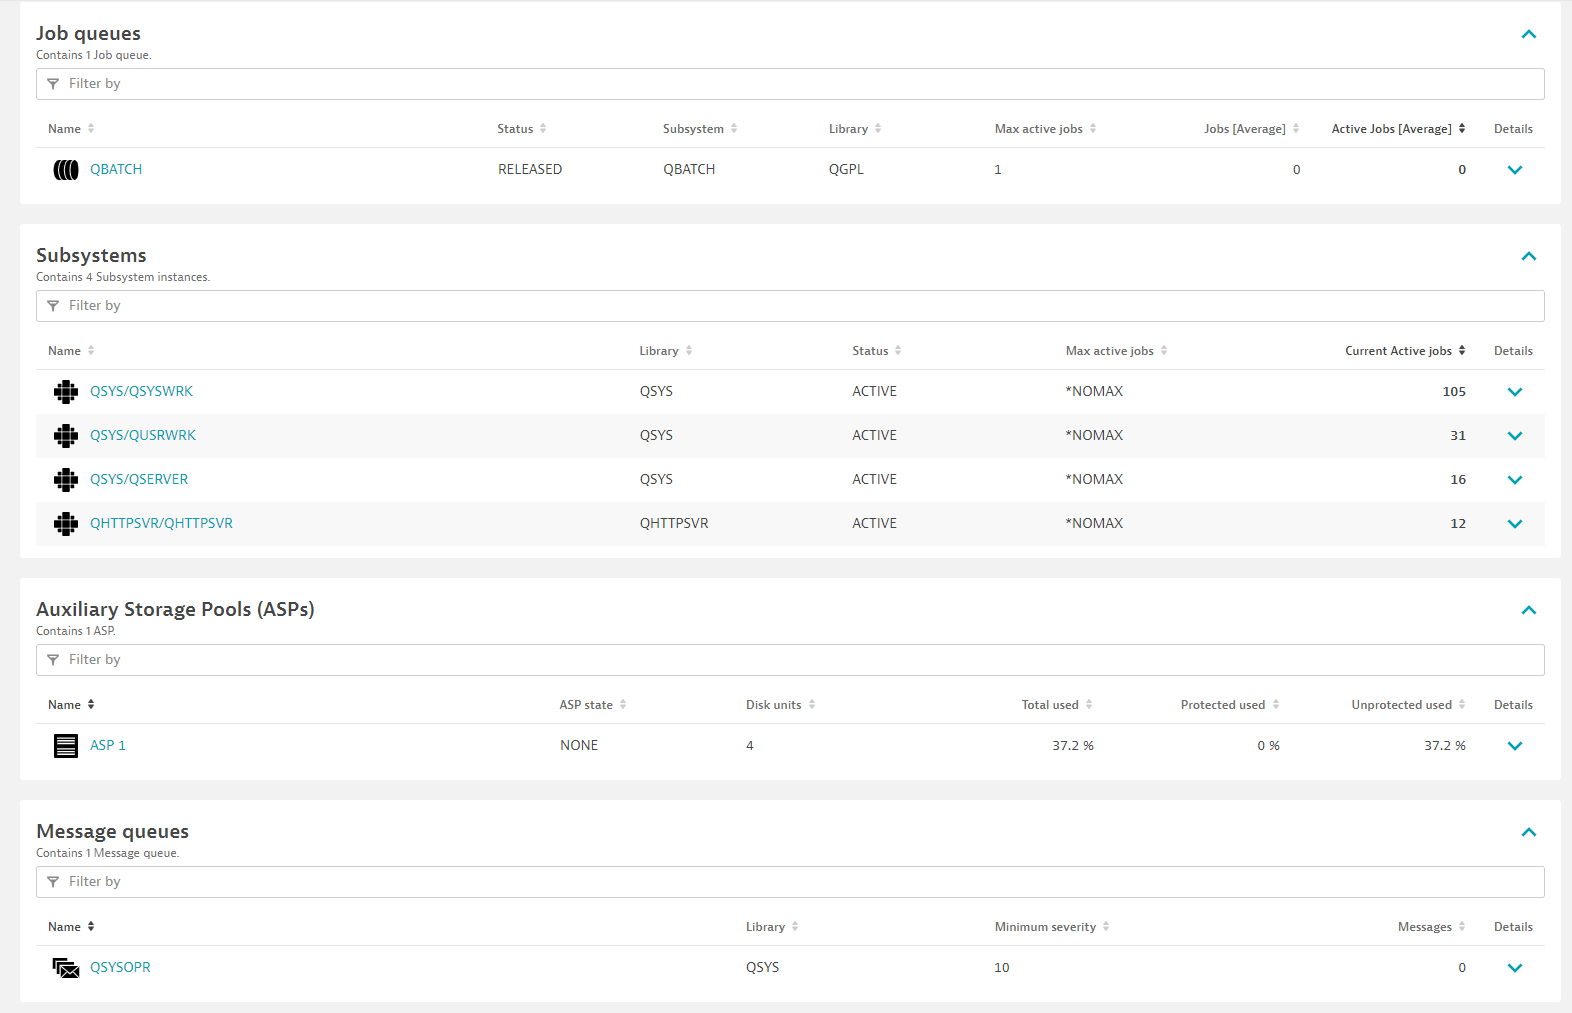
System view
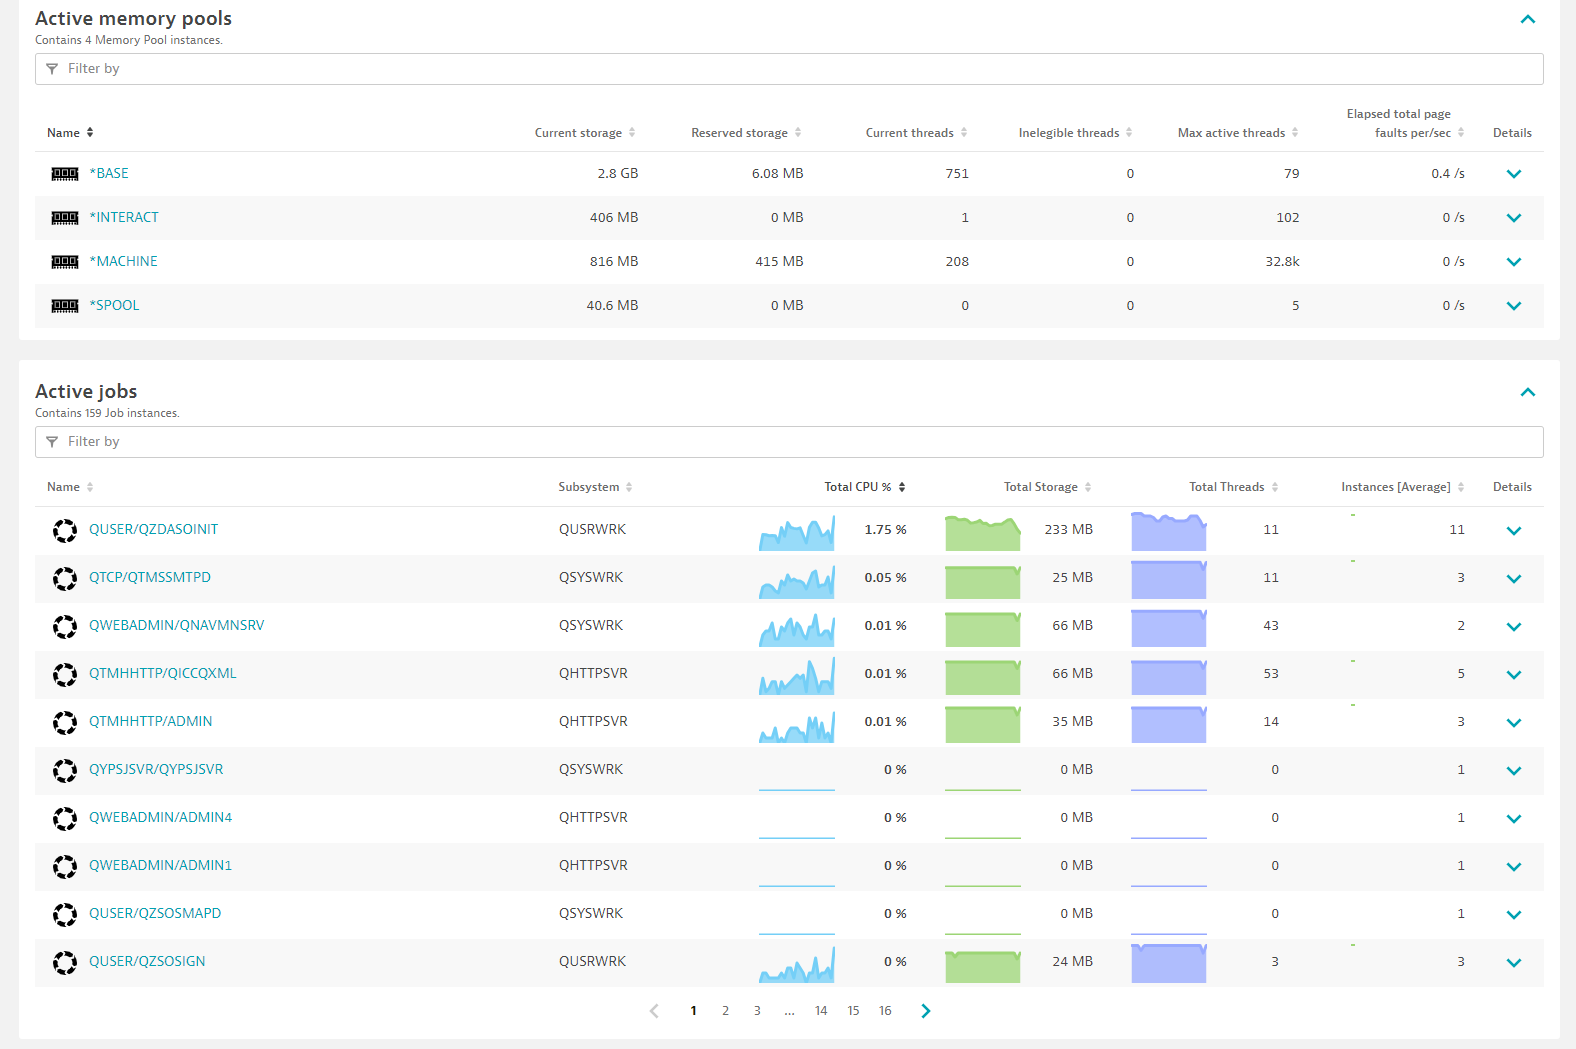
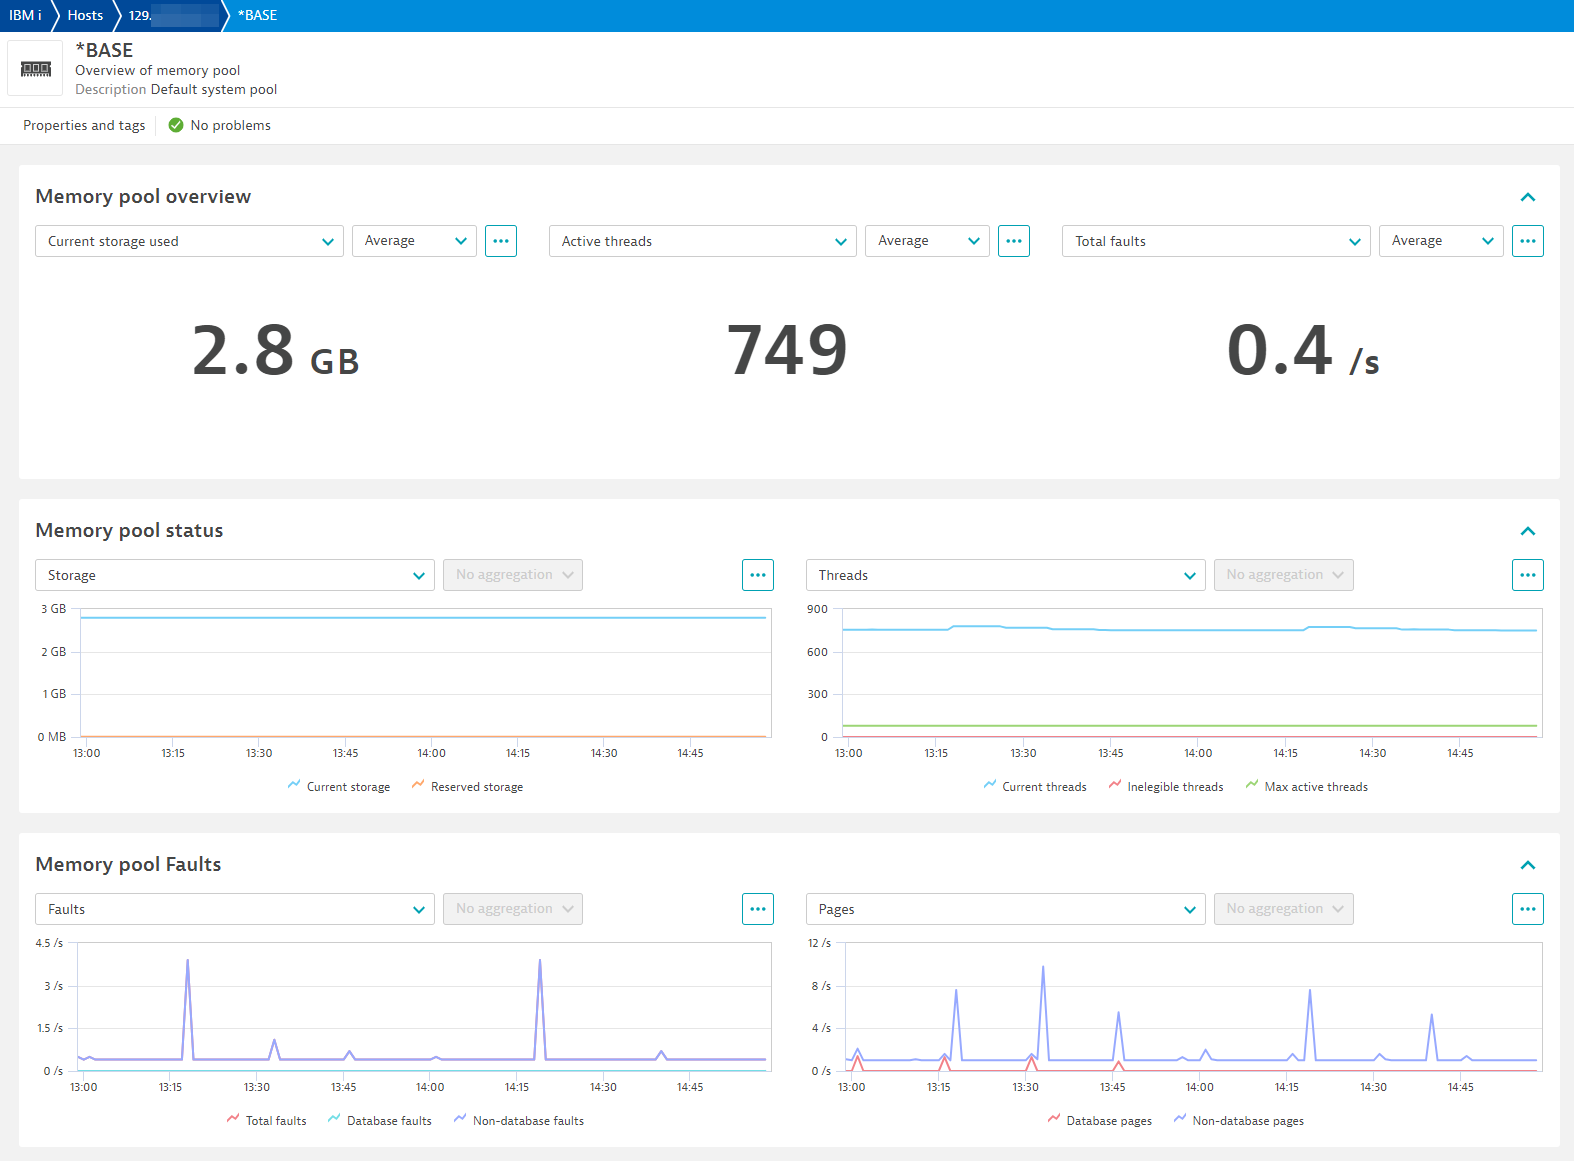
Memory pool
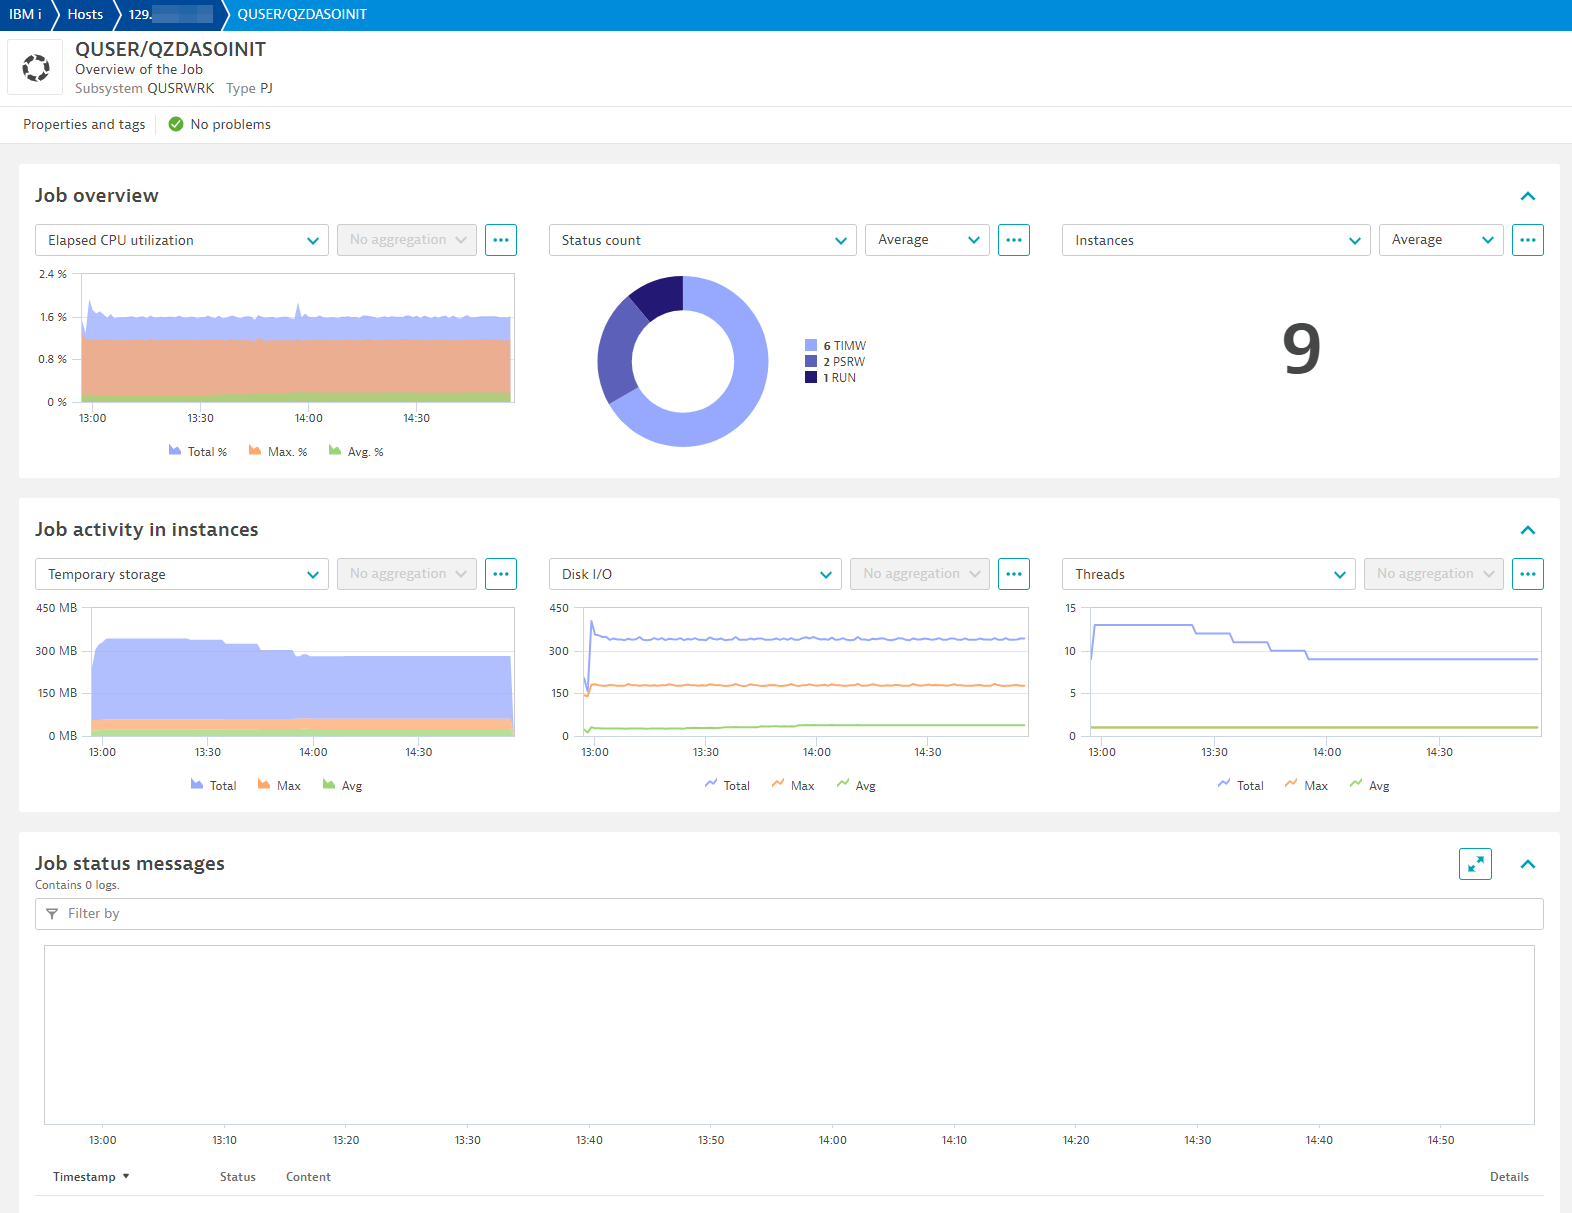
Job view
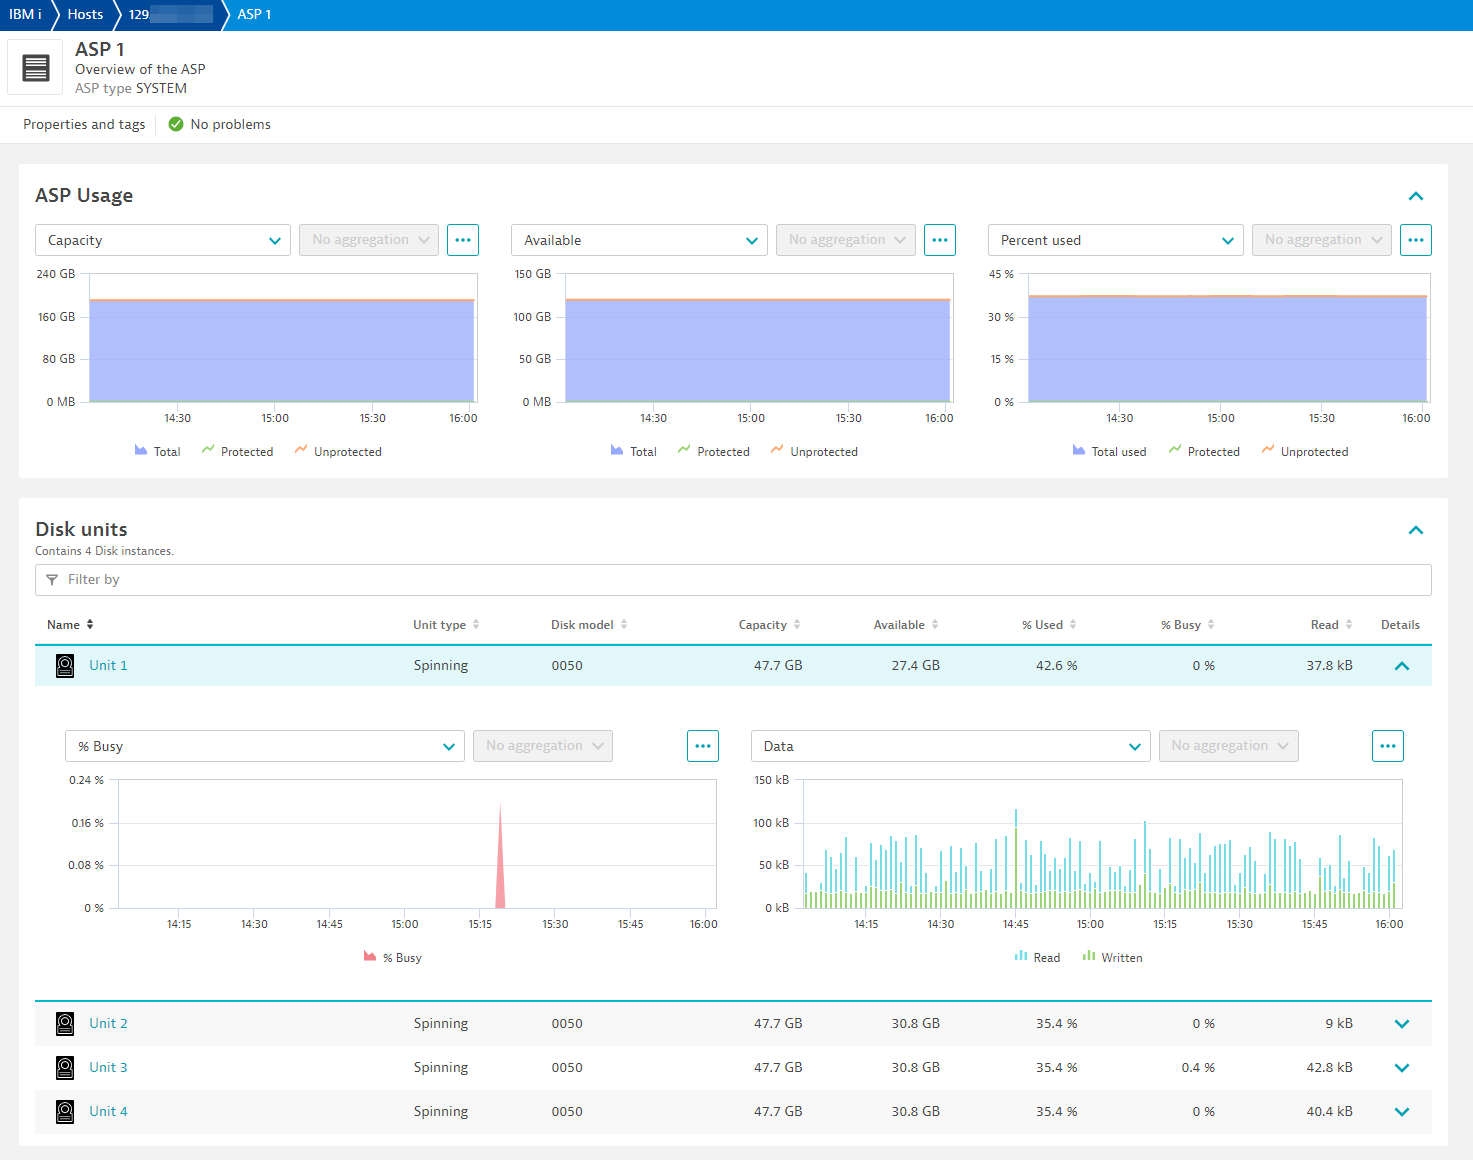
ASP and Disks
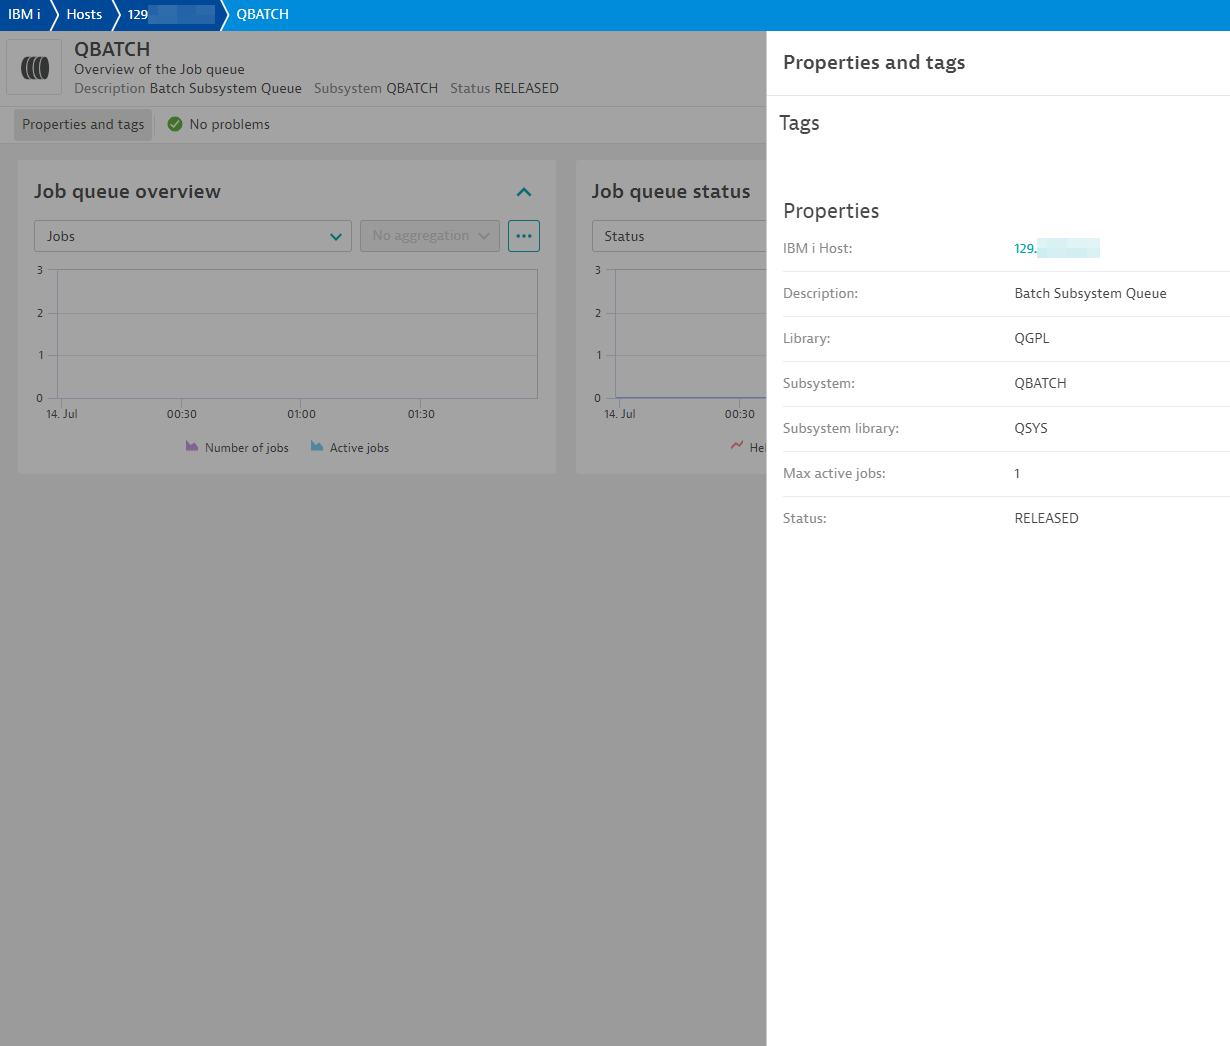
Job queue properties
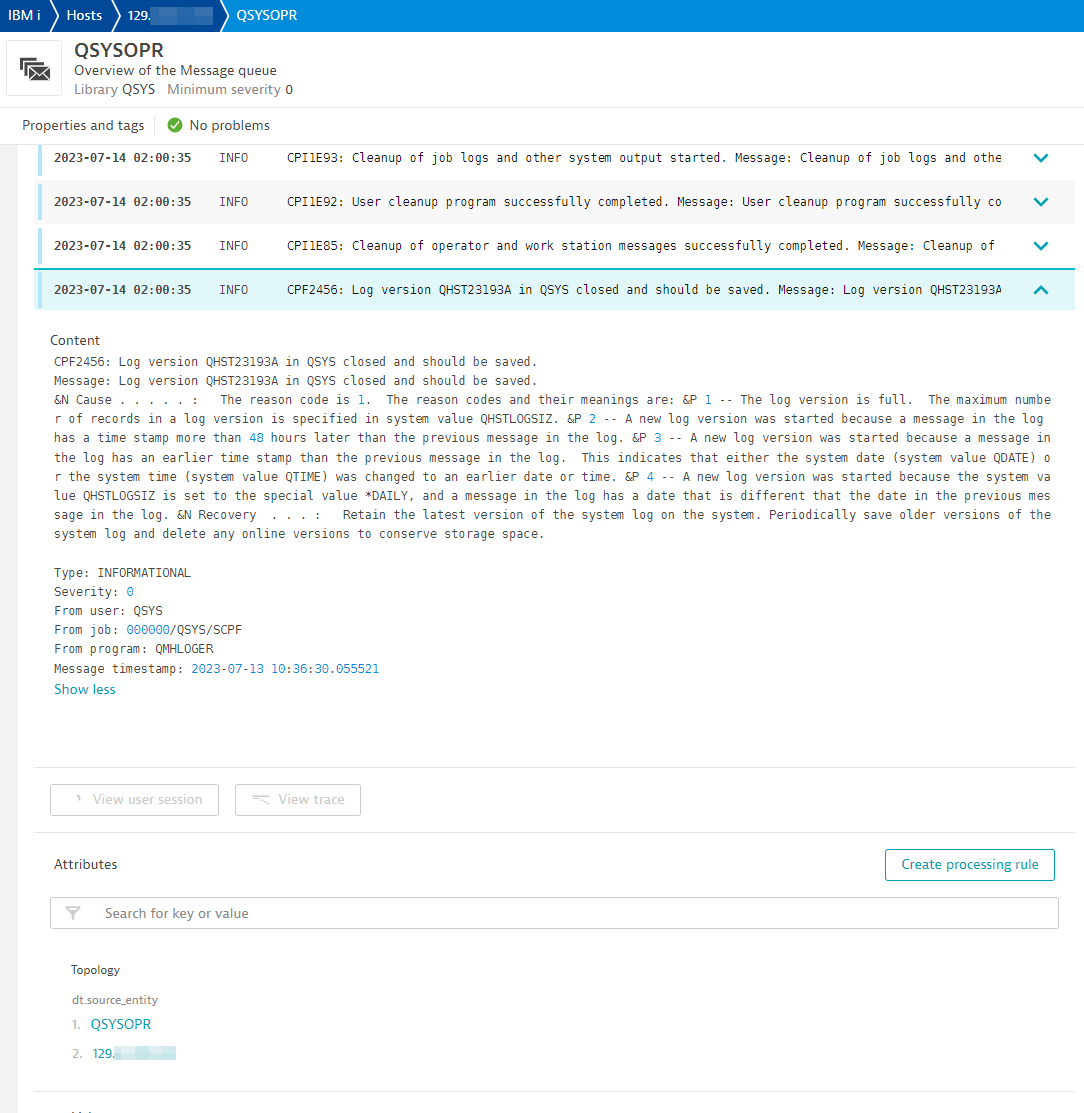
Message queue
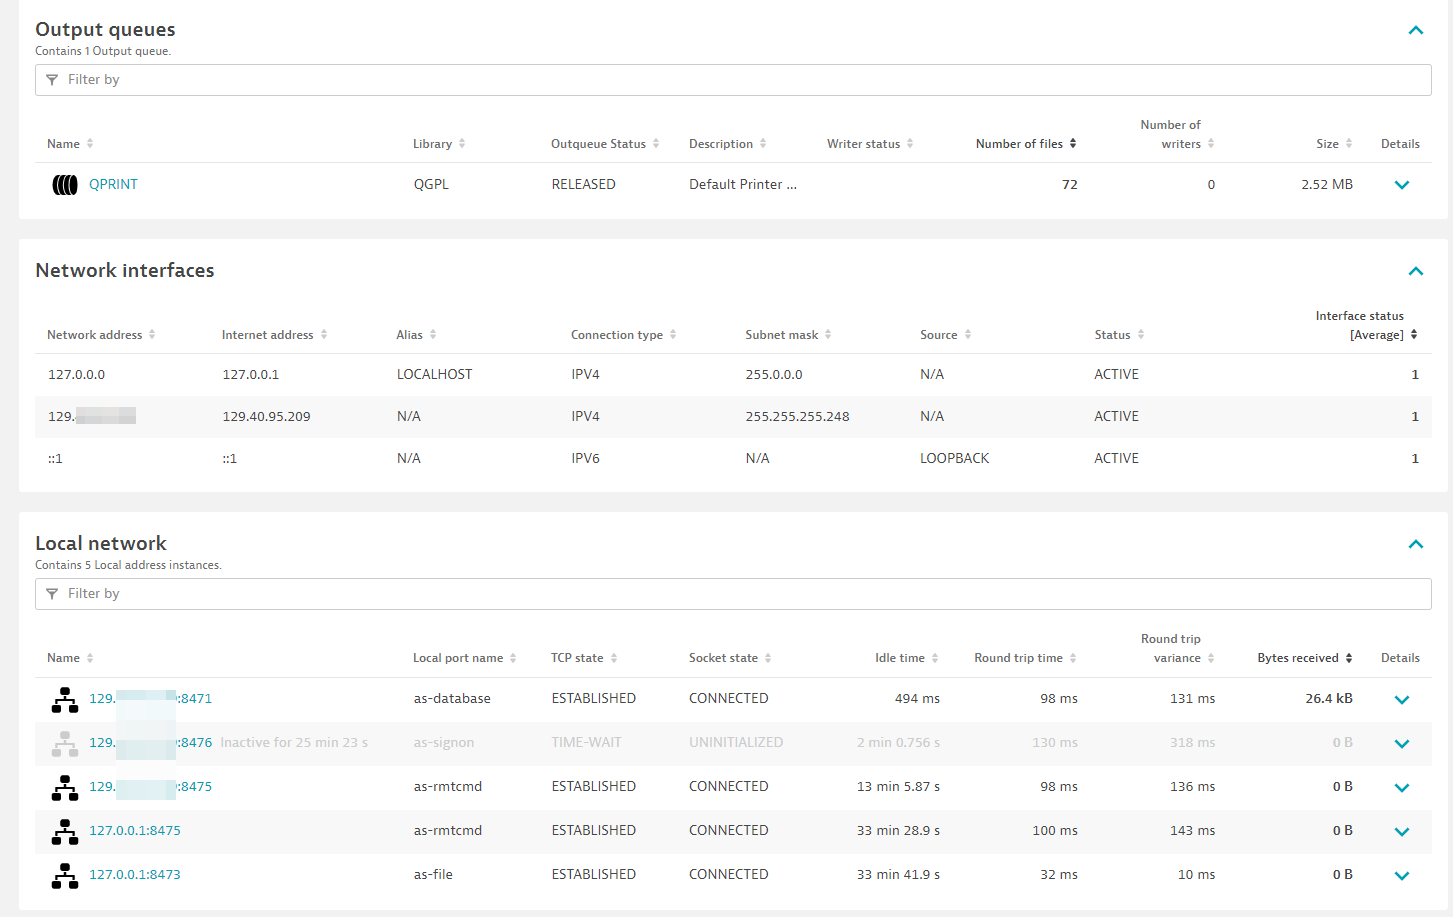
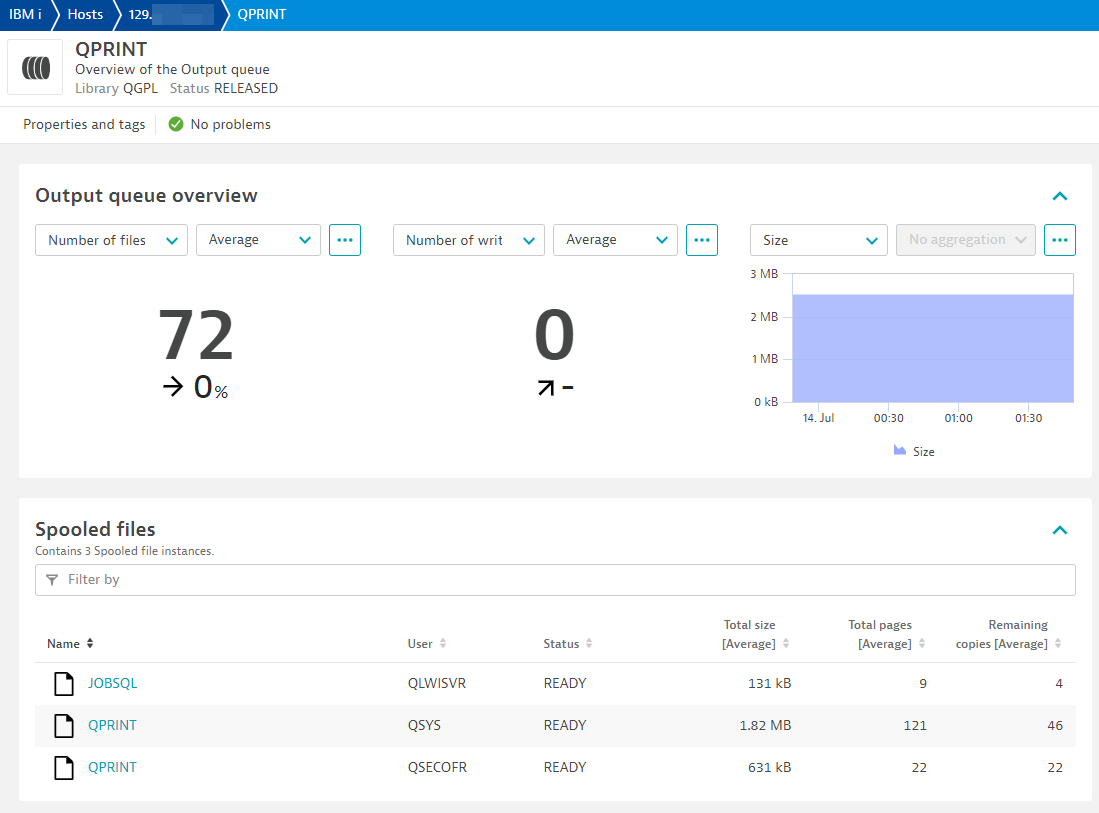
Output queue and spooled files
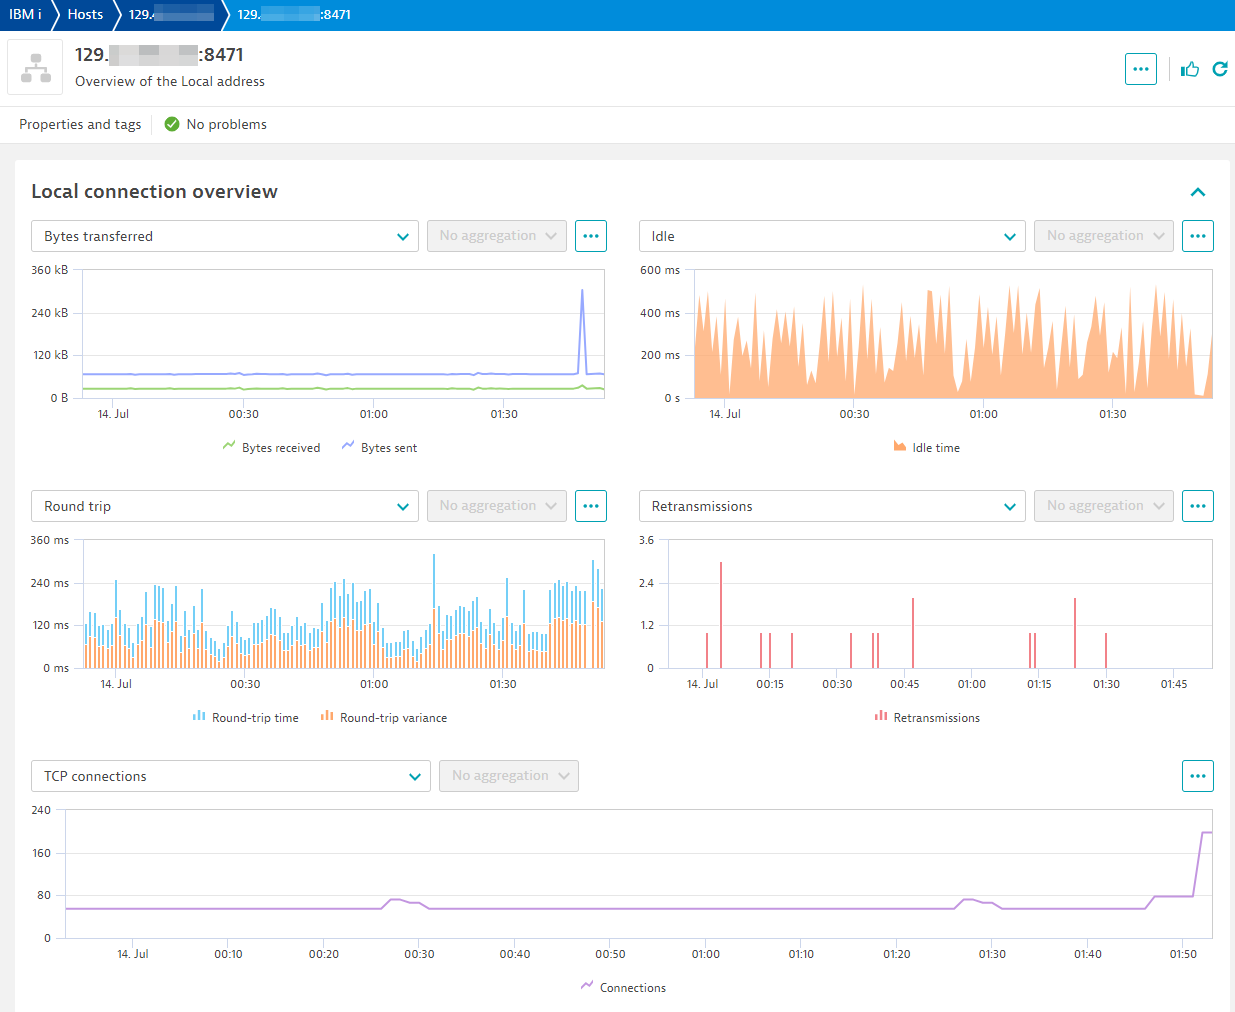
Network
Extension content
Content typeNumber of items included
screen message cards
10
screen logs cards
4
screen entities lists
29
alerts
3
generic relationship
13
screen events cards
1
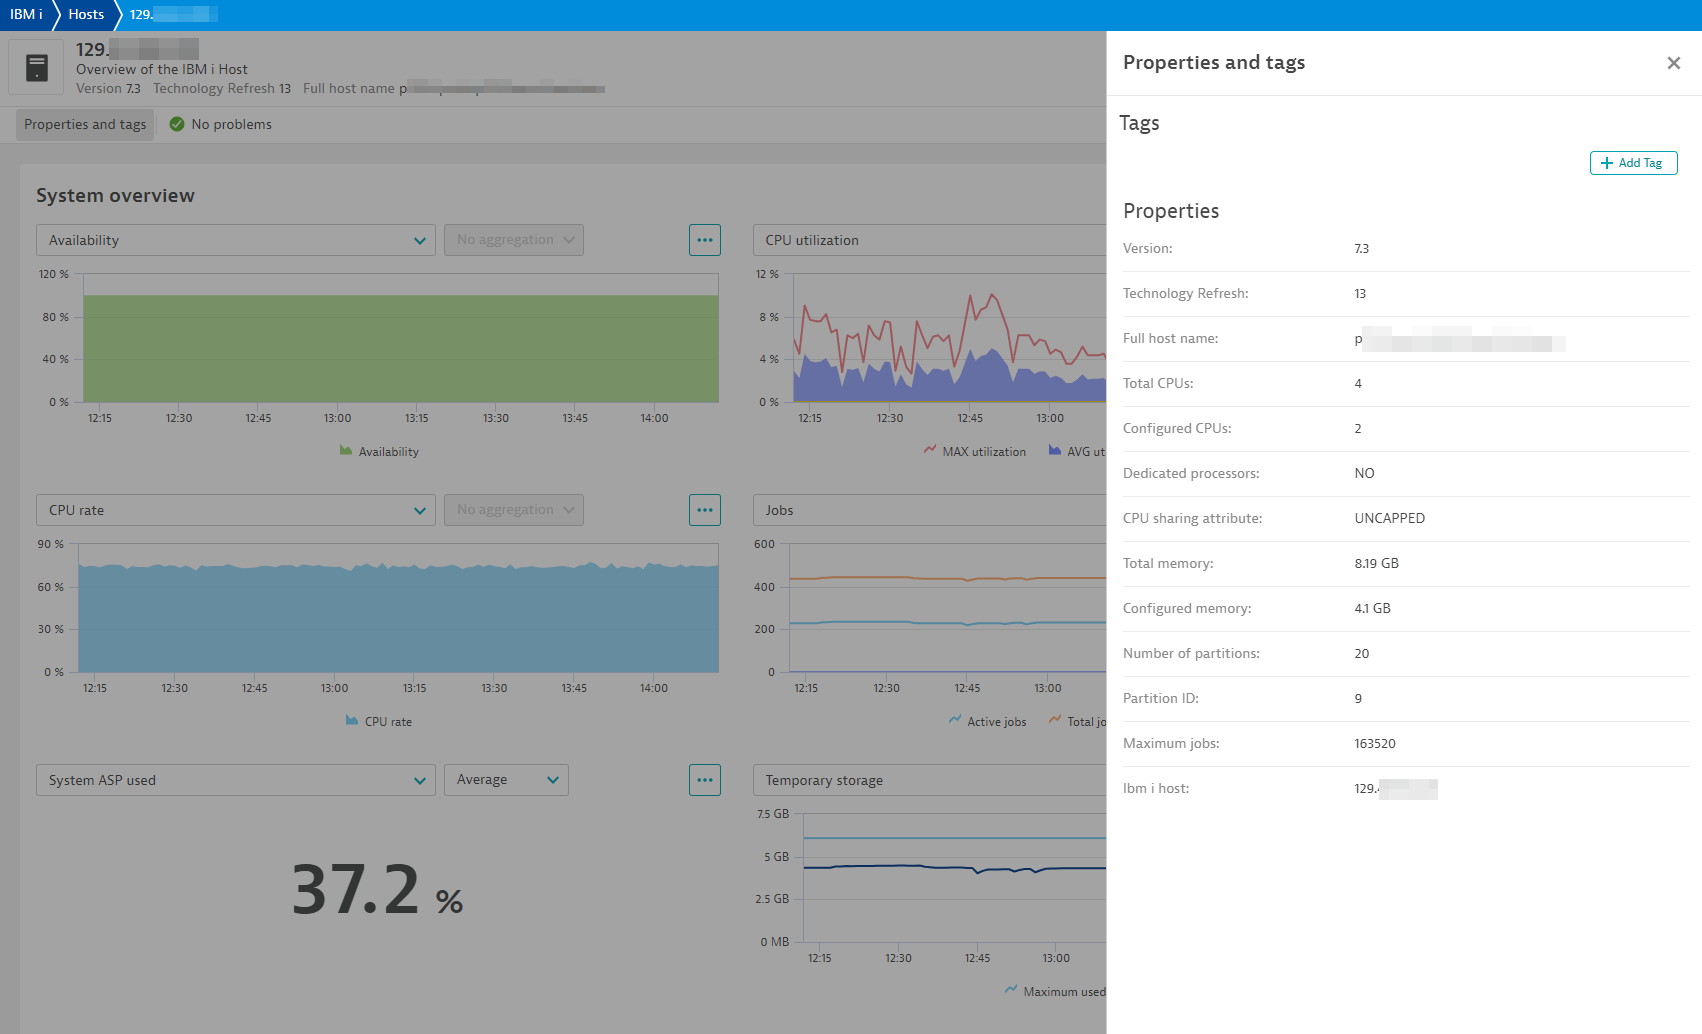
screen properties
13
generic type
14
screen metric tables
1
dashboards
1
screen layout
14
screen chart groups
20
list screen layout
14
metric metadata
77
Feature sets
Below is a complete list of the feature sets provided in this version. To ensure a good fit for your needs, individual feature sets can be activated and deactivated by your administrator during configuration.
Feature setsNumber of metrics included
| Metric name | Metric key | Description | Unit |
|---|---|---|---|
| Unit capacity | ibm_i.disk.unit_storage_capacity | Storage capacity for configured units. | Byte |
| Unit space available | ibm_i.disk.unit_space_available | Space available on the unit for use. | Byte |
| Unit percent used | ibm_i.disk.percent_used | The percentage that the disk unit has been consumed. | Percent |
| SSD power-on days | ibm_i.disk.ssd_power_on_days | The number of days that the SSD device has been active in a system. Contains the null value if this disk is not SSD or if the information is not available. | Count |
| SSD life remaining | ibm_i.disk.ssd_life_remaining | The percentage of the lifetime remaining for the SSD device. This estimates the percentage of usable function remaining for the drive before it should be replaced. Calculations for this percentage include more than just the number of bytes written and supported. Contains the null value if this disk is not SSD or if the information is not available. | Percent |
| I/O requests | ibm_i.disk.io_requests | The average number of I/O requests for read and write operations that occurred per second during the elapsed time. | PerSecond |
| Avg I/O request size | ibm_i.disk.request_size | The average size of an I/O request in KB during the elapsed time. | KiloByte |
| Avg read requests | ibm_i.disk.read_requests | The average number of requests per second to transfer data from the disk unit during the elapsed time. | PerSecond |
| Avg write requests | ibm_i.disk.write_requests | The average number of requests per second to transfer data to the disk unit during the elapsed time. | PerSecond |
| Avg data read | ibm_i.disk.data_read | The average amount of data, in KB, transferred from the disk unit, per request, during the elapsed time. | KiloByte |
| Avg data written | ibm_i.disk.data_written | The average amount of data, in KB, transferred to the disk unit, per request, during the elapsed time. | KiloByte |
| Percent busy | ibm_i.disk.percent_busy | The estimated percentage of time the disk unit is being used during the elapsed time. | Percent |
| Metric name | Metric key | Description | Unit |
|---|---|---|---|
| Interface status | ibm_i.interface.status | A counter of 1 for every network interface that is on host. Used for returning all metadata about an interface. | Unspecified |
| Metric name | Metric key | Description | Unit |
|---|---|---|---|
| Total size | ibm_i.output_queue.total_size | The total size of spooled files in this output queue. | KiloByte |
| Metric name | Metric key | Description | Unit |
|---|---|---|---|
| Total capacity | ibm_i.asp.total_capacity | The total number of used and unused megabytes in the ASP. A special value of -2 is returned if the size of this field is exceeded. Contains the null value if the capacity cannot be determined. | MegaByte |
| Capacity available | ibm_i.asp.total_capacity_available | The total number of unused megabytes in the ASP. A special value of -2 is returned if the value was too big to return. Contains the null value if the capacity cannot be determined. | MegaByte |
| Percent ASP used | ibm_i.asp.percentage_asp_used | Percentage of ASP space used against total capacity. | Percent |
| Protected capacity | ibm_i.asp.protected_capacity | The total number of used and unused megabytes in the ASP that are protected by mirroring or device parity. A special value of -2 is returned if the value was too big to return. Contains the null value if the capacity cannot be determined. | MegaByte |
| Protected capacity available | ibm_i.asp.protected_capacity_available | The number of unused megabytes in the ASP that are protected by mirroring or device parity. A special value of -2 is returned if the value was too big to return. Contains the null value if the capacity cannot be determined. | MegaByte |
| Percent protected ASP used | ibm_i.asp.percentage_protected_asp_used | Percentage of protected ASP space used against protected total capacity. | Percent |
| Unprotected capacity | ibm_i.asp.unprotected_capacity | The total number of used and unused megabytes in the ASP that are not protected by mirroring or device parity. A special value of -2 is returned if the value was too big to return. Contains the null value if the capacity cannot be determined. | MegaByte |
| Unprotected capacity available | ibm_i.asp.unprotected_capacity_available | The number of unused megabytes in the ASP that are not protected by mirroring or device parity. A special value of -2 is returned if the value was too big to return. Contains the null value if the capacity cannot be determined. | MegaByte |
| Unprotected ASP used | ibm_i.asp.percentage_unprotected_asp_used | Percentage of unprotected ASP space used against unprotected total capacity. | Percent |
| Metric name | Metric key | Description | Unit |
|---|---|---|---|
| Current size | ibm_i.memory_pool.current_size | The amount of main storage, in megabytes, in the pool. | MegaByte |
| Reserved size | ibm_i.memory_pool.reserved_size | The amount of storage, in megabytes, in the pool reserved for system use (for example, for save/restore operations). | MegaByte |
| Defined size | ibm_i.memory_pool.defined_size | The size of the pool, in megabytes, as defined in the shared pool, subsystem description, or system value QMCHPOOL. Contains the null value for a pool without a defined size. | MegaByte |
| Max active threads | ibm_i.memory_pool.maximum_active_threads | The maximum number of threads that can be active in the pool at any one time. | Count |
| Current threads | ibm_i.memory_pool.current_threads | The number of threads currently using the pool. | Count |
| Ineligible threads | ibm_i.memory_pool.current_ineligible_threads | The number of ineligible threads in the pool. Ineligible threads are threads that are ready to run but the memory pool activity level is at its maximum. | Count |
| Database faults | ibm_i.memory_pool.database_faults | The rate, in page faults per second, of database page faults against pages containing either database access paths or data. | PerSecond |
| Non-database faults | ibm_i.memory_pool.non_database_faults | The rate, in page faults per second, of nondatabase page faults against pages other than those designated as database pages. | PerSecond |
| Total faults | ibm_i.memory_pool.total_faults | The rate, in page faults per second, of database faults and non-database faults. | PerSecond |
| Database pages | ibm_i.memory_pool.database_pages | The rate, in pages per second, at which database pages are brought into the storage pool. | PerSecond |
| Non-database pages | ibm_i.memory_pool.non_database_pages | The rate in pages per second at which nondatabase pages are brought into the storage pool. | PerSecond |
| Metric name | Metric key | Description | Unit |
|---|---|---|---|
| Total size | ibm_i.spooling.total_size | Sum size of all spooled files by user. | KiloByte |
| Metric name | Metric key | Description | Unit |
|---|---|---|---|
| Matched messages | ibm_i.message_queue.matched_messages | Number of messages that are in queue that match severity, message IDs and message types (if configured). | Count |
| Metric name | Metric key | Description | Unit |
|---|---|---|---|
| Total size | ibm_i.output_queue.spooled_file.total_size | The size of the spooled file. | Byte |
| Total pages | ibm_i.output_queue.spooled_file.total_pages | The total number of pages in the file. | Count |
| Remaining copies | ibm_i.output_queue.spooled_file.total_remaining_copies | The number of copies remaining to print. | Count |
| Metric name | Metric key | Description | Unit |
|---|---|---|---|
| Active jobs | ibm_i.subsystem.current_active_jobs | The number of jobs currently active in the subsystem. This number includes held jobs but excludes jobs that are disconnected or suspended because of a transfer secondary job or a transfer group job. If STATUS is INACTIVE, returns 0. | Count |
| Metric name | Metric key | Description | Unit |
|---|---|---|---|
| CPU rate | ibm_i.system.cpu_rate | The average CPU rate expressed as a percentage where 100% indicates the processor is running at its nominal frequency. A value above or below 100% indicates how much the processor has been slowed down (throttled) or speeded up (turbo) relative to the nominal frequency for the processor model. | Percent |
| Avg. CPU utilization | ibm_i.system.avg_cpu_utilization | The average CPU utilization for all the active processors in 15 seconds elapsed time. | Percent |
| Min. CPU utilization | ibm_i.system.min_cpu_utilization | The CPU utilization of the processor that reported the minimum amount of CPU utilization in 15 seconds elapsed time. | Percent |
| Max. CPU utilization | ibm_i.system.max_cpu_utilization | The CPU utilization of the processor that reported the maximum amount of CPU utilization in 15 seconds elapsed time. | Percent |
| Metric name | Metric key | Description | Unit |
|---|---|---|---|
| Total jobs | ibm_i.system.total_jobs | The total number of user and system jobs that are currently in the system. | Count |
| Active jobs | ibm_i.system.active_jobs | The number of jobs active in the system (jobs that have been started, but have not yet ended), including both user and system jobs. | Count |
| Percentage total jobs | ibm_i.system.percentage_total_jobs | The percentage of current total jobs over maximum jobs allowed. | Percent |
| % Interactive performance | ibm_i.system.interactive_jobs | The percentage of interactive performance assigned to this logical partition. This value is a percentage of the total interactive performance available to the entire physical system. | Percent |
| System ASP used | ibm_i.system.system_asp_used | The percentage of the system storage pool (ASP number 1) currently in use. | Percent |
| Maximum temporary storage used | ibm_i.system.maximum_temporary_storage_used | The largest amount of storage, in megabytes, used for temporary objects at any one time since the last IPL. | MegaByte |
| Current temporary storage used | ibm_i.system.current_temporary_storage | The current amount of storage, in megabytes, in use for temporary objects. | MegaByte |
| Active threads | ibm_i.system.active_threads | The number of initial and secondary threads in the system (threads that have been started, but have not yet ended), including both user and system threads. | Count |
| Metric name | Metric key | Description | Unit |
|---|---|---|---|
| Idle time | ibm_i.network.idle_time | The length of time, in seconds, since the last activity on this connection. | Second |
| Bytes sent | ibm_i.network.bytes_sent_count | The number of bytes sent to the remote host. | Byte |
| Bytes received | ibm_i.network.bytes_received_count | The number of bytes received from the remote host. | Byte |
| Round trip time | ibm_i.network.round_trip_time | The smoothed round-trip time interval in milliseconds. This is a measure of the time required for a segment on the connection to arrive at its destination, to be processed, and to return an acknowledgment to the client. Contains null if PROTOCOL is UDP. | MilliSecond |
| Round trip variance | ibm_i.network.round_trip_variance | The variance in milliseconds from the previous round-trip time. Contains null if PROTOCOL is UDP | MilliSecond |
| Retransmissions | ibm_i.network.retransmissions_count | The number of times the local system retransmitted a segment because an acknowledgement was not received. This is a count of all segments resent during the entire time the connection has been active. Contains null if PROTOCOL is UDP. | Count |
| TCP connections established | ibm_i.network.tcp_connections_currently_established | The number of TCP connections for which the current state is either ESTABLISHED or CLOSE-WAIT. Contains null if PROTOCOL is UDP. | Count |
| Metric name | Metric key | Description | Unit |
|---|---|---|---|
| Threads | ibm_i.job.threads_cnt | The number of active threads in the job. | Count |
| Temporary storage | ibm_i.job.temporary_storage_used | The amount of temporary storage, in megabytes, that is currently allocated to this job. | MegaByte |
| Total disk I/O | ibm_i.job.disk_io | The number of disk I/O operations performed by the job during the measurement time interval. This is the sum of the asynchronous and synchronous disk I/O. | Count |
| CPU percentage | ibm_i.job.cpu_percentage | The percent of processing unit time attributed to this job during the measurement time interval. | Percent |
| Response time | ibm_i.job.response_time | The total response time over the measurement time interval, in seconds. ONLY available to interactive jobs. | Second |
| Instances | ibm_i.job.instances | Number of job instances (or job numbers) running under a user and job name. This number can indicate if too few instances or too many instances are running for a specific process. | Count |
| Status count | ibm_i.job.status_cnt | A count of job status for each job. This will visualize how many job instances are in different status. If an event for status was configured to trigger during endpoint configuration, event will contain the specific job number. | Count |
| Metric name | Metric key | Description | Unit |
|---|---|---|---|
| Availability | ibm_i.system.availability | Percentage of time this host was available or reachable from this extension | Percent |
| Metric name | Metric key | Description | Unit |
|---|---|---|---|
| Number of jobs | ibm_i.job_queue.number_of_jobs | The number of jobs in the queue. | Count |
| Active jobs | ibm_i.job_queue.active_jobs | The current number of jobs that are active that came through this job queue entry. Contains the null value if this job queue is not associated with an active subsystem | Count |
| Held jobs | ibm_i.job_queue.held_jobs | The current number of jobs that are in *HELD status. | Count |
| Released jobs | ibm_i.job_queue.released_jobs | The current number of jobs that are in *RELEASED status. | Count |
| Scheduled jobs | ibm_i.job_queue.scheduled_jobs | The current number of jobs that are in *SCHEDULED status. | Count |
| Metric name | Metric key | Description | Unit |
|---|---|---|---|
| Number of files | ibm_i.output_queue.number_of_files | The total number of spooled or printer files currently on this output queue. | Count |
| Number of writers | ibm_i.output_queue.number_of_writers | The number of printer writers that have been started to this output queue. | Count |
| Total size | ibm_i.output_queue.total_size | The total size of spooled files in this output queue. | KiloByte |
| Metric name | Metric key | Description | Unit |
|---|---|---|---|
| Matched messages | ibm_i.history_log.matched_messages | Number of messages in History log that matched severity, message IDs and message types (if configured). | Count |
Full version history
To have more information on how to install the downloaded package, please follow the instructions on this page.
ReleaseDate
Full version history
- Resolved issue where restarts were occurring due to No KeepAlive errors.
Full version history
- Fixed issue with initial version check
- Fixed issue with Message Queues not collecting data when not sending lot events
Full version history
⚠️New entities for Jobs will be created as internal IDs have changed. They will have the same name so any alerting rules you previously created will continue to work just fine. However, you may see duplicate job entities for a few hours. ⚠️
- History Log has been added.
- Output queue size metric has been moved to its own feature set. If you are interested in this metric, please be sure to select it in your feature sets.
Full version history
- Adjusted Job metric aggregations.
- Modified CPTimeout check parameter for Linux deployments.
Full version history
- Added extra fields to log events.
- Adjusted disk metric aggregations
Full version history
- Resolved issue with only one message queue reporting events.
- Resolved issue with jobs failing to retrieve when a custom subsystem was entered.
- Updated out-of-the-box dashboard to remove limit of Hosts listed.
Full version history
- Resolved issue with CPU metric not always reporting.
Full version history
- Added support for Linux ActiveGates
- Added management zone support to metrics.
- Various UI enhancements and metadata
Full version history
- Increased Message IDs field filter
Full version history
- Added Percentage of Total Jobs over Max Jobs metric
- Added More metadata to log events
- Changes to UI to reflect above changes.
Full version history
- Fix to response time metric
Full version history
- Added EEC version check
Full version history
- New framework 2.0
- New look and feel
- More metrics and metadata