


Skip to technology filters Skip to main content
Dynatrace Hub

Extend the platform,
empower your team.

Popular searches:
Home hero bg
ExtensionsExtensions
Extensions

Extensions

Manage Dynatrace extensions for hundreds of technologies.

App
Try in PlaygroundDocumentation
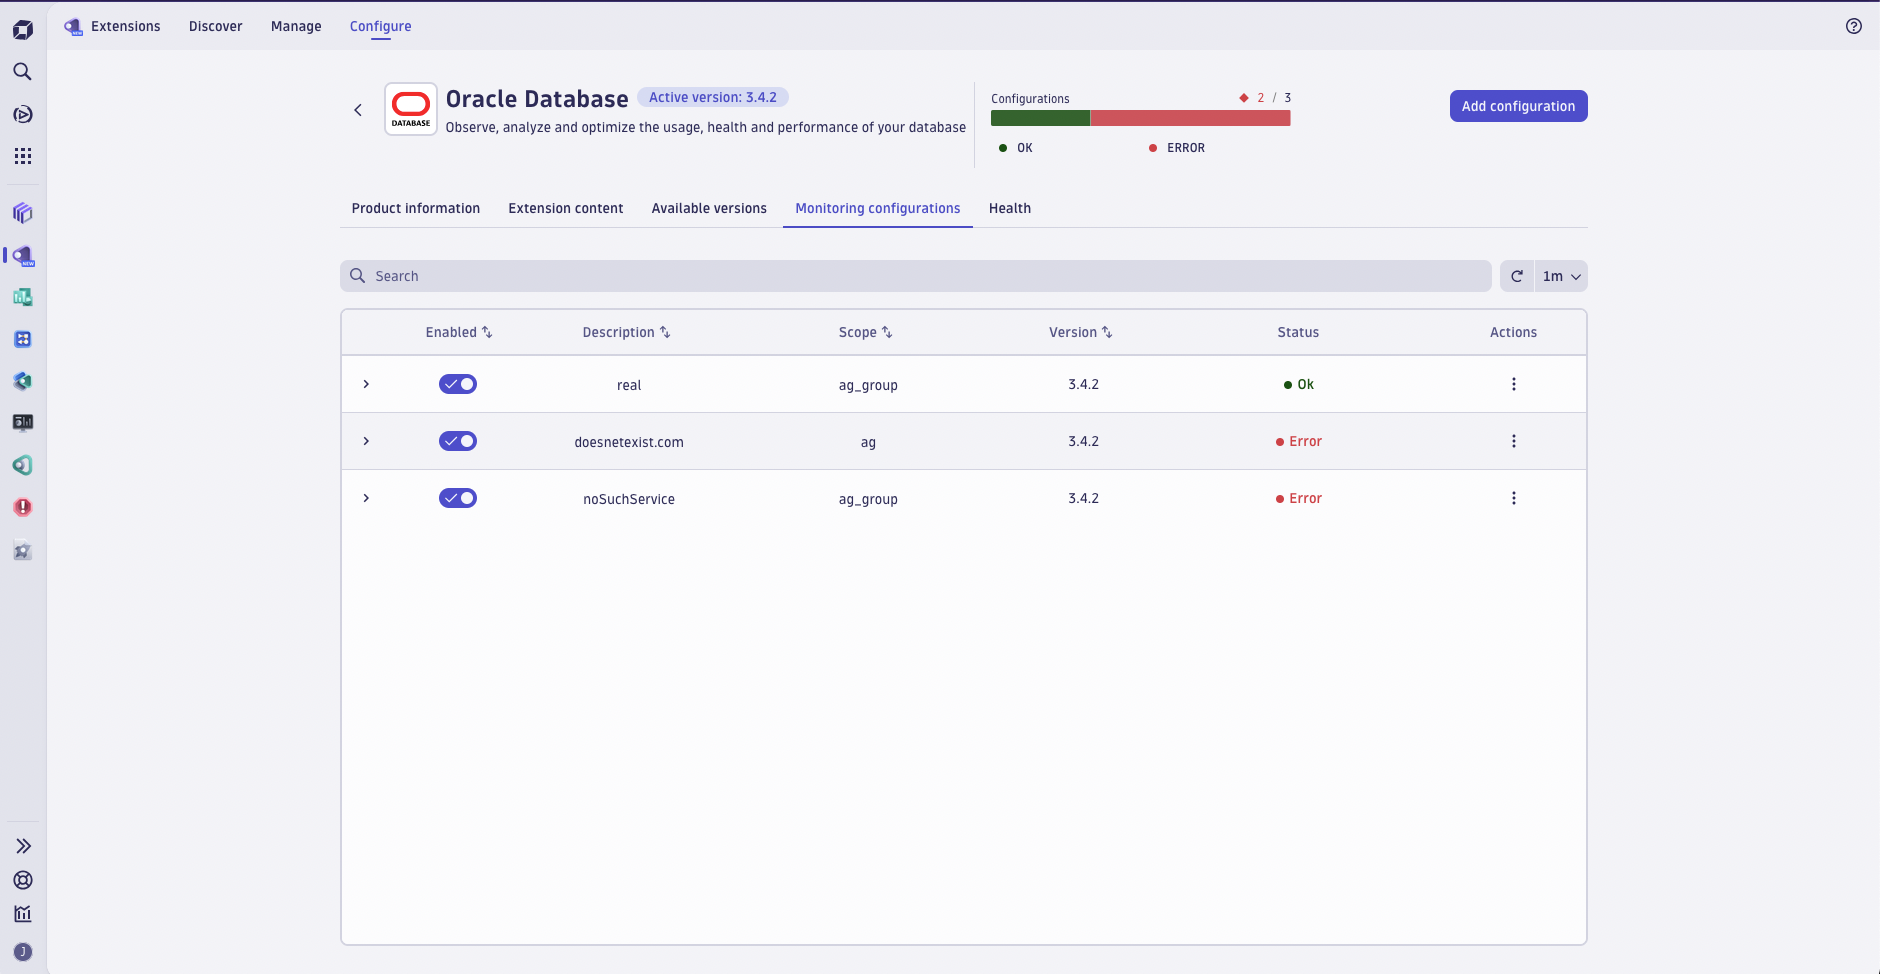
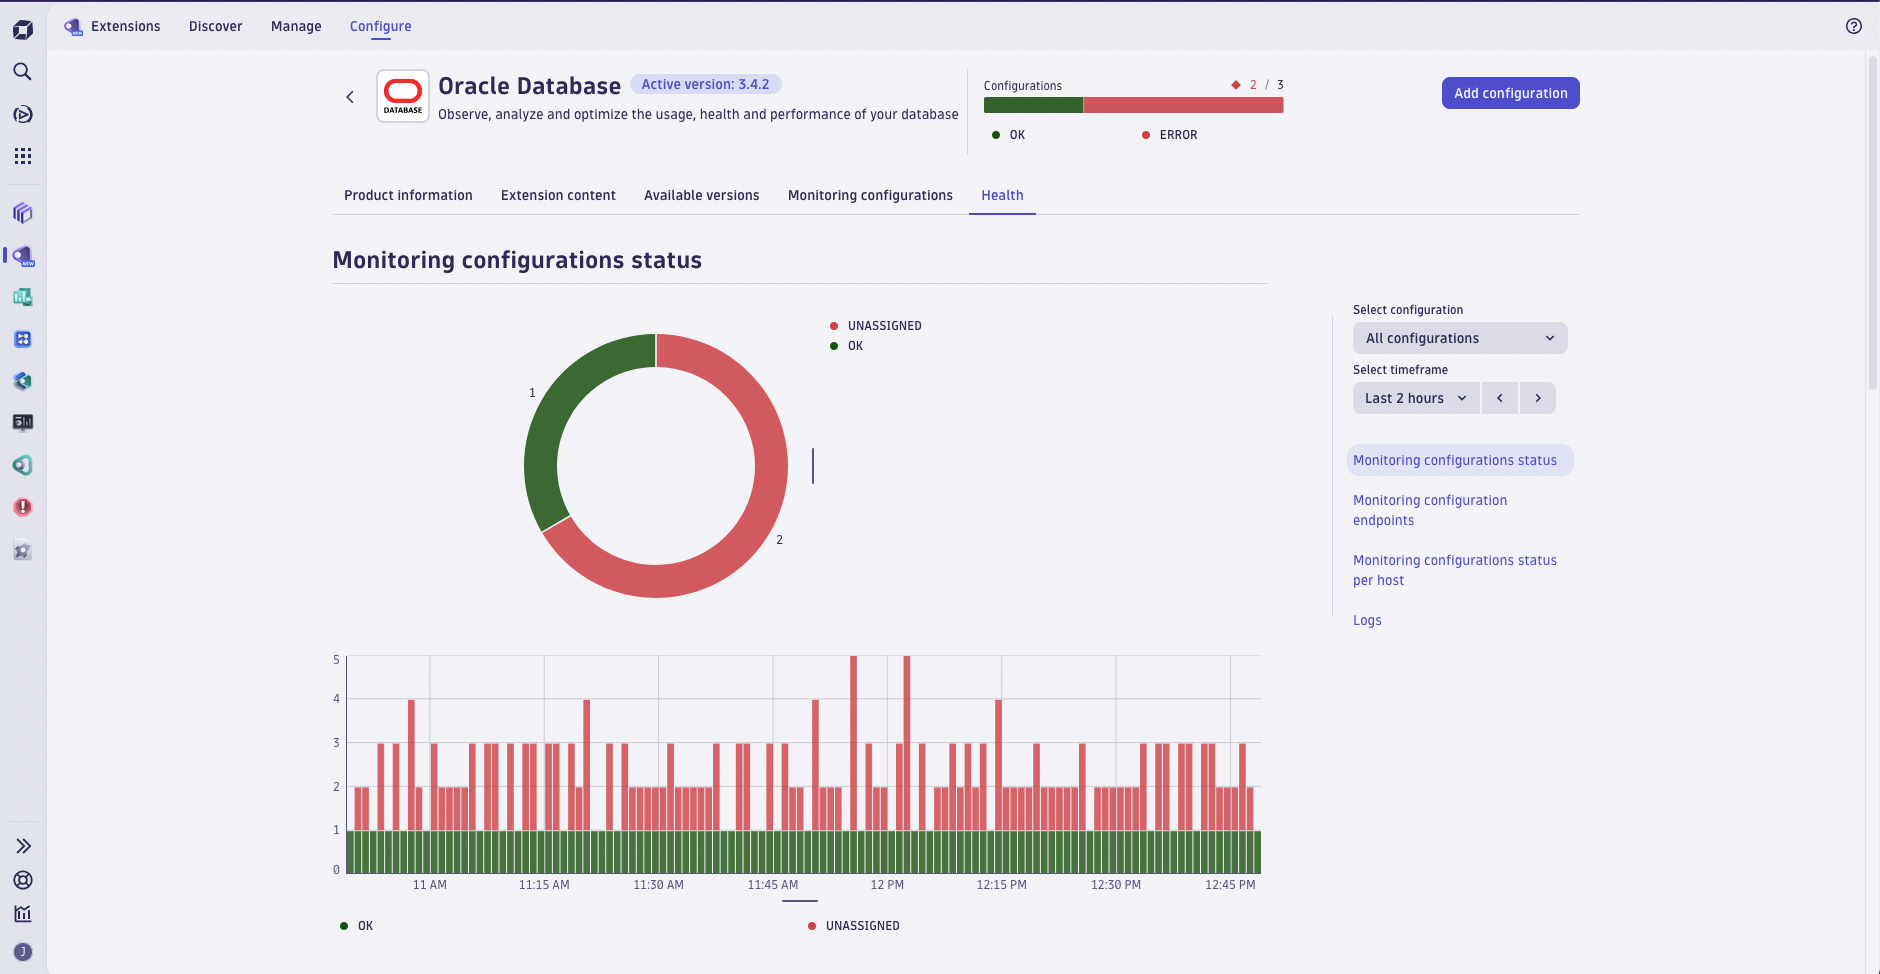
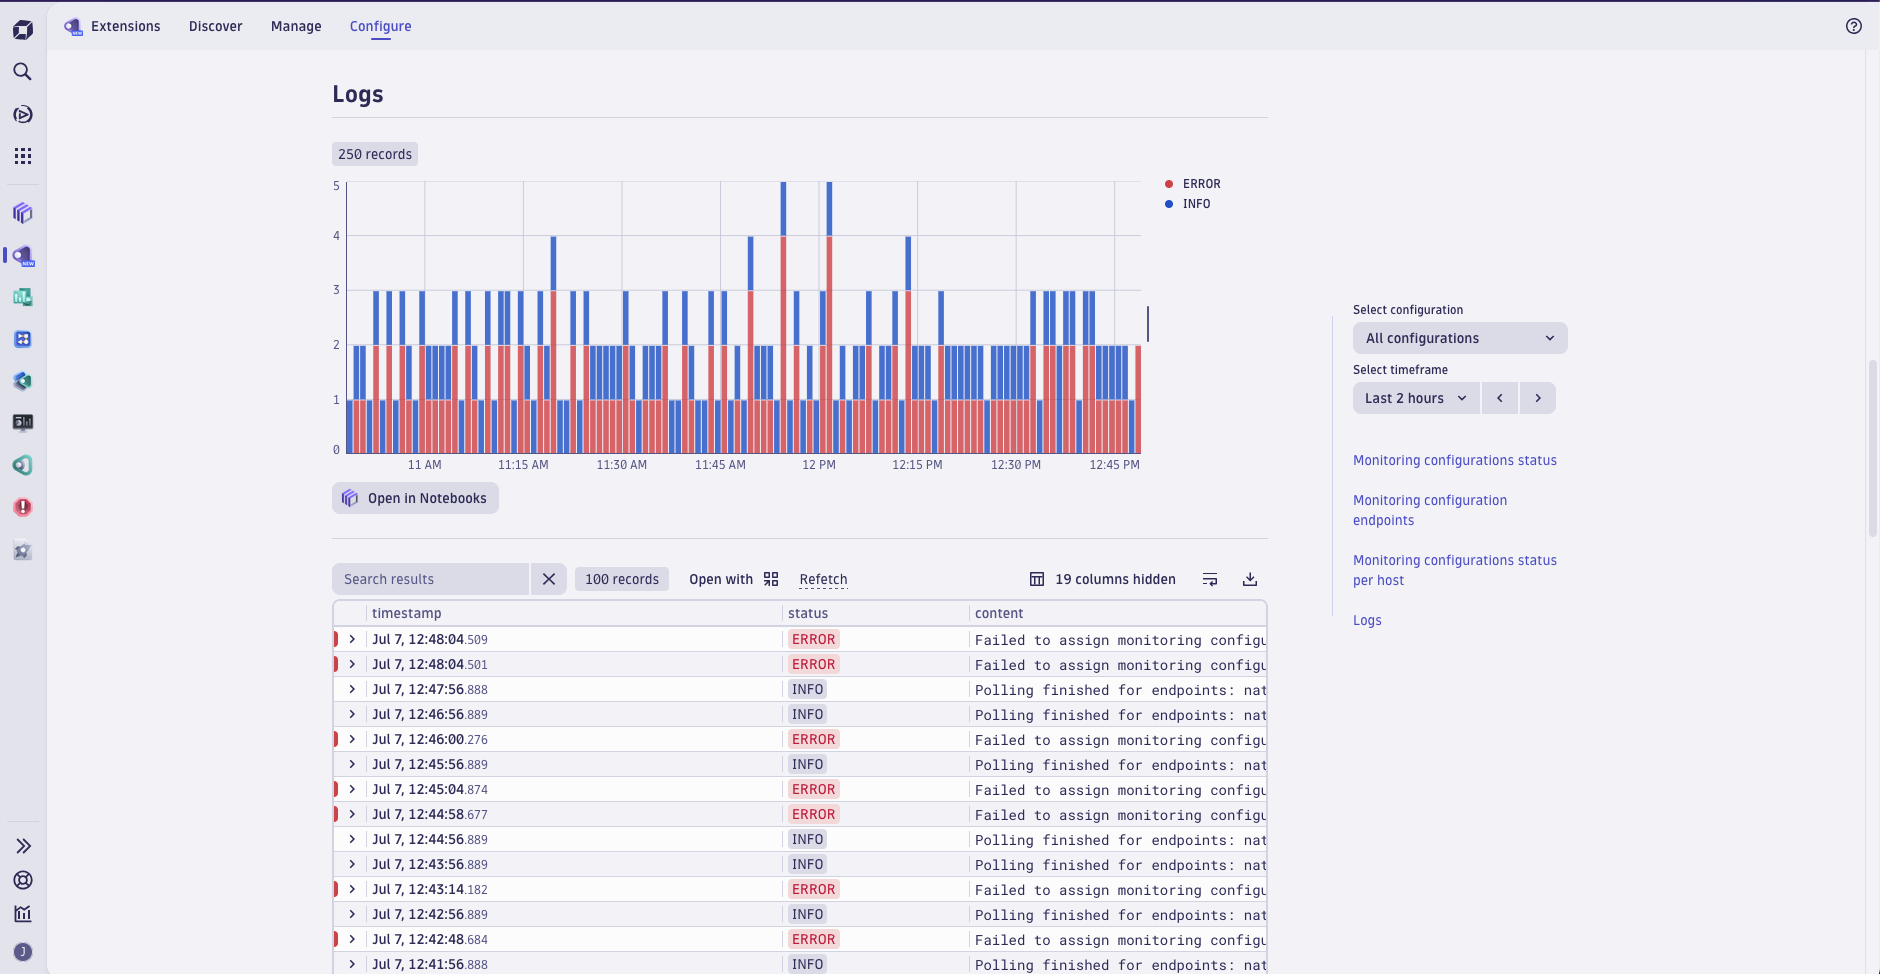
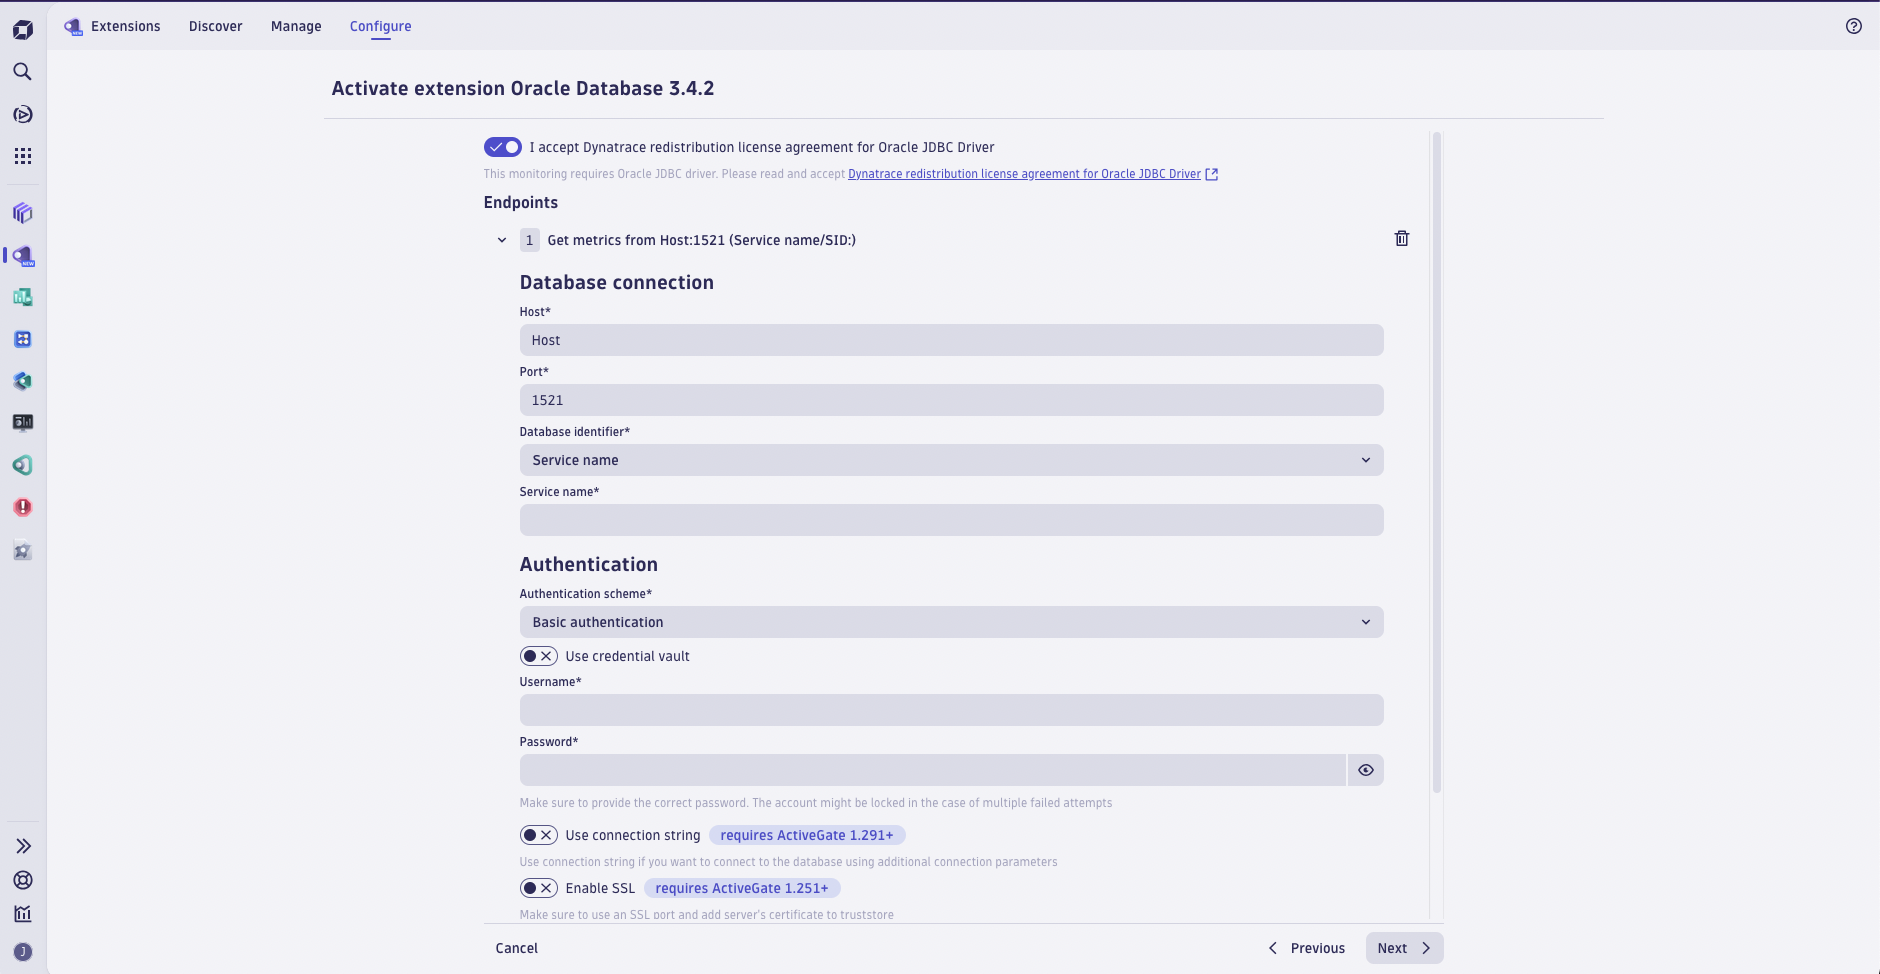
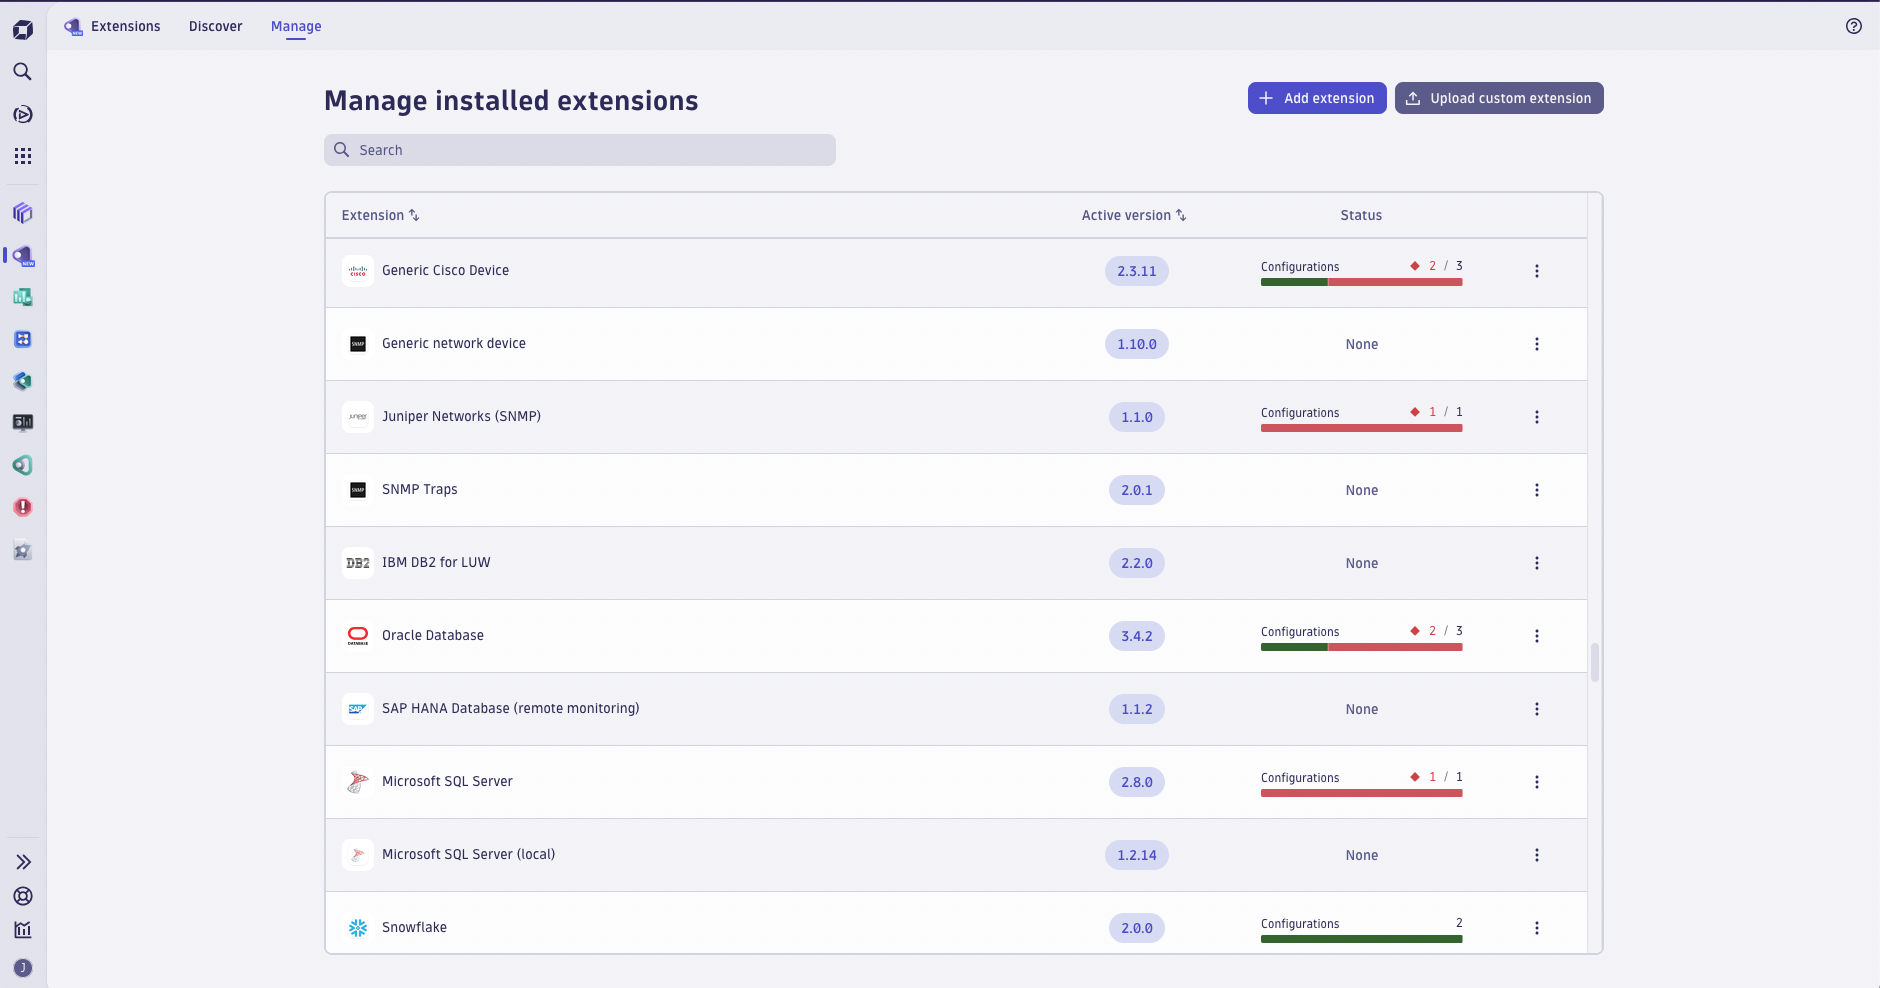
The Monitoring configs tab lists the configs that are available for each extension. Includes extension version used by each config and status.The Health tab shows the extension health per monitoring configuration.Explore the logs related to the health of each extension.Start monitoring new data sources.Manage all Extensions 2.0 installed in your environment.
  • Product information
  • Release notes

Overview

Extensions allows you to extend Dynatrace capabilities for data acquisition and domain expertise to hundreds of technologies. Extensions app is your central resource for managing and configuring Extensions 2.0.

Use cases

  • Expand Dynatrace monitoring capabilities by configuring extensions
  • Check status of running extensions and their configurations
  • Troubleshoot extensions with logs and events in context
  • Upload custom extension tailored for your needs

Get started

  1. Check the status of the Dynatrace extensions running in your environment.
  2. Browse through the list of Dynatrace extensions in Dynatrace Hub.
Dynatrace
Documentation
By Dynatrace
Dynatrace support center
Subscribe to new releases
Copy to clipboard

Full version history

ReleaseDate

Full version history

Release Notes for v2.9.1

Features

  • Non-configuration-bound logs are now included in the selected configuration log query.
  • Extended Python version compatibility warnings on the extension manage page, showing a warning icon based on static analysis when the Python version may be incompatible.
  • Bulk import and export actions are now available for primary tags and fields on the monitoring configuration page.

Bugfixes and Maintenance

  • Fixed a security vulnerability by updating the fast-uri dependency (CVE-2026-13676).
  • Fixed an issue where the PostgreSQL extension did not discover schema databases and was missing additional configuration parameters.
  • Fixed an issue where app update buttons were not grayed out when the user lacked the necessary permissions.
  • Fixed alignment of icons for Python deprecation and version upgrade warnings.
  • Fixed the feature sets label rendering to use the correct heading level.

Full version history

Release Notes for v2.8.0

Features

  • Added a Contents tab to the extension details page, showing only actionable assets by default
  • Bulk and single upgrade configurations buttons are now available on the Monitoring Configurations page.
  • Monitoring configurations can now be opened in a read-only view mode.
  • Extensions app now supports PMI extensions, including per-process status display for PMI and JMX extensions.
  • Users with conditional write permissions can now edit activation settings.
  • Opening an extension with an intent now can navigate directly to the Versions tab.

Bugfixes and Maintenance

  • Fixed multiple rendering and navigation issues when monitoring configurations contain a large number of endpoints.
  • Fixed an issue where activating a PostgreSQL extension could get stuck in a locked state.
  • Fixed a crash that occurred when opening the monitoring configuration editor without sufficient permissions.
  • Fixed an issue preventing monitoring configurations from being saved in some cases.
  • Fixed unintended secret field resubmission triggered by hovering over the field.
  • Fixed host tag filtering when creating a new monitoring configuration.

Full version history

Release Notes for v2.7.0

Features

  • Added support for dashboard links in both dynatrace.dashboards and dynatrace.classic.dashboards apps.
  • Added an extensions counter on the Manage page.
  • Improved permissions handling when listing extensions.

Bug fixes & maintenance

  • Addressed security vulnerabilities in the node-forge, undici, and fastify dependencies.
  • Fixed an error caused by null tags in DQL responses.

Full version history

Release Notes for v2.6.0

Features

  • Configurations IDs in the Monitoring Configurations table can now easily be copied to clipboard.
  • Support for TRIMMED and NO_WHITESPACE constraints in monitoring configuration schemas has been added.
  • Added Python version deprecation warnings.

Bugfixes and Maintenance

  • Hosts with Discovery monitoring mode will no longer be shown in the host selection.
  • Hosts with property standalone equal to 'true' will no longer be filtered out.

Full version history

Release Notes for v2.5.0

Features

  • Unpublished versions are no longer available for install through the "Available Versions" tab
  • Support for forceSecretResubmission fields when creating/updating monitoring configurations

Bugfixes and Maintenance

  • Resolved vulnerabilities in lodash-es, jsdiff and fastify dependencies
  • Migrated publishing process from HubManager to HubConsole

Full version history

Fixes

  • Lacking user permissions will no longer crash the app
  • Host status table in the Health view is displayed properly now
  • Configuration selection in the Health view is now sorted and searchable by description

Full version history

Breaking Changes

  • Switched to using platform Extensions API

This change makes the environment:roles:manage-settings permission not sufficient to use the application. Please check needed permissions in the Hub entry for the Extensions app.

Core Changes

  • Switched to DQL queries for metrics data
  • Migrated to dt-app v1

UI Changes

  • Removed donut charts from Health page for better clarity
  • Removed download button from all tables
  • Adjusted type filter in Extension content view to show only available asset types
  • Aligned copy button icons on Product information view

Fixes

  • Numeric fields will now properly show value 0 when editing configuration

Full version history

New

  • SQL extensions on Kubernetes can now be activated from UI
  • Added missing mapping for alert creation

Changes

  • Updated 3rd parties libraries

Fixes

  • Fixed bug where extension manager app was deleting variables on monitoring configuration
  • Fixed typo that prevented some alerts to be created (dealerting)

Full version history

Changes

  • Updated all tables' look and layout to fit the style of other Dynatrace apps.
  • Optimised fetching of extensions' icons and images.

Fixes

  • Fixed minor inconsistencies when filtering hosts with tags.

Full version history

Changes:

  • Updated table views
  • Enabled navigation using Extensions app logo icon

Fixes:

  • Adjusted sorting extensions by version to use semantic versioning
  • Fixed IDLE configurations showing as ERROR on extension configuration status

Full version history

Changes

  • Extension and configuration statues can now be marked with a Warning status if only some of the endpoints require attention.

  • Hosts and Active Gates details can now be accessed from extension Health screen.

Fixes

  • Optimised network calls.

  • Fixed infinite loading of endpoints for Python Extensions activated using intent.

Full version history

We fixed some bugs and improved several UI elements.

Full version history

New

  • Alerts can now be created from the app if defined in the extension
  • Extension app is now able to send self-monitoring logs to Dynatrace
  • Help menu added to navigation bar

Changes

  • Extensions app uses now the latest shell components

Full version history

Changes

  • Integrated new form validation engine
  • Added recommendations and descriptions to the feature sets list

Fixes

  • Attributes section is no longer displayed when editing local configuration
  • Adjusted validation errors' messages

Full version history

Fixes

  • Confirmation toast after extension upload is no longer disappearing immediately.
  • Versions list correctly updates after upload or deletion of a version.
  • No Active Gate group will be selected when creating another configuration without page refresh, which previously resulted in blocking the activation form.

QoL improvements

  • It is now possible to type a name of a searched extension while installed extensions list is still loading.
  • Deleting the last version of a custom extension will now automatically redirect to Manage page.

Full version history

  • SNMP-based extensions support credential vault
  • Create credentials in the app: Credentials for the vault can now be created directly within the app.
  • Support for activating extensions in Kubernetes (K8S)

Full version history

Fixes

Fixed navigation to Discover and Manage pages using the title top bar.

Other

Changes and improvements for ready-made dashboards.

Full version history

Features

  • Support for code component
  • It is now possible to fully activate prometheusMetrics based extensions

Fixes

  • Entering from intent with a single extension no longer causes infinite loading.

Other

  • Added a new modal for confirmation of successful activation.
  • Changes and improvements for ready-made dashboards.

Full version history

Changes

Ready-made dashboards

Added 14 ready-made dashboards for most used extensions

  • VMware Extension Overview
  • Nutanix Overview
  • Extension Data Consumption
  • IBM MQ Monitoring Overview
  • IBM Datapower Overview
  • Salesforce Overview
  • Salesforce Ingest and Outage
  • Salesforce Pages with Timeout
  • Salesforce Use Activity Deep Dive
  • Salesforce Data Infest Overview
  • Cisco Device Overview
  • SQL Server Overview
  • Oracle DB Overview
  • Kafka Overview

Fixes

Management Zones

  • All Management Zones are now visible
  • Increased Management Zones host tags limit

Extensions list

  • Bug with infinite loading of extension list is now fixed

Full version history

Changes

  • New dashboards Cisco; Nutanix; VMware

Fixes

  • EXT-10702: higher limit for Management Zones

Full version history

  • Active version column in Extensions versions view is now correct.

Full version history

  • improved Hosts and Host Groups selection screens
  • other minor fixes

Full version history

No release notes

Full version history

No release notes

Full version history

No release notes

Full version history

No release notes

Full version history

No release notes

Full version history

No release notes

Dynatrace Hub
Hub HomeGet data into DynatraceBuild your own app
Dynatrace Intelligence - Agentic Operations SystemThe Dynatrace Agentic AI ecosystem
Log Management and AnalyticsKubernetesAI and LLM ObservabilityInfrastructure ObservabilitySoftware DeliveryApplication ObservabilityApplication SecurityBusiness ObservabilityDigital Experience
Filter
Type
Built and maintained by
Deployment model
SaaS
  • SaaS
  • Managed
Partner FinderBecome a partnerDynatrace Developer

All

222 Results filtered by:

Akamai logo

Akamai

Ingest logs and security events from Akamai products.

Extension

Alibaba Cloud logo

Alibaba Cloud

Automatically discover, baseline, and monitor Alicloud environment components.

Extension

Anypoint MQ logo

Anypoint MQ

Gather metrics about your Anypoint MQ Queues.

Extension

Apache ActiveMQ Classic logo

Apache ActiveMQ Classic

Automatic and smart observability for ActiveMQ with trace and metric insights.

Extension

Apache Cassandra logo

Apache Cassandra

Improve Apache Cassandra observability.

Extension

Apache CouchDB logo

Apache CouchDB

Intelligently observe and optimize health and performance of your database.

Extension

Apache Kafka logo

Apache Kafka

Automatic and intelligent observability with trace and metric insights.

Extension

Apache Solr logo

Apache Solr

Open-source enterprise-search platform, written in Java.

Extension

Apache Spark logo

Apache Spark

Enhanced insights for Spark Components.

Extension

Apache Zookeeper logo

Apache Zookeeper

Monitor and analyze your Apache Zookeeper with this JMX-based extension.

Extension

Apigee logo

Apigee

Remotely monitor your Apigee proxies.

Extension

AWS Cloud Monitoring logo

AWS Cloud Monitoring

New and enhanced monitoring capabilities for your AWS cloud platforms.

Extension

AWS Entities for Metric Streaming logo

AWS Entities for Metric Streaming

Analyse metrics in the context of an entity based on AWS Metric Streaming.

Extension

Azure Cloud Monitoring logo

Azure Cloud Monitoring

New and enhanced monitoring capabilities for your Azure cloud platforms.

Extensioncoming soon

Azure Managed Apache Cassandra logo

Azure Managed Apache Cassandra

Gain insights into your Azure Managed Cassandra Instance health and performance.

Extension

Black Duck logo

Black Duck

Ingest Black Duck security events and audit logs.

Extension

Ceph storage logo

Ceph storage

Monitor usage of Ceph storage system at both client side and host level.

Extension

Checkmarx logo

Checkmarx

Ingest Checkmarx security events and audit logs.

Extension

Check Point Firewall logo

Check Point Firewall

Gain insights into the performance of your Check Point Firewall devices.

Extension
Cisco ACI/APIC logo

Cisco ACI/APIC

Get insights into your Cisco Application Centric Infrastructure (ACI).

Extension

Cisco Catalyst Center (DNA Center) logo

Cisco Catalyst Center (DNA Center)

Get insights into the Cisco Catalyst Center infrastructure (f.k.a. DNA Center).

Extension
Cisco Catalyst SD-WAN Manager (Viptela) logo

Cisco Catalyst SD-WAN Manager (Viptela)

Get insights into the Cisco SD-WAN performance through the vManage API.

Extension

Cisco Firepower logo

Cisco Firepower

Monitor Cisco Firepower devices using SNMP.

Extension

Cisco UCS C-Series logo

Cisco UCS C-Series

Get insights into your Cisco UCS C-Series devices.

Extension

Cisco UCS M-Series logo

Cisco UCS M-Series

Get insights into your Cisco UCS M-Series devices.

Extension

Citrix DaaS & Virtual Apps and Desktops logo

Citrix DaaS & Virtual Apps and Desktops

Gain insight into your Citrix DaaS & Virtual Apps and Desktops environments.

Extension

Citrix Netscaler ADC logo

Citrix Netscaler ADC

Remotely monitor your Citrix NetScaler devices.

Extension
Citrix NetScaler SDX logo

Citrix NetScaler SDX

Remotely monitor your Citrix NetScaler SDX devices.

Extension

Cloudflare (extension) logo

Cloudflare (extension)

Collect notification history and various metrics from your Cloudflare accounts.

Extension

Cloud Foundry logo

Cloud Foundry

Monitor your Cloud Foundry resource definitions by connecting to the foundation.

Extension

Confluent Cloud (Kafka) logo

Confluent Cloud (Kafka)

Remotely monitor your Confluent Cloud Kafka Clusters and other resources!.

Extension

Connection Pools: Apache Commons logo

Connection Pools: Apache Commons

Application method of pooling and sharing multiple connections to a database.

Extension

Connection Pools: C3P0 logo

Connection Pools: C3P0

Application server method of pooling and sharing connections to a database.

Extension

Connection Pools: JBoss logo

Connection Pools: JBoss

Application server method of pooling and sharing connections to a database.

Extension

Connection Pools: WebLogic logo

Connection Pools: WebLogic

Application server method of pooling and sharing connections to a database.

Extension

Connection Pools: WebSphere Liberty logo

Connection Pools: WebSphere Liberty

Application server method of pooling and sharing connections to a database.

Extension

Consul Service Mesh (StatsD) logo

Consul Service Mesh (StatsD)

Extend visibility into your Consul Service Mesh instances to monitor health and improve performance.

Extension

Control-M Jobs v2 logo

Control-M Jobs v2

Monitor your Control-M jobs execution status.

Extension

CoreDNS (2.0) logo

CoreDNS (2.0)

Collect important data from your CoreDNS processes.

Extension

Couchbase logo

Couchbase

Couchbase Capella (SaaS) database monitoring.

Extension

CPU Core Monitoring logo

CPU Core Monitoring

Get insights into CPU Core utilization on your OneAgent hosts.

Extension

CrowdStrike logo

CrowdStrike

Ingest CrowdStrike detection findings, threat reports, and audit logs.

Extension

CyberArk logo

CyberArk

Ingest CyberArk audit logs via SIEM integration for reporting and analysis.

Extension

Databricks logo

Databricks

Monitor your Databricks Clusters via its multiple APIs!.

Extension

Databricks Workspace logo

Databricks Workspace

Remotely monitor your Databricks Workspaces!.

Extension

definity logo

definity

Monitor and optimize your Lakehouse, Spark, and Databricks pipelines.

Extension

Defunct Process Monitoring logo

Defunct Process Monitoring

Monitoring defunct processes stuck on your linux servers.

Extension

Dell EMC Isilon - PowerScale logo

Dell EMC Isilon - PowerScale

Monitor your Dell EMC Isilon / Powerscale clusters through the OneFS API.

Extension

Dell EMC PowerMax logo

Dell EMC PowerMax

Monitor PowerMax Arrays for performance and health, with Dell Unisphere API.

Extension

Dell iDRAC logo

Dell iDRAC

Connect to the Redfish API to get insights into your Dell iDRAC environment.

Extension