

Unified observability and security
Simplify cloud complexity and innovate faster and more securely with the only analytics and automation platform powered by causal AI.
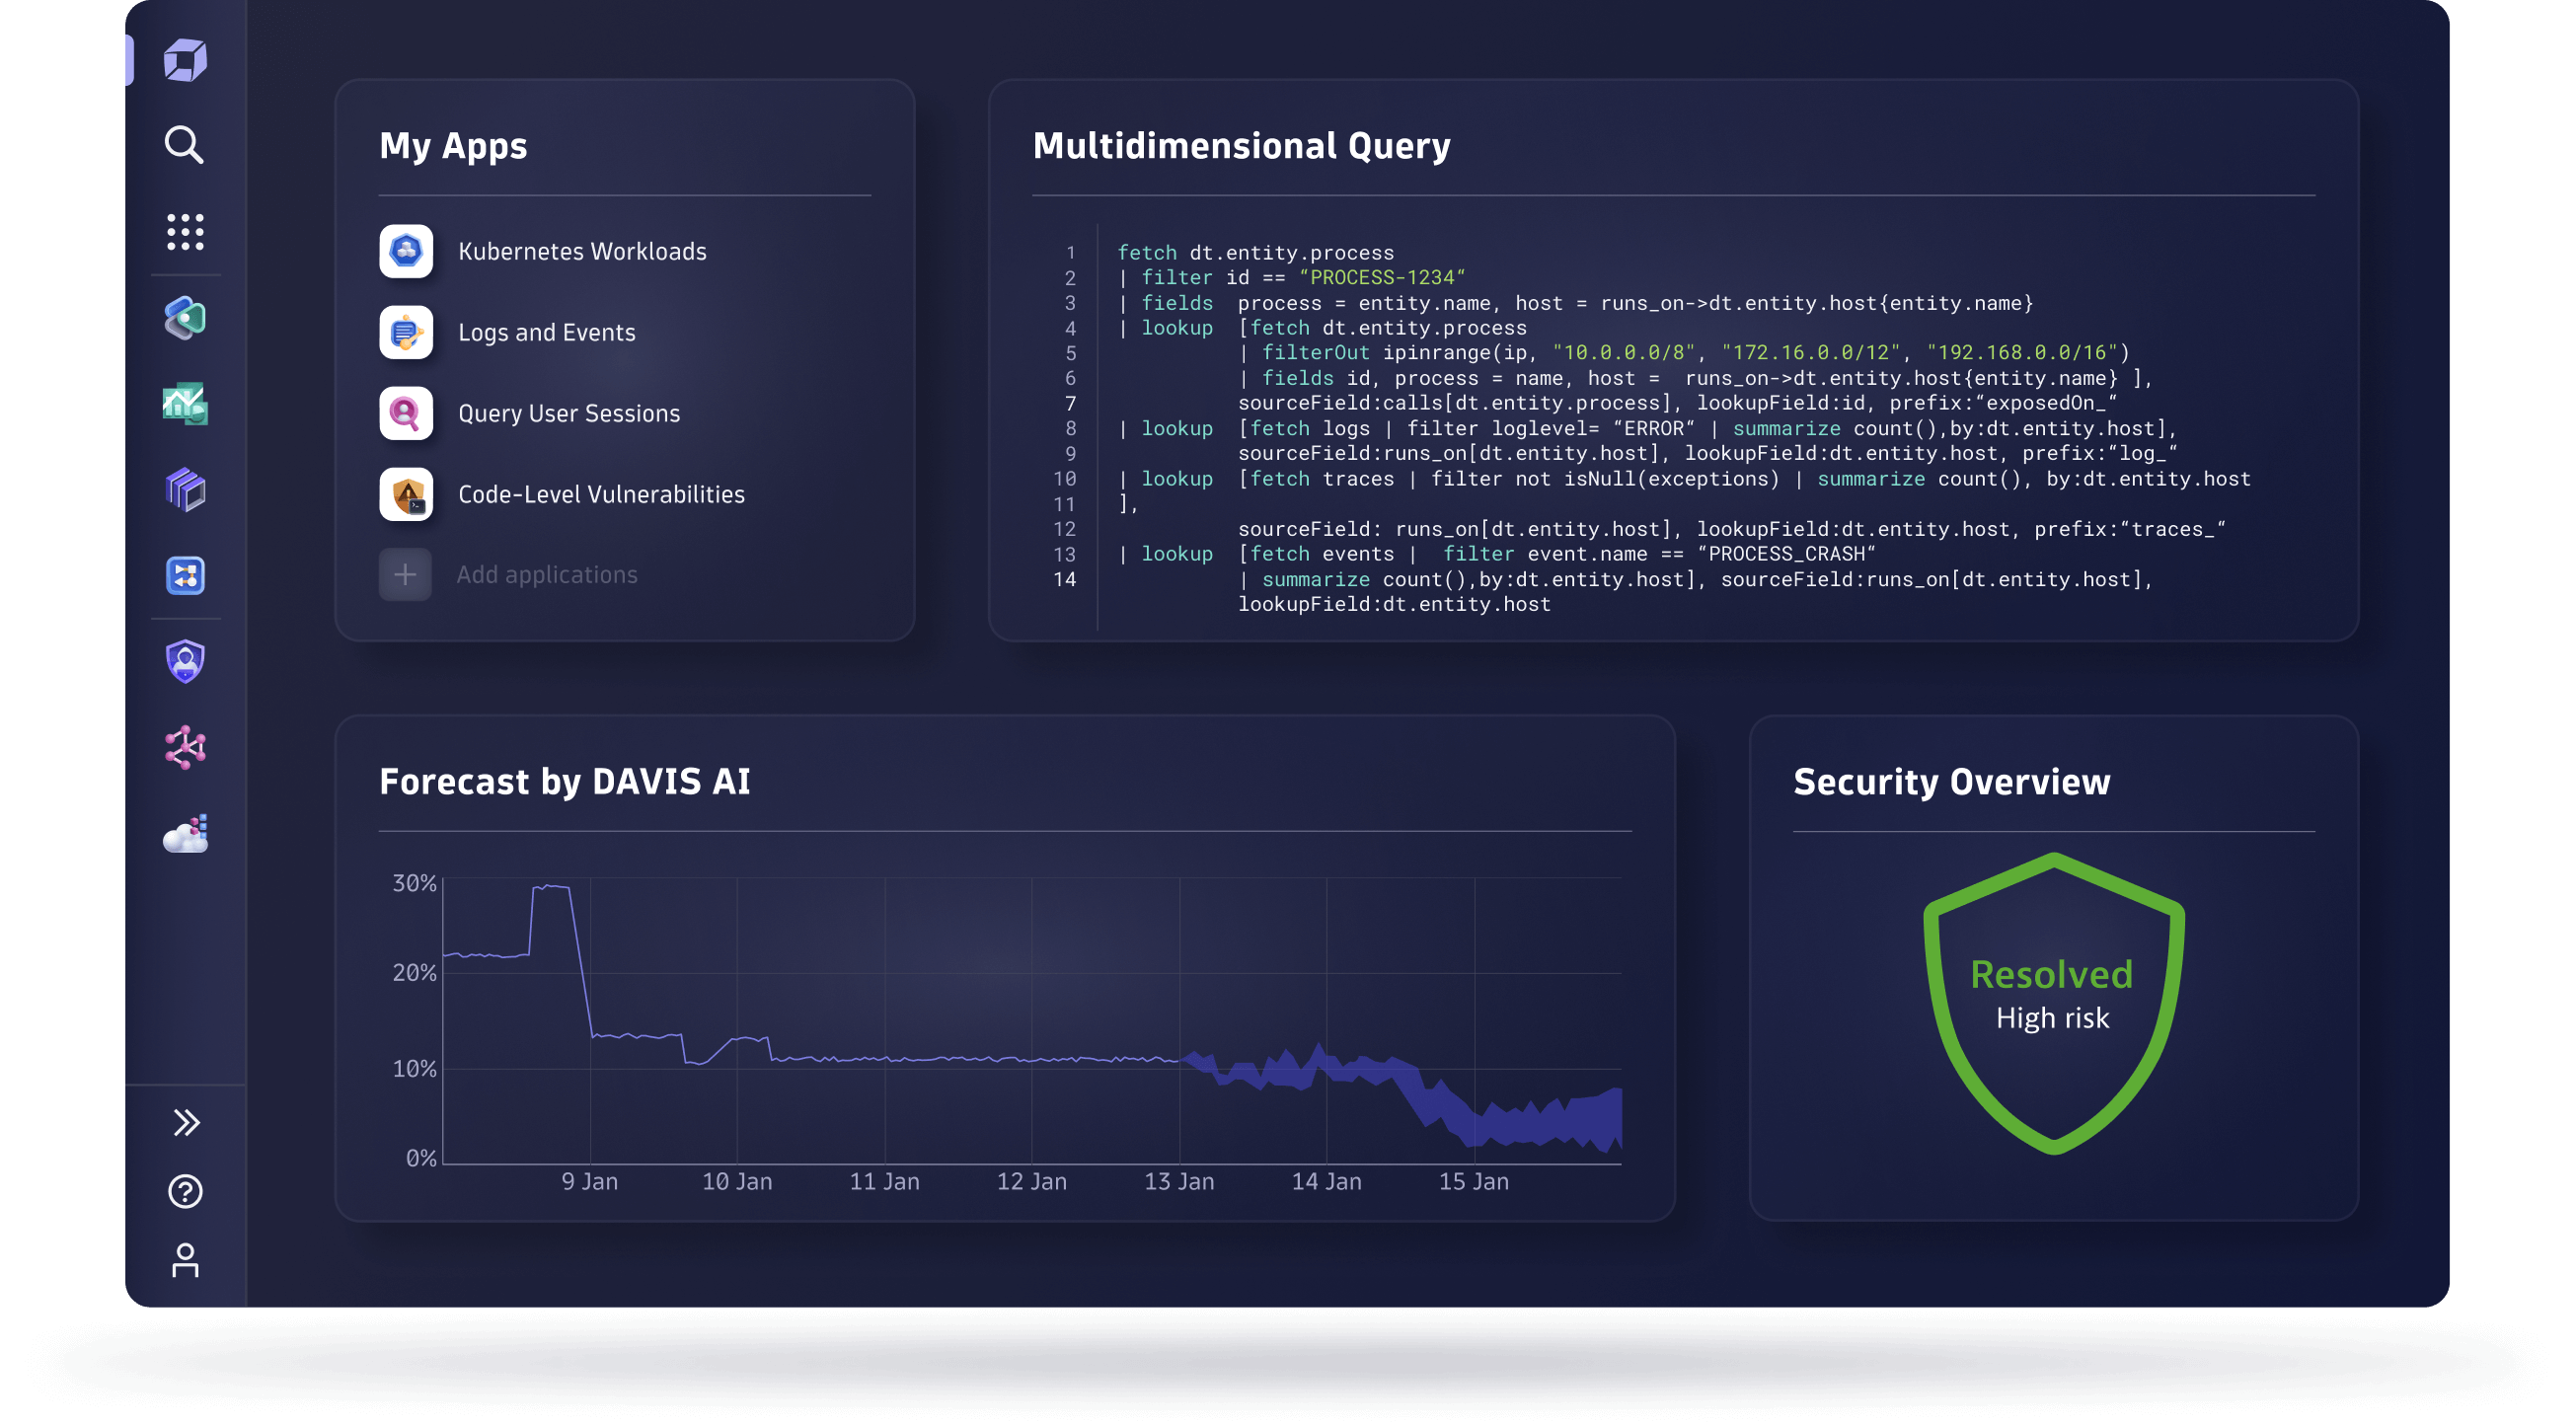
Monitor and secure your full stack on one AI-powered data platform
Solve your biggest digital challenges with complete visibility and precise answers that drive automation.
-
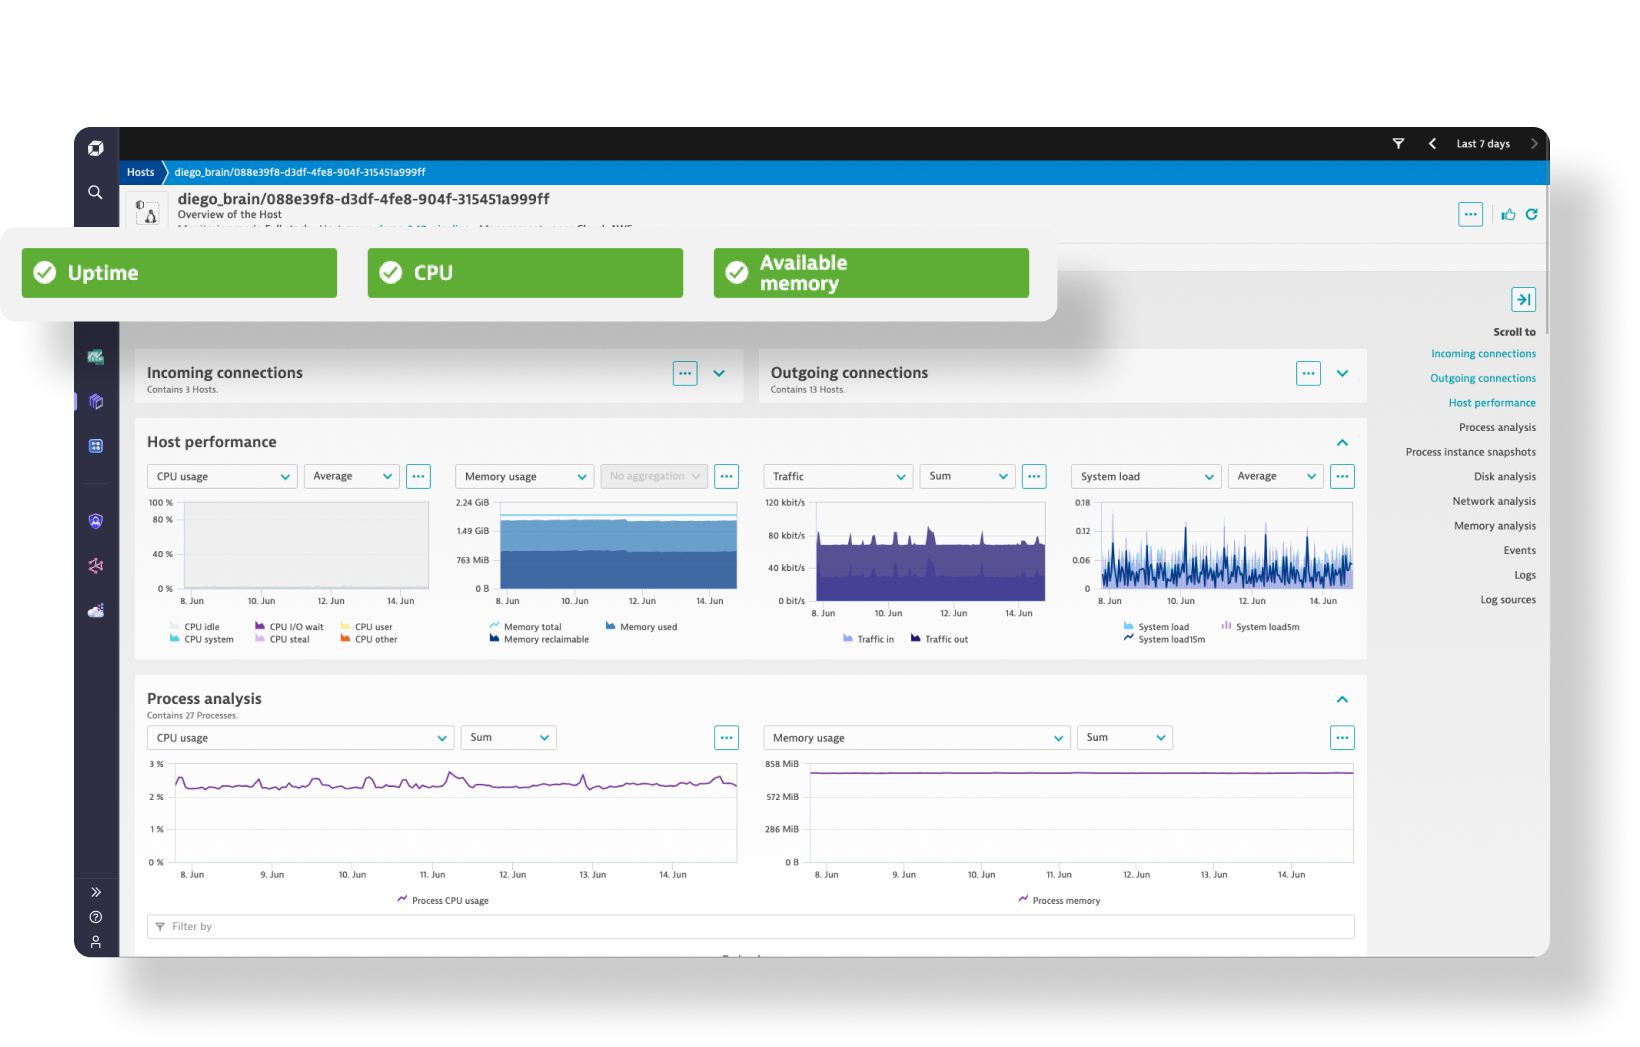
Infrastructure Observability
-
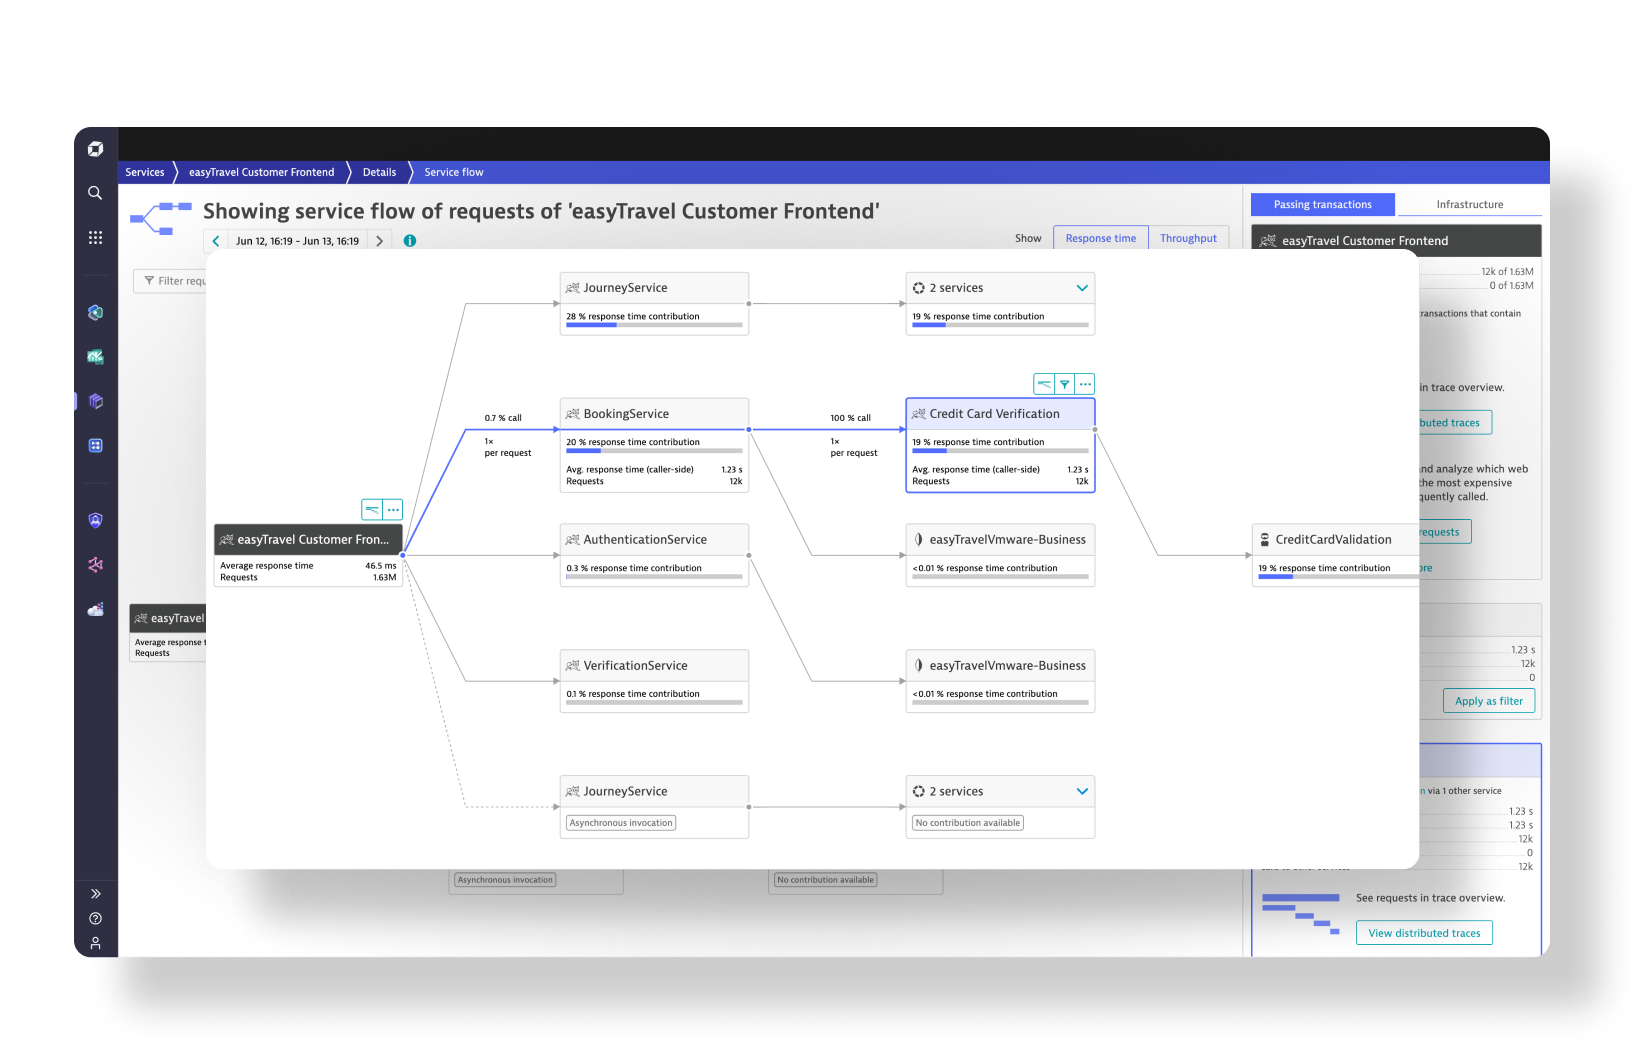
Application Observability
-
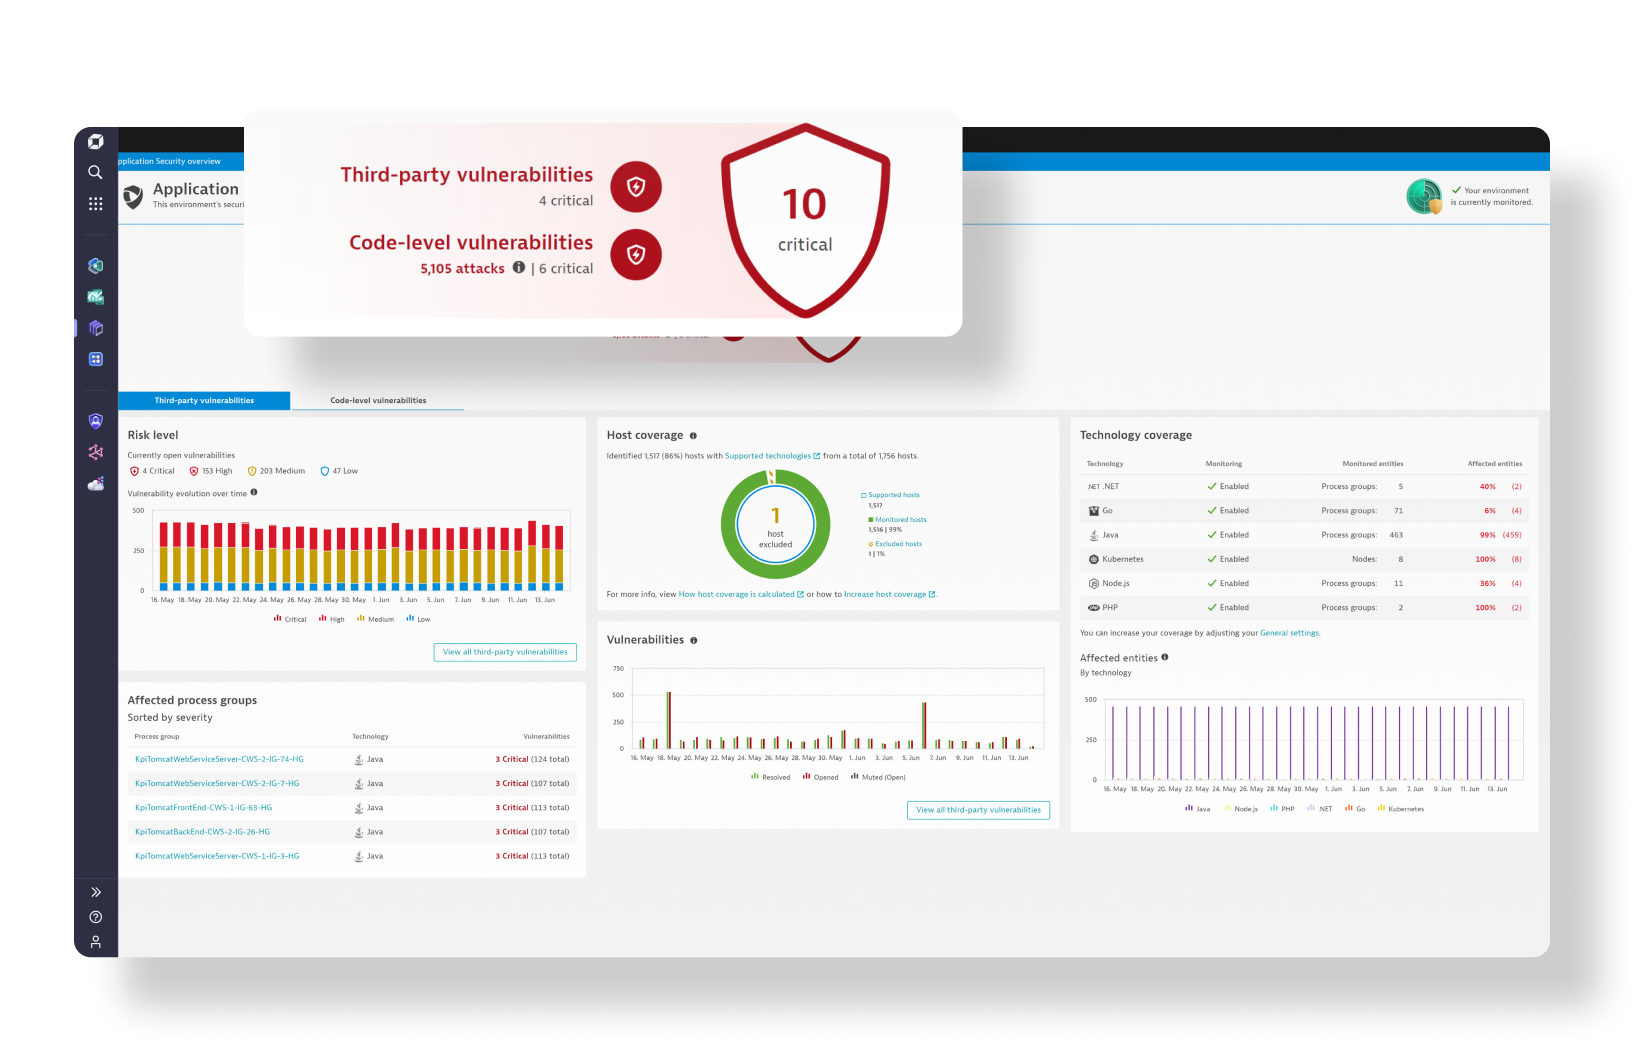
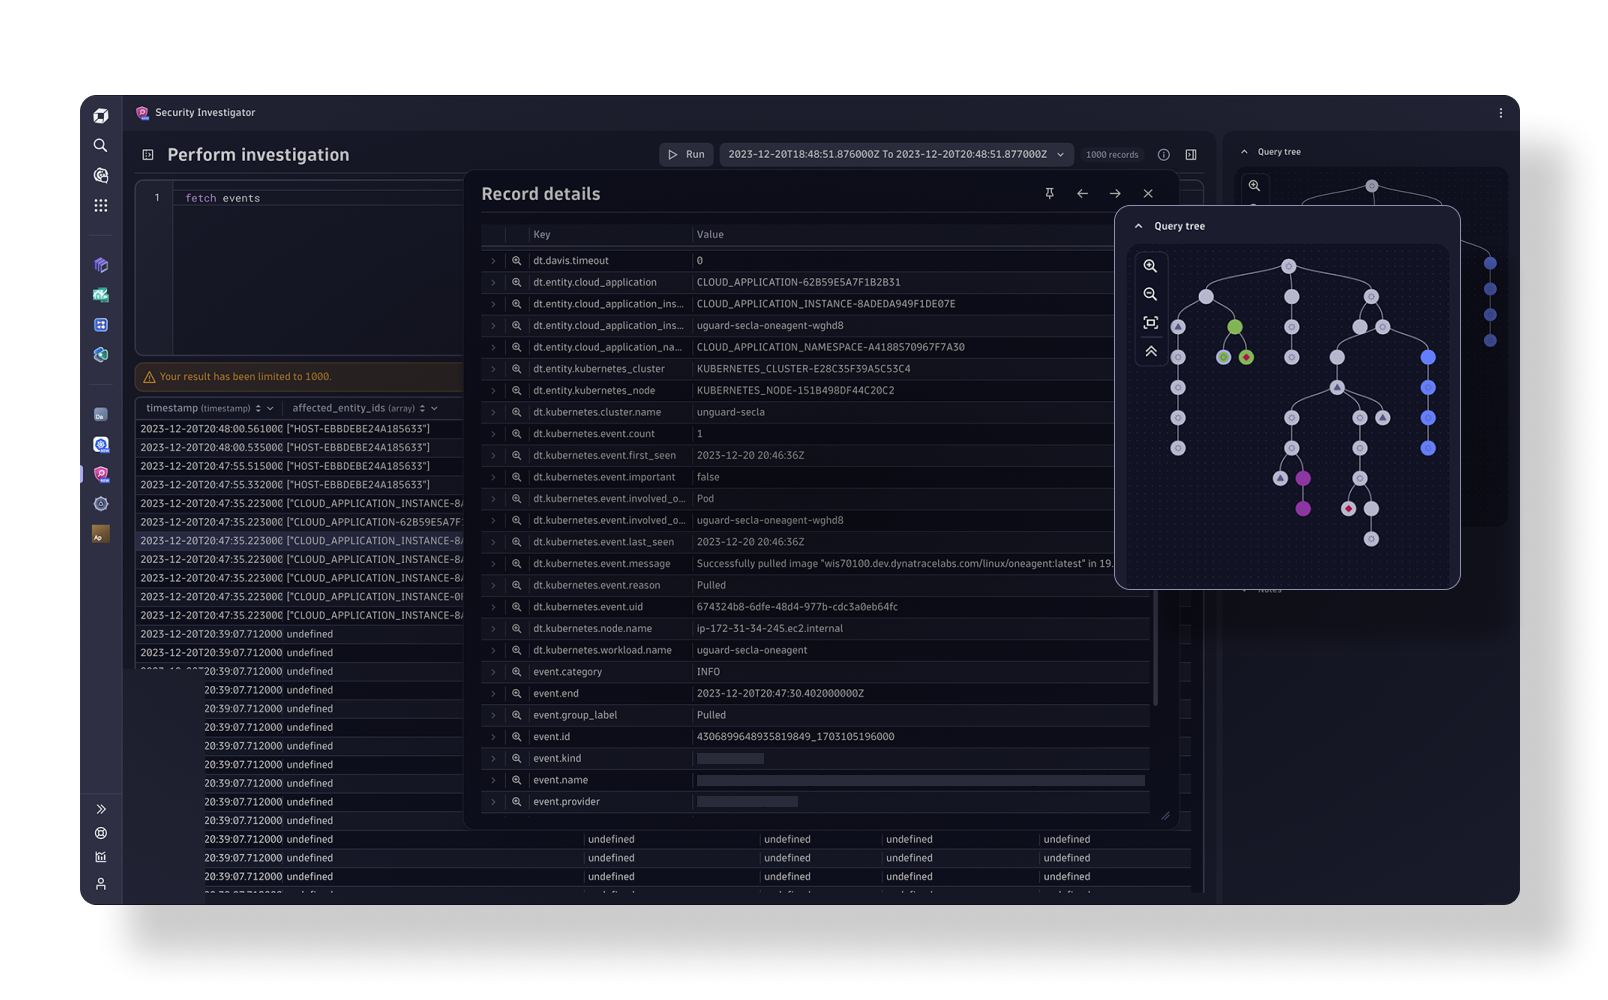
Security Protection
-
Security Analytics
-
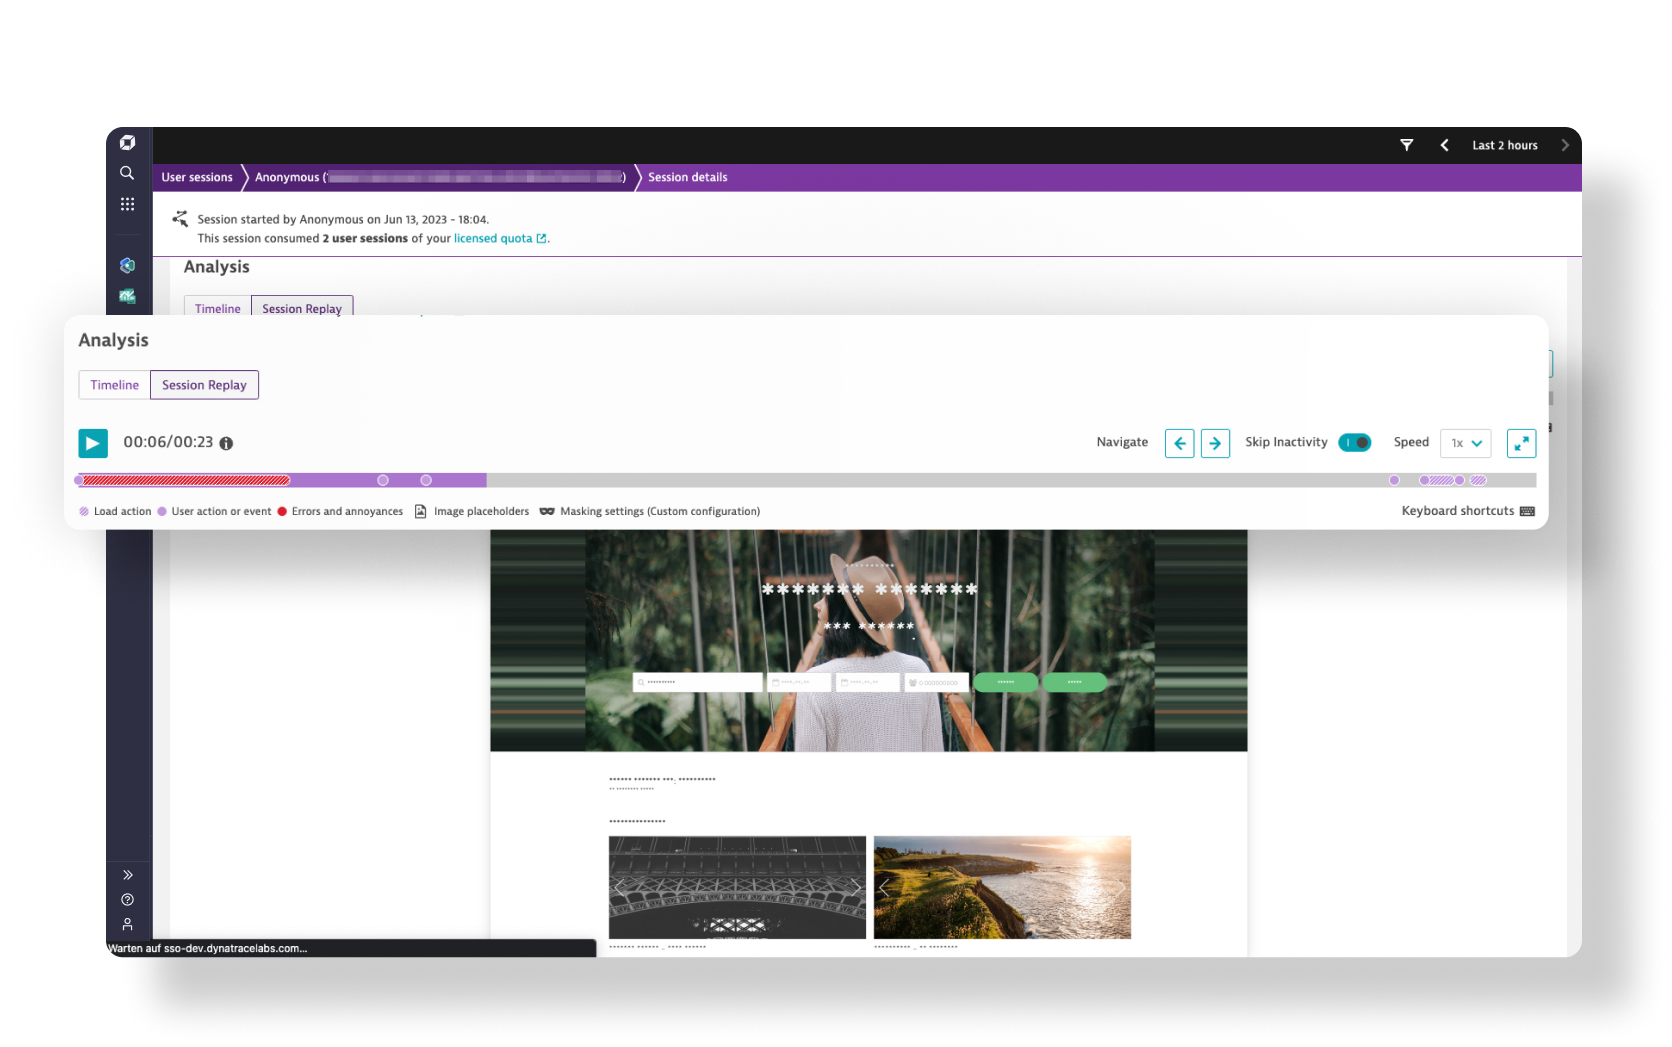
Digital Experience
-
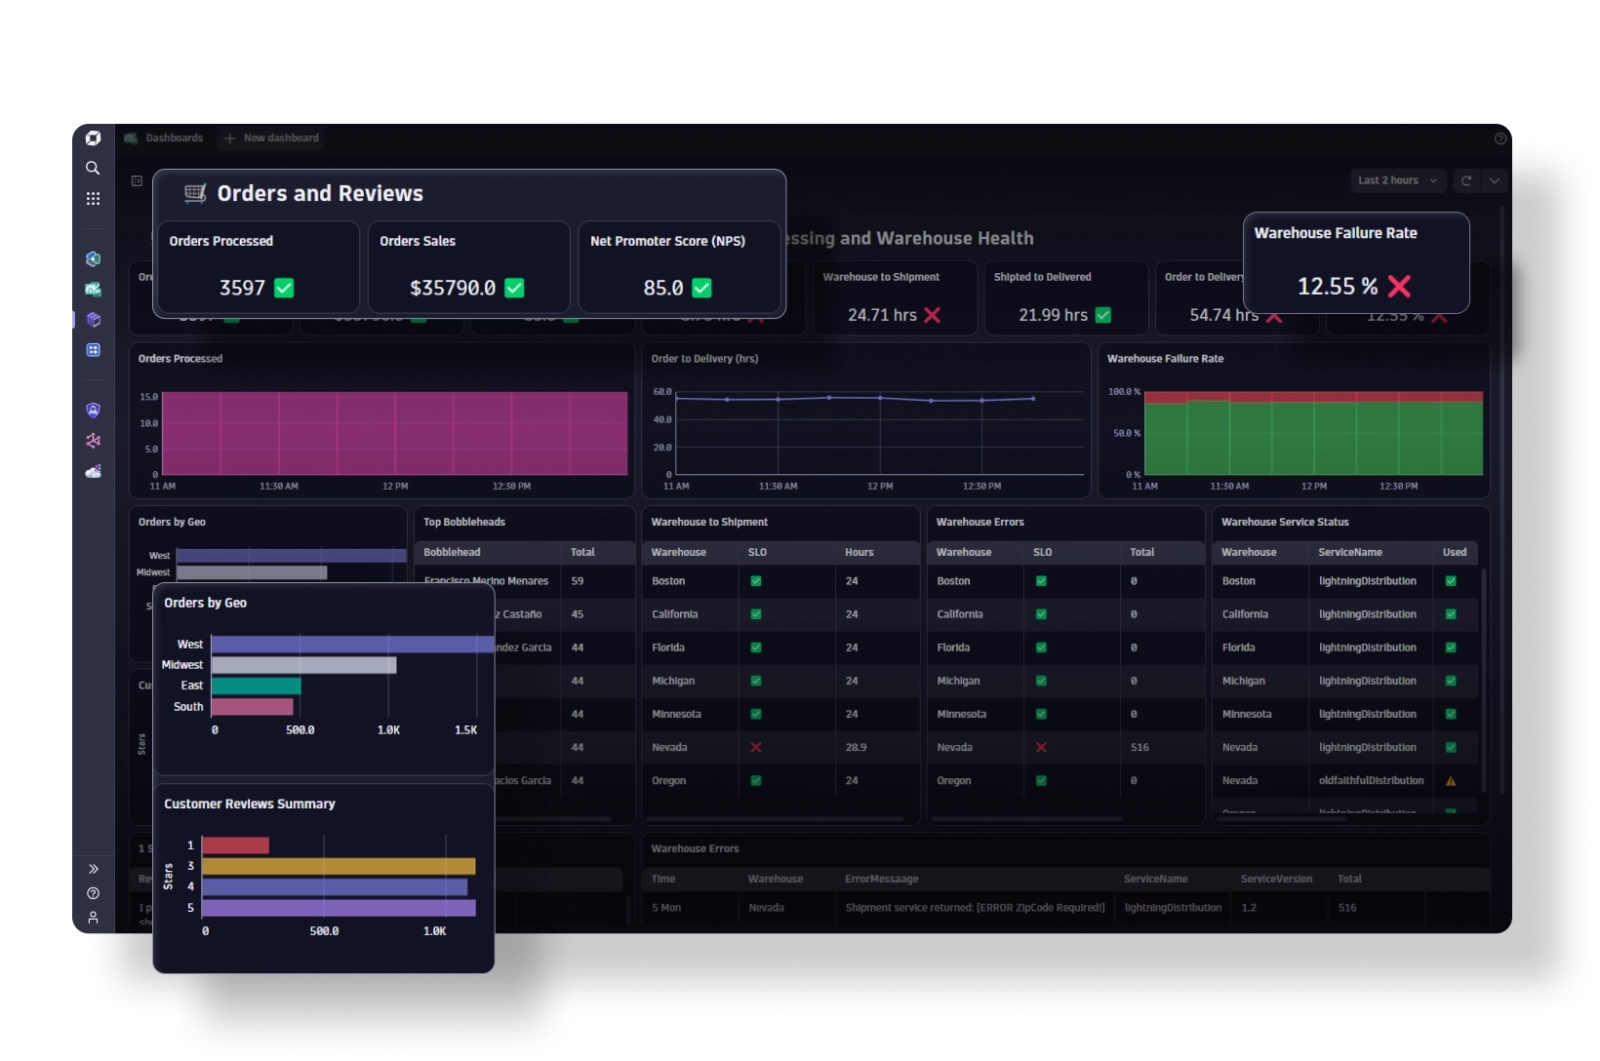
Business Analytics
-
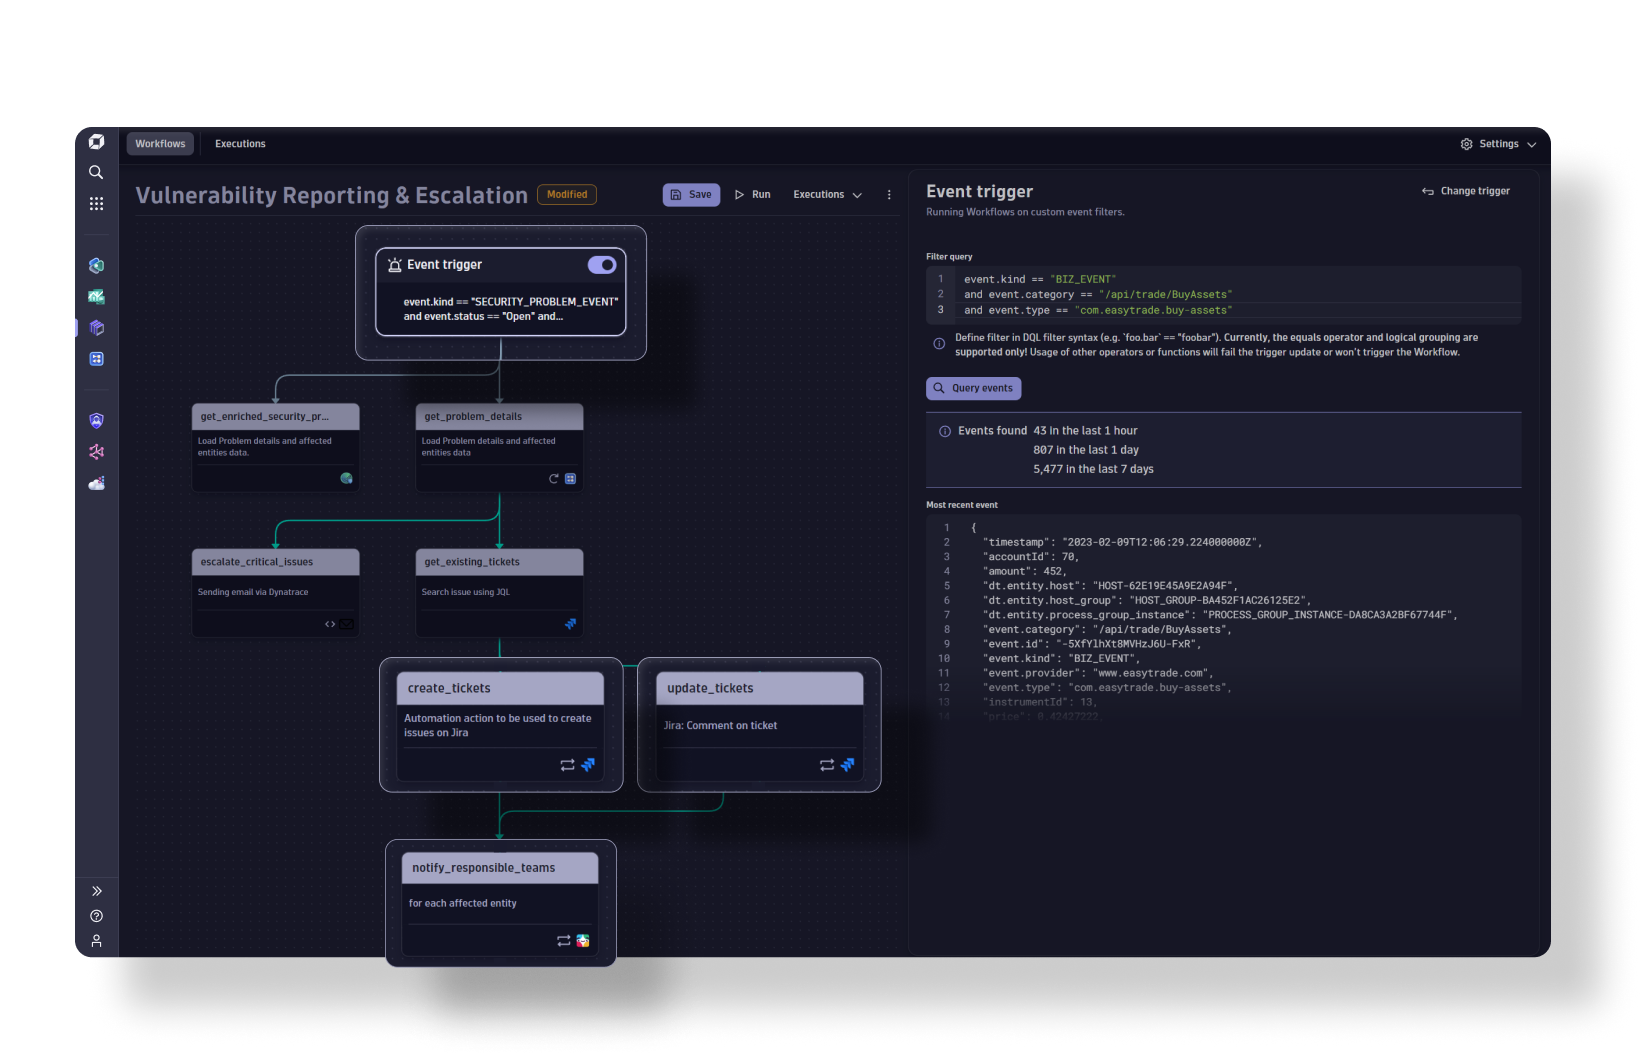
Automations
-
Custom Solutions
A Leader in the 2023 Gartner® Magic Quadrant™ and ranked #1 in the Critical Capabilities for APM and Observability reports
See why we’re positioned furthest for Vision and highest for Execution in the Magic Quadrant, and ranked #1 in all Use Cases in the Critical Capabilities Report for Application Performance Monitoring and Observability.


Empower every team to do more with data
Break down silos and proactively prevent issues before they affect end users.
Business
Deliver experiences customers love
And increase conversions up to 32%
Development
Innovate faster with higher quality
And deliver better software up to 4x faster
Security
Keep services reliable and resilient
And reduce time spent on vulnerabilities up to 95%
Operations
Operate efficiently and securely
And reduce support tickets up to 99%

650+
supported technologies
We’re open and extensible, and integrate with all major cloud platforms and solutions.
The industry leader in unified observability and security
 A leader in the 2023 Gartner® Magic Quadrant™
A Leader and positioned furthest for Vision and highest in Execution in the 2023 Gartner Magic Quadrant™-
 2023 ISG Provider Lens™
Read this year’s research to learn why ISG recognized Dynatrace with Leader status in cloud-native observability and security, and why the Dynatrace Davis AI engine sets us apart. -
 The Forrester Wave™️: Artificial Intelligence for IT Operations (AIOps) report
See why we earned top scores in the Current Offering and Strategy categories.
Try it free
