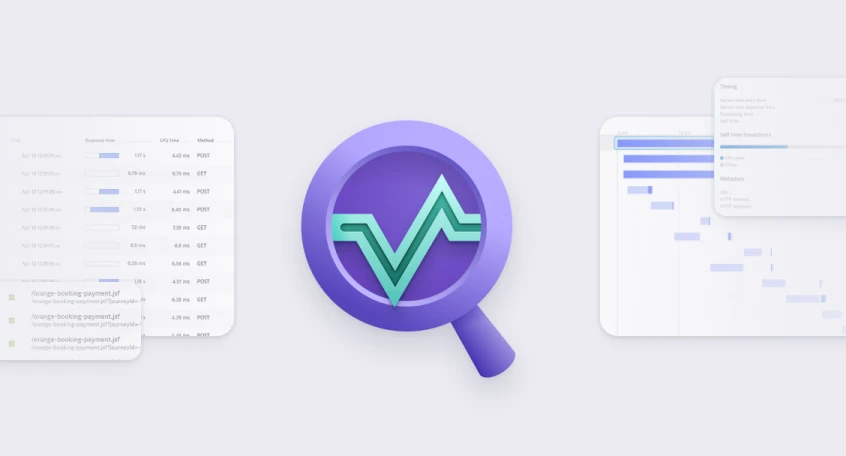
Application Observability
Optimize your service performance, innovate faster, and collaborate efficiently with automatic and intelligent observability at scale and end-to-end distributed tracing for cloud-native workloads and enterprise apps.
Essentials
Get started with these popular tools for monitoring your applications and microservices.
Kubernetes
Harness automation and AI to simplify Kubernetes observability at scale.
OpenTelemetry
Ingest OpenTelemetry traces & metrics, pin them to a dashboard, set alarms, analyze them in the context of metric, log, and diagnostic data.
Serverless
Seamless integration with serverless technologies to eliminate blind spots through OOTB integrations with AWS, Azure, and Google Cloud.
Kubernetes
All-in-one Kubernetes observability for infrastructure and apps teams
Runtimes
Java
Automatic and intelligent end-to-end observability for Java applications.
.NET
Automatic end-to-end observability for .NET applications and processes.
Go
Automatic and intelligent end-to-end observability for Go applications.
Node.js
Automatic and intelligent end-to-end observability for Node.js applications.
Python
End-to-end observability for your Python applications.
PHP
Automatic and intelligent end-to-end observability for PHP applications.
Observability frameworks
OpenTelemetry
Ingest OpenTelemetry traces & metrics, pin them to a dashboard, set alarms, analyze them in the context of metric, log, and diagnostic data.
Micrometer
Automatically ingest Spring Application metrics and analyze them end-to-end in context of your trace, log and diagnostics data.
Prometheus
Prometheus is an open-source monitoring toolkit for collecting and alerting on infrastructure and platform metrics.
Fluentd
Stream log data to Dynatrace via Fluentd for analysis.
Fluent Bit
Stream log data to Dynatrace via Fluent Bit for analysis.
Logstash
Stream log data from Logstash and analyze it in Dynatrace.
Serverless
AWS Lambda
Automatic and intelligent end-to-end observability for AWS Lambda traces.
Azure Functions
Intelligent end-to-end observability for serverless and hybrid environments using Azure Functions.
Google Cloud Functions
E2E observability for serverless and hybrid environments using Google Functions.
Azure App Service
Intelligent end-to-end observability for serverless and hybrid environments using Azure App Services.
Azure Container Instance
Deploy and manage serverless containers on the Microsoft Azure cloud, without having to manage any underlying infrastructure.
Google Cloud Run
Dynatrace provides AI-powered observability into serverless containerized apps running on Google Cloud Run.
Databases
Redis
Automatically and intelligently observe, analyze & optimize your Redis server.
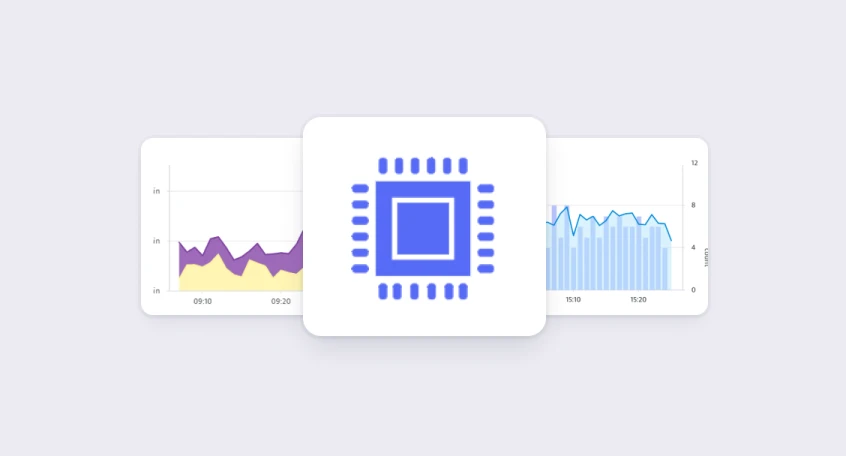
MySQL
Automatically and intelligently observe, analyze and optimize how your the usage, health and performance of your database.
Apache Cassandra
Improve Apache Cassandra observability
Couchbase
Automatically observe the usage, health and performance of your database.
Message queues
Apache Kafka
Automatic and intelligent observability with trace and metric insights.
RabbitMQ
Automatic and intelligent observability for RabbitMQ with end-to-end traces of connected producers and consumers.
Apache ActiveMQ Classic
Automatic and intelligent observability for ActiveMQ with trace and metric insights.
Apache ActiveMQ Artemis
Automatic and intelligent observability for ActiveMQ Artemis with end-to-end traces of connected producers and consumers.
Microsoft Message Queuing (MSMQ)
Automatic and intelligent observability for MSMQ with end-to-end traces of connected producers and consumers.
Application stacks
Reactor Core
End-to-end trace your applications when the Reactor Core publishers Mono and Flux are used.
Spring
Automatic and intelligent end-to-end observability for your Java Spring applications.
Netty
End-to-end observability for your Netty web framework with code-level insight.
IBM WebSphere Application Server
Automatically and intelligently monitor, analyze, and optimize your application server and all applications deployed anywhere in your stack.
Sencha ExtJS
JavaScript application framework for building interactive cross platform web applications.
Vert.x
Extend observability by seamlessly integrating OpenTracing data emitted by the Vert.x web framework into PurePath® distributed traces.
More resources
Connection Pools: Apache Commons
Application method of pooling and sharing multiple connections to a database.
Eclipse Jetty
Automatically and intelligently monitor and analyze your Jetty applications.
KVM
Monitor health and performance of KVM virtual machines from the system’s perspective.
OneAgent
The simplest way to capture all observation signals automatically and in context.
Angular
Platform for building mobile and desktop web applications.
QEMU
Monitor health and performance of QEMU virtual machines from the system’s perspective.
Oracle JRockit
Automatically and intelligently monitor, analyze, and optimize the performance of your virtual machine.
Garden-RunC
Automated distributed tracing and metrics for microservices running in garden runc containers in Cloud Foundry.
IBM Semeru
Automatically and intelligently monitor, analyze, and optimize the performance of your virtual machine.
IBM CICS Transaction Gateway for z/OS
Intelligently monitor your transactions end-to-end and analyze the performance of your CICS Transaction Gateway on z/OS.
Akka
Automatically and intelligently monitor, analyze, and optimize your applications developed with Akka.
IBM HTTP Server
Automatically and intelligently monitor, analyze, and optimize your applications developed with IBM HTTP Server.
Xen
Monitor health and performance of Xen virtual machines from the system’s perspective.
Apache Zookeeper
Monitor and analyze your Apache Zookeeper with this JMX-based extension
MuleSoft
Event source enabling you to set up an HTTP server and trigger flows when requests are received.
OpenTracing
Ingest and chart OpenTracing data, set alerts, and analyze everything in the context of traces, metrics, logs, and diagnostics data.
Eclipse OpenJ9
Automatically and intelligently monitor, analyze, and optimize the performance of your virtual machine.
Azul Platform Core (Zulu)
Automatically and intelligently monitor, analyze, and optimize the performance of your virtual machine.
Apache OpenEJB
Automatically and intelligently monitor, analyze and optimize your applications based on Apache OpenEJB.
Laravel
Automatically and intelligently monitor, analyze, and optimize your applications developed with Laravel.
Yii
Automatically and intelligently monitor, analyze, and optimize your applications developed with Yii.
StatsD
The easiest way to get you custom application metrics into Dynatrace.
OpenShift Control Plane
Get deep insights into your OpenShift control plane using metrics exposed by various control plane components.
Perl
Perl is a family of two high-level, general-purpose, interpreted, dynamic programming languages.
OpenJDK
Automatically and intelligently monitor, analyze, and optimize the performance of your virtual machine.
Oracle HTTP Server
Web server component for Oracle Fusion Middleware.
Disk Analytics
This extension allows more detailed visibility on Linux hosts' local datastores where OneAgent is installed.
Linux on IBM Z mainframe
Automatic insights into your Linux operating system on IBM Z mainframe with performance and health metrics down to the process level.
Oracle WebLogic
Automatically and intelligently monitor, analyze, and optimize your application server and all applications deployed anywhere in your stack.
Red Hat Enterprise Linux
Scale existing apps across bare-metal, virtual, container, and all types of cloud environments.
Symfony
Automatically and intelligently monitor, analyze, and optimize your applications developed with Symfony.
Ember.js
Open-source JavaScript web framework, based on the Model–view–viewmodel pattern.
Drupal
Web content management for back-end framework.
Hazelcast
Dynatrace PurePath® technology seamlessly integrates OpenTracing data for Java emitted by the Hazelcast in-memory computing platform.
SAP Business Technology Platform
SAP Business Technology Platform (SAP BTP) is the technological foundation for the intelligent enterprise.
BOSH bpm
Automated monitoring of platform processes running in BOSH bpm containers.
IBM Cloud Foundry
Set of cloud computing services for business offered by the information technology company IBM.
Apache TomEE
Automatically and intelligently monitor, analyze, and optimize your application server and all applications deployed anywhere in your stack.
Nutanix AHV
Monitor health and performance of Nutanix AHV virtual machines from the system’s perspective.
VMware ESXi Host
Monitor health and performance of VMware ESXi virtual machines from the system’s perspective.
Apache CXF
Open-source, fully featured Web services framework.
Express
Fast, unopinionated, minimalist web framework for Node.js.
jQuery
JavaScript library designed to simplify HTML DOM tree traversal and manipulation.
SAP JVM
Automatically and intelligently monitor, analyze, and optimize the performance of your virtual machine.
VMware vCenter Server
Monitor health and performance of VMware vCenter Server virtual machines from the system’s perspective.
Play Framework
Automatically and intelligently monitor, analyze, and optimize your applications developed with Play Framework.
Apache Camel
Intelligently monitor, analyze, and optimize your integration framework and all applications deployed in your stack.
BellSoft Liberica
Automatically and intelligently monitor, analyze, and optimize the performance of your virtual machine.
Are you looking for something different?
We have hundreds of apps, extensions, and other technologies to customize your environment