Make the most of your trial
With so much to do, we've created a 7-day plan to make sure you get the most out of your experience.
Click each day below for more details.
Create an insanely cool custom dashboard
Don't you want to create some amazing tiles that you can show off?
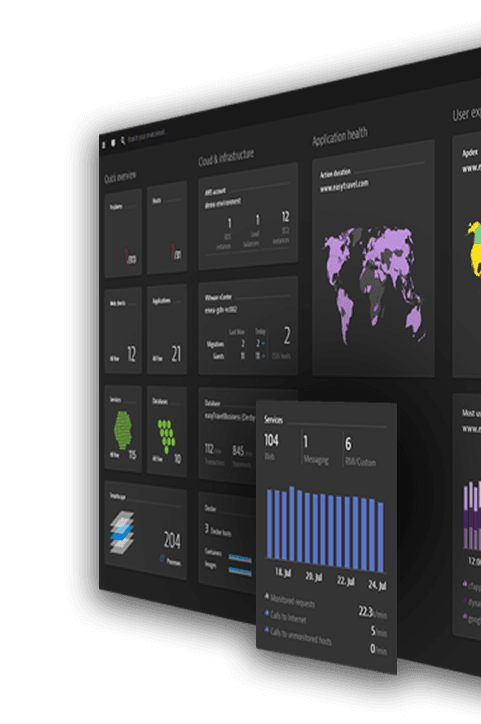
Our engineers tell us it’s not really about dashboards, because our AI is surfacing up all the answers. But c’mon, seriously? When the dashboards look this good, don’t you want to create some amazing tiles that you can show off?
Each application environment is built on a unique set of hosts, services, and infrastructure components, and each team in your organization has different workflow requirements. To make reporting easy, Dynatrace gives you the ability to create, modify, delete, and switch between dashboards.
So, let’s do it. Dive back in and let’s create some cool data models and reports that will make you look like a rockstar.
Just select ‘create dashboard’ or view our step-by-step guide.
Show off your dashboards with the team
Analyzing your data is an important part of identifying and fixing issues.
Analyzing your data is an important part of identifying and fixing issues. We sort of took the fun out of that with AI that gives you answers. But, alas some folks still like to dive into the details. So once you’ve created your stellar dashboard, share it with your team.
There are two approaches to sharing a dashboard:
- Share dashboard via link. Anybody who has the link can view the dashboard, but they can't modify the dashboard.
- Share dashboard with specific users. Only selected users can view the dashboard. You can also assign permission for modifying shared dashboards.
You can only share dashboards with team members who have an account in the same environment. But that’s cool, right?
Stop wasting time with alerts
Our AI will surface up the problem. And then replay it.
Get answers — not more data. And once you discover the answer, replay it in all it’s glory. (Replaying problems is evil, but fun. “Check it out, look that’s where it breaks, and then it breaks all this stuff.”)
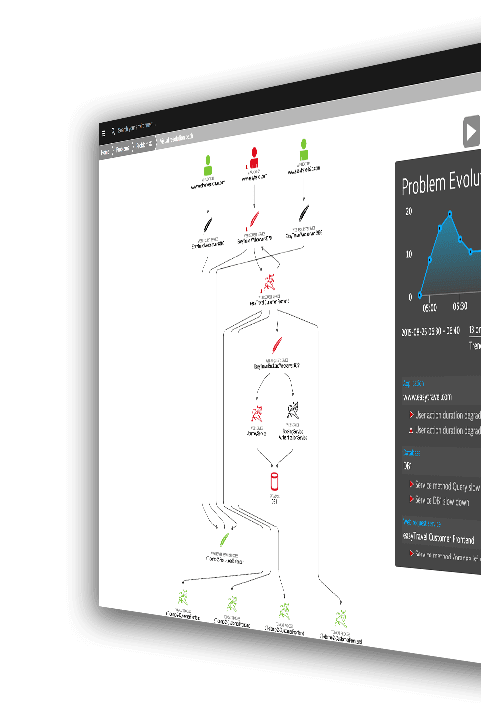
Our Problem Evolution player combines and presents all events that contribute to performance degradation and, instead of sending you individual alert messages for each insignificant or unrelated event, we show you the whole story. You can then grab the popcorn, and watch as we show you each issue from the point where it started, through root-case analysis, and all the way to its ultimate resolution.
Welcome to our Smartscape
A galaxy of dependencies, neatly organised.
The Smartscape is a thing of beauty. It provides a real-time view of all the components and processes in your environment, and the best part – you don’t have to do a thing. It’s ok, you can ask us, because others do – “how did you do that?”
Honestly I’m not sure. But our engineers are clever.
Out of the box Smartscape shows you:
- Cross-tier and same-tier process, service, and dependencies
- Performance of dependencies and their impact on performance
- Third-party dependencies and their impact on performance
- Host communication
- Quick access to detail drill-downs
Search and you will find
Digging through your environment no longer needs to be time consuming.
Digging through your environment no longer needs to be time consuming (like finding your keys). With Dynatrace super search, you can search for virtual and physical hosts, applications, services, processes, and other entities by name!
But I still haven’t found what I’m looking for. Thanks Bono, but if you are still lost, you can also use the search box to get a list of all discussion threads in our Answers forum, links to all related Dynatrace Help topics, and helpful blog posts.
Time to customize your metrics
Your custom metrics only tell half the story.
Your custom metrics only tell half the story — the way you display metrics finishes the narrative. Once you’ve chosen which custom metrics give you the most insight into your users and environment, customize how they will be displayed on Custom Device and Custom Device group pages.
To get started:
- Edit the plugin JSON UI section and the chart definitions.
- Choose between three series types — line, bar, and area
- Define the method to aggregate the minute values
Implement user-session segmentation
Understand how individual users with common characteristics experience your apps.
Effective user-session segmentation is the key to understanding how individual users who share common characteristics experience your apps.
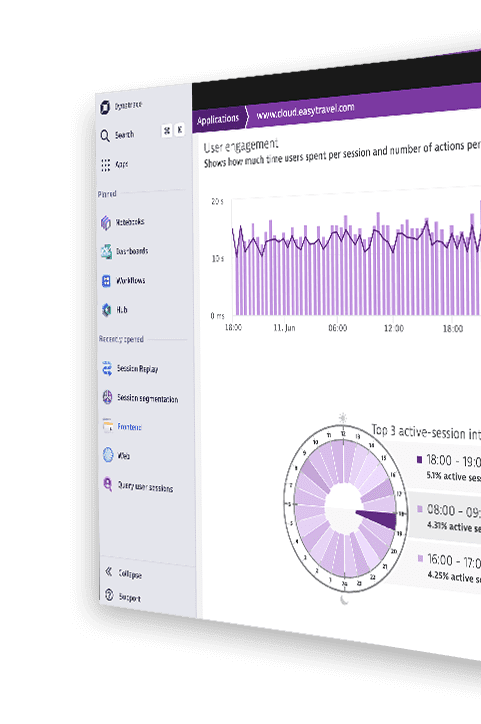
Dynatrace user session analysis enables you to slice, dice, and combine your user sessions into meaningful segments based on shared characteristics of individual user sessions. For example, you might segment your analysis based on browser type. In this way, you can drill deeply into aggregate results to discover meaningful insights into performance problems that may only be experienced by a small subset of your users.
Ready to take Dynatrace to the next level?
Reach out to our trial experts today for more information, or to see if you qualify for an extension.
Schedule a meeting


