Log Management and Analytics
Log Management and Analytics, powered by Grail, provides a unified approach to unlocking the value of log data in the Dynatrace platform.
Hassle-free management of your log data lets you store petabytes of data without schemas, indexing, or rehydration. All of that data is usable at any time for any analytics task. Thanks to schema on-read and the Dynatrace Query Language, there's no need to decide what you want to query during data ingestion. Pick the retention period for your data that fits your business and compliance needs, whether debugging or audit.
After using OneAgent or the generic ingestion API to bring your log data into Dynatrace, you can observe the data in the context of your full stack, including real user impacts or traces. Dynatrace Log Management and Analytics allows you to automate your log tasks.
Automatically see precise problem root causes in real time to simplify cloud complexity.
Automate operations and trigger remediation workflows to enhance efficiency.
Automatically ingest logs, metrics, and traces, with continuous dependency mapping and precise context across hybrid and multicloud environments.
Quick start guide
Ingest logs
Define OneAgent log ingest rules to bring in automatically discovered logs.

Manage logs
Store your log data in data retention buckets based on specific retention periods.

Log analytics
Explore basic Log Management and Analytics examples of how to use log data in Dynatrace powered by Grail.

Logs on dashboards
Create customized and cost-effective dashboards based on your logs.

Problems and automations
Create anomaly detection metric and automate the detection process.

Further resources
Explore the most common Log Management and Analytics use cases in Dynatrace deployments.

Log data can come from diverse sources including Kubernetes, technology stacks, cloud services, custom API integrations or Dynatrace extensions. Dynatrace employs OneAgent and API as key methods for ingesting logs from these sources. The ingested logs are channeled to Dynatrace for processing, analysis and storage.
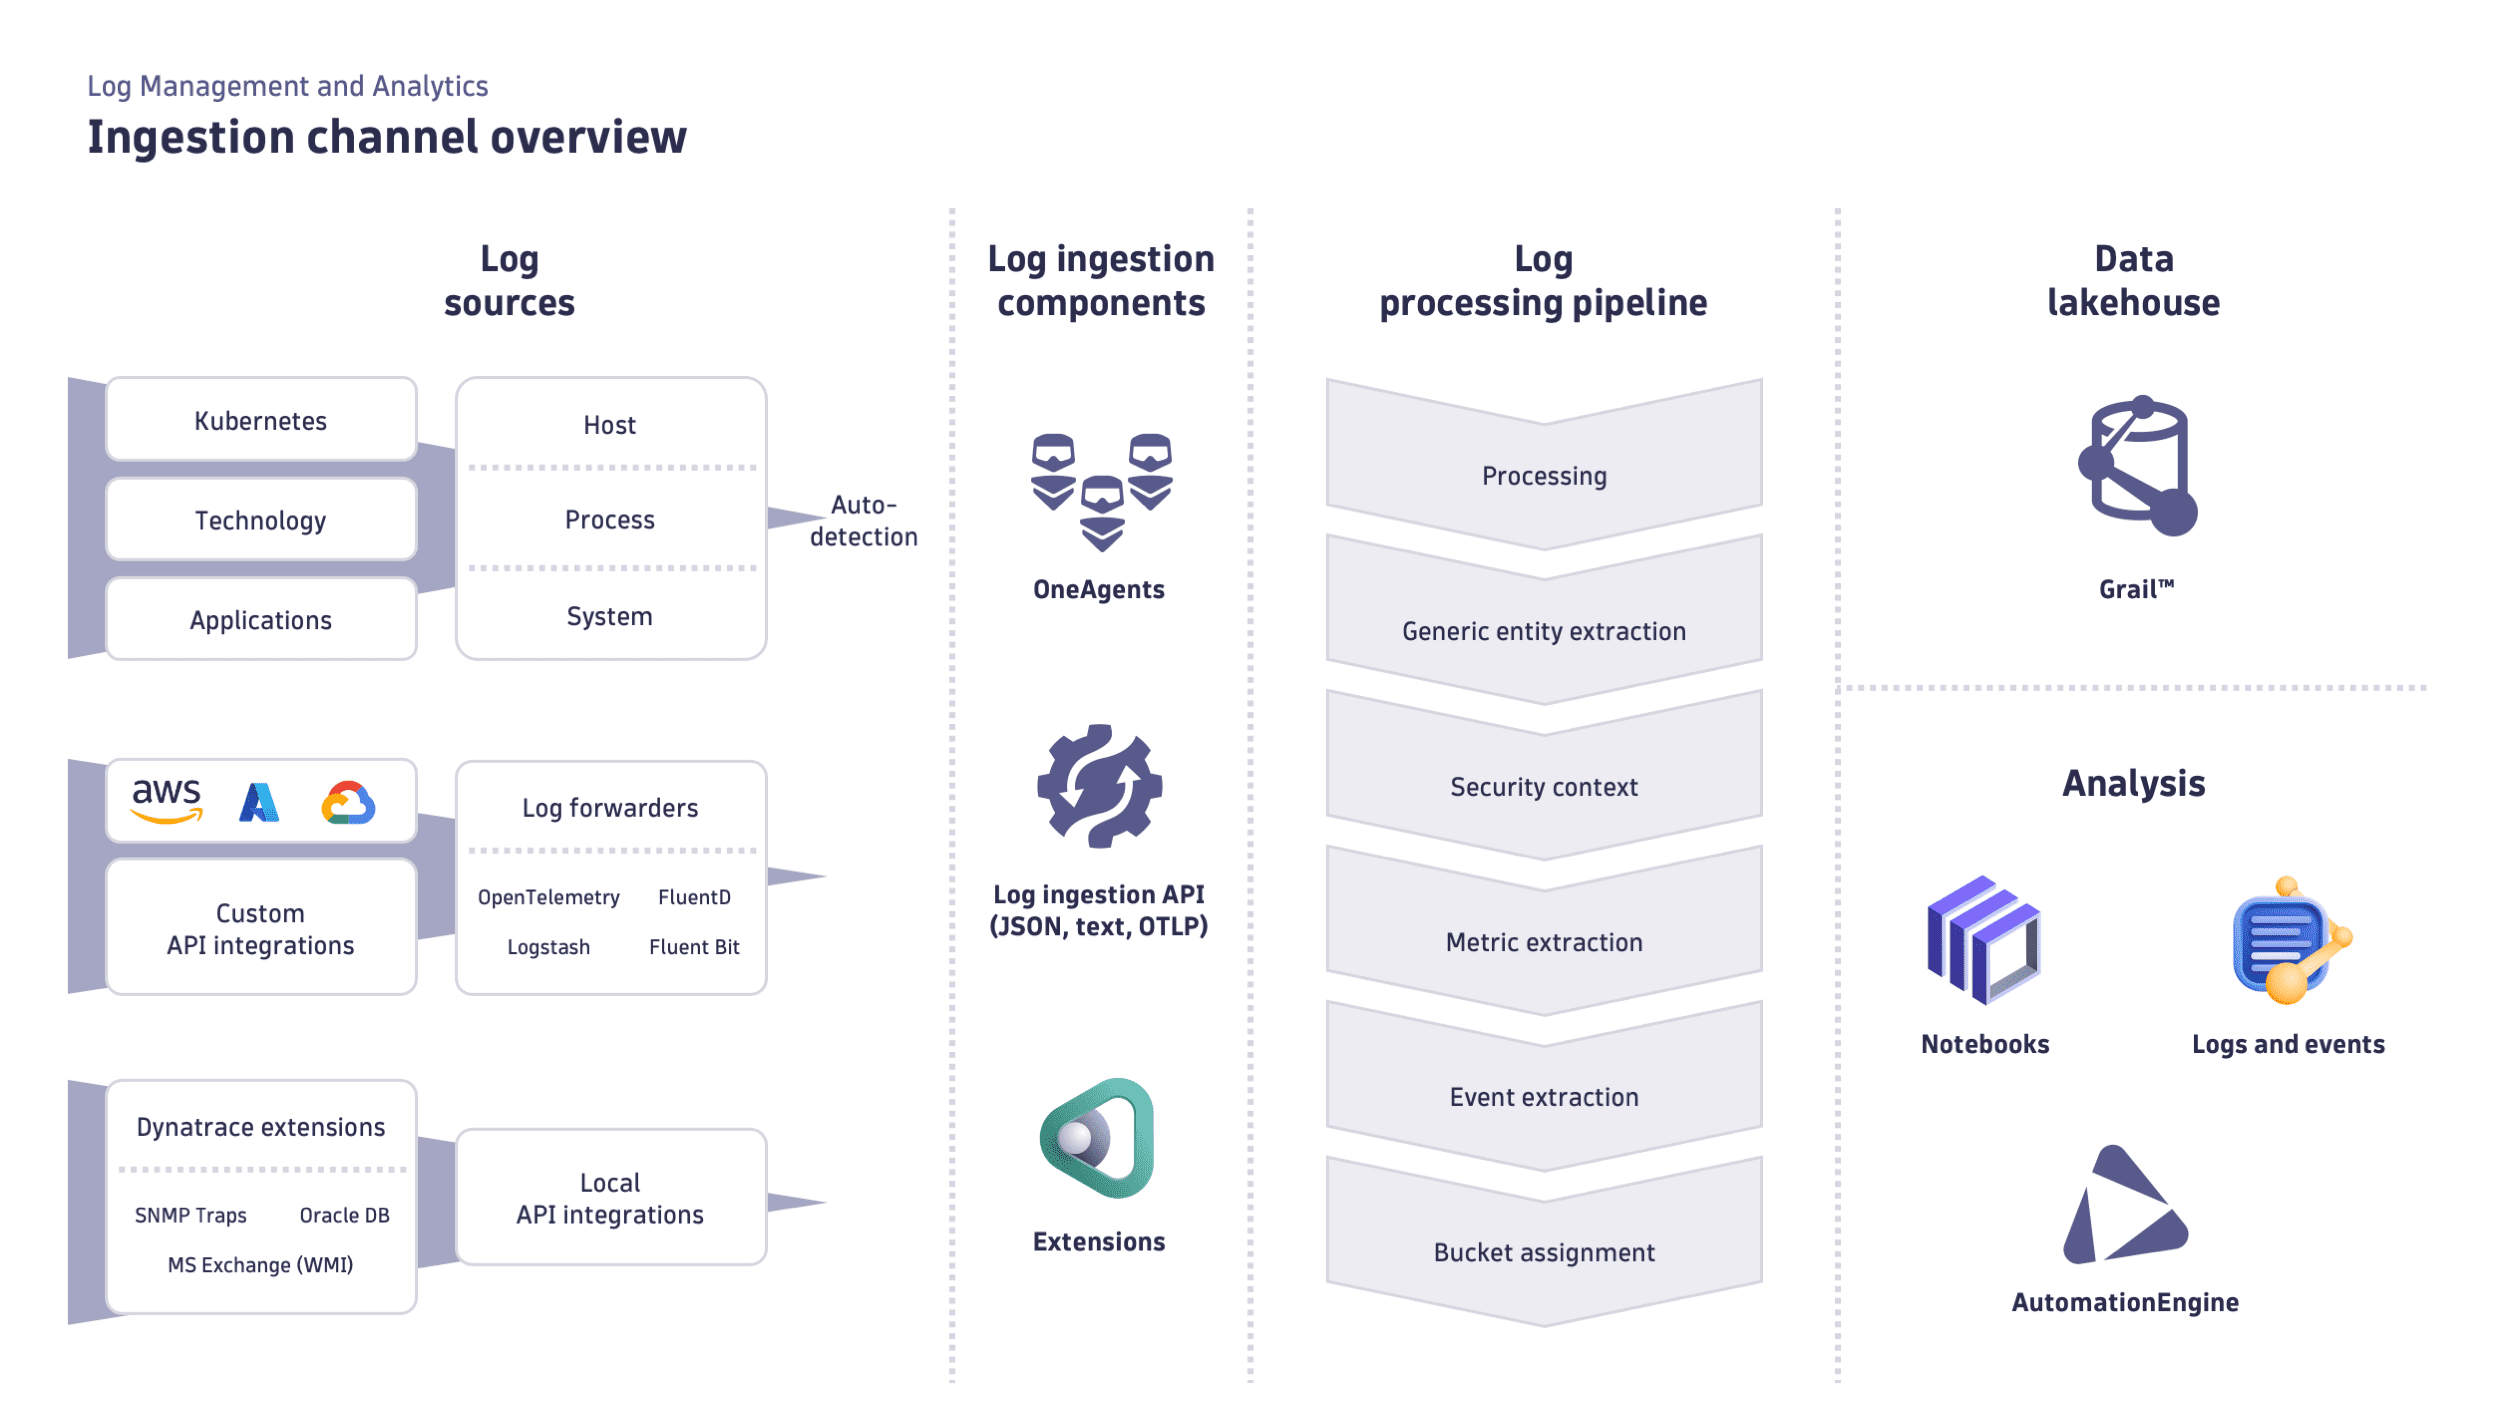
The Grail data lakehouse serves as a single unified storage solution where log data is interconnected within a real-time model that reflects the topology and dependencies within a monitored environment. You can analyse the ingested data by using Notebooks, and run queries in Logs and events to gather a comprehensive understanding of your log data.

Consumption model
The consumption model for Log Management and Analytics is based on three dimensions of data usage (Ingest & Process, Retain, and Query). The unit of measure for consumed data volume is gibibytes (GiB). For details, see Log Management and Analytics (DPS).
Availability and previous versions
Log Management and Analytics is the latest log offering available in Dynatrace SaaS with Grail.