Analyze Go metrics
Dynatrace OneAgent tracks numerous Go-related metrics.
The Go metrics and Go HTTP metrics tabs on the process overview page contain the most important Go-specific and HTTP metrics. The Go managed memory, Heap details, and Scheduling tabs—all accessible via the Further details tab—bring even more valuable insights into your Go-based application performance.
Key metrics
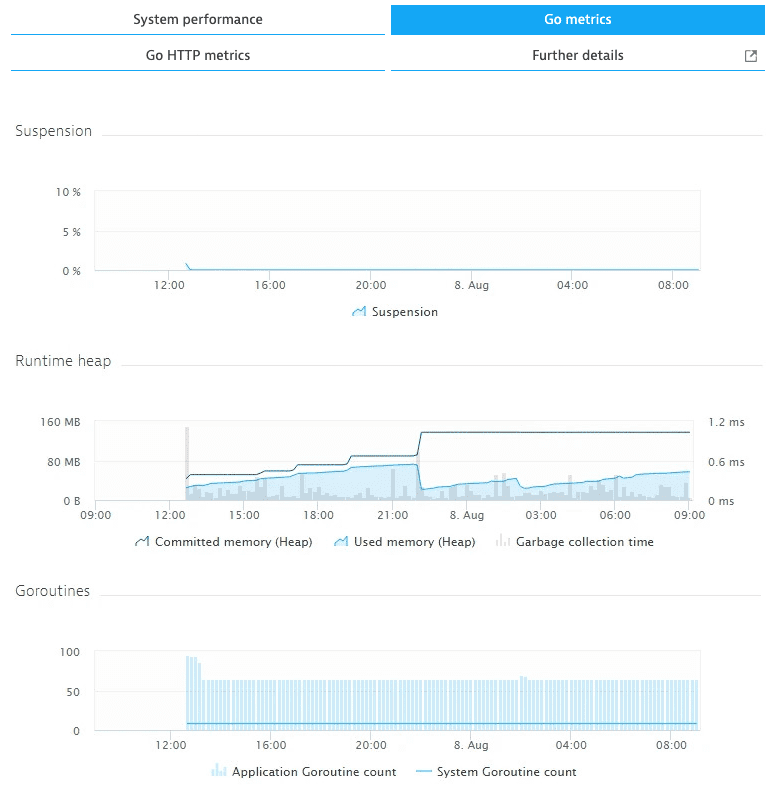
The Go metrics tab provides an overview of the following important Golang metrics:
- Suspension: The Go garbage collector percentage share compared to the overall application CPU time.
- Runtime heap: The amount of memory used or committed to the Go heap as well as Go garbage collection times.
- Goroutines: The number of Goroutines instantiated by the application and Go runtime infrastructure.
HTTP metrics
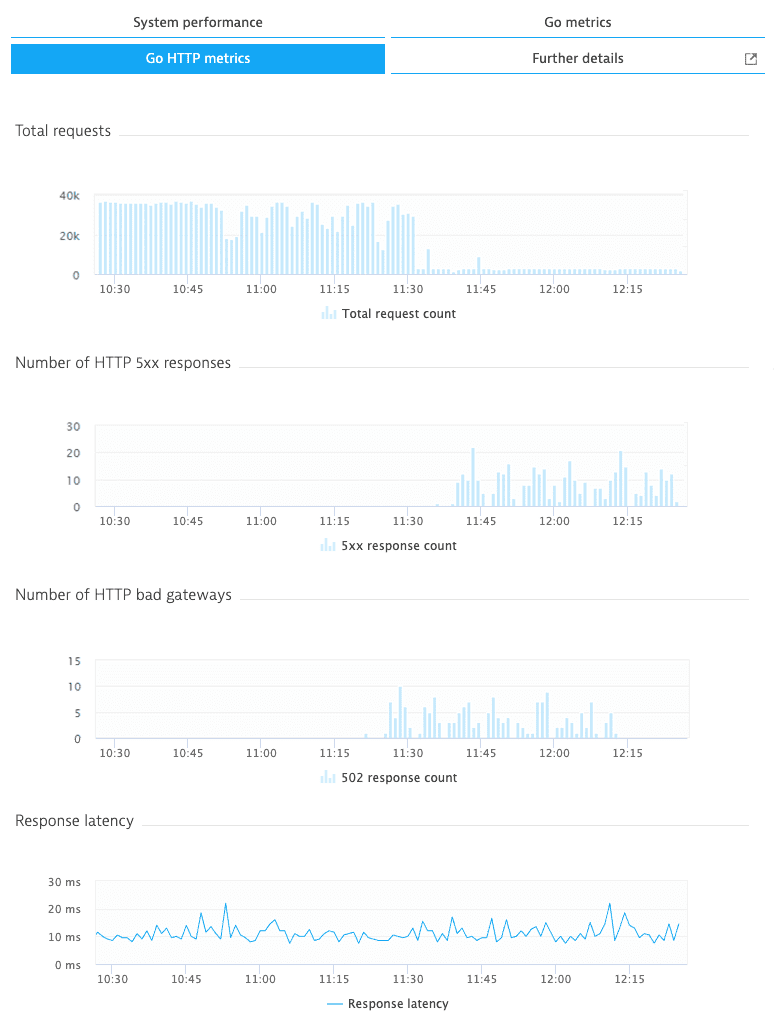
On the Go HTTP metrics tab, you can explore the following HTTP metrics:
- Total requests: The number of all requests representing the overall traffic flow.
- Number of HTTP 5xx responses: The number of responses that indicate repeatedly crashing apps or response issues from applications.
- Number of HTTP bad gateways: The number of responses that indicate invalid service responses produced by an application.
- Response latency: The average response time from the application to clients.
Go managed memory
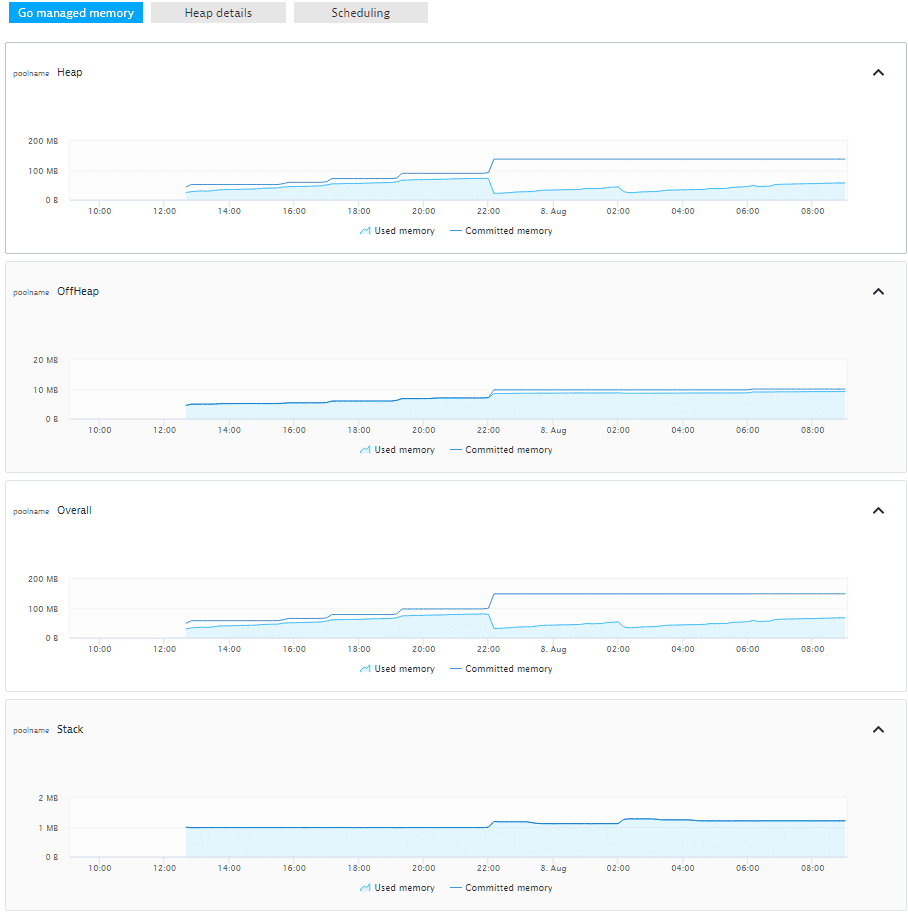
The Go managed memory tab breaks down memory metrics into various categories:
- Heap: The amount of the memory used or committed to Go runtime heap.
- OffHeap: The amount of the memory used or committed to Go runtime internal structures that are not allocated from heap memory. Data structures used in the Go heap implementation are an example of OffHeap memory.
- Overall: The sum of Heap, OffHeap, and Stack memory.
- Stack: The amount of the memory used or committed to dynamic Go stacks. Go stacks are used to execute Goroutines and grow dynamically.
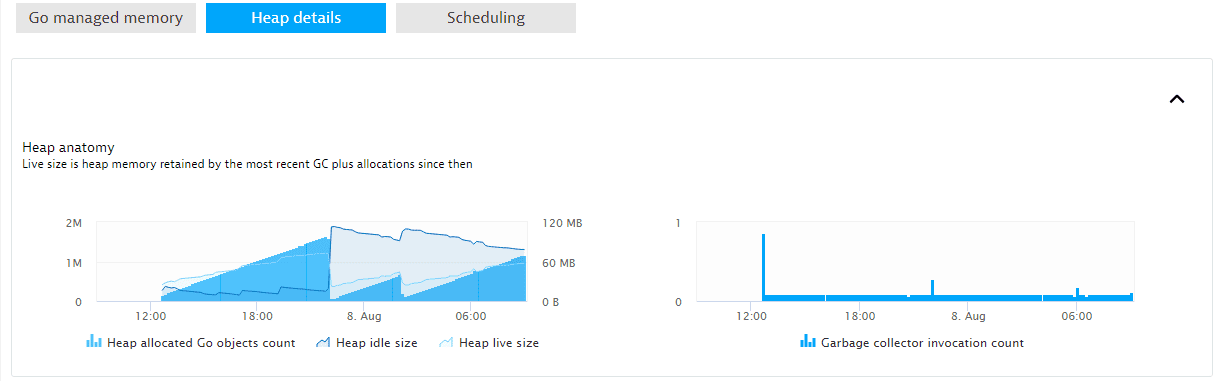
Heap details
The Heap details tab digs deeper into the anatomy of the Go heap.
- Heap allocated Go objects count: The number of Go objects allocated on the Go heap.
- Heap idle size: The amount of memory not assigned to the heap or stack. Idle memory can be returned to the operating system or retained by the Go runtime for later reassignment to the heap or stack.
- Heap live size: The amount of memory considered live by the Go garbage collector. This metric accumulates memory retained by the most recent garbage collector run and allocated since then.
- Garbage collector invocation count: The number of Go garbage collector runs.
Scheduling
A basic understanding of the internal scheduling principles will help you read scheduling metrics and detect potential anomalies.
The implementation of Goroutine scheduling deals with three central object types: M (Machine), P (Processor), and G (Goroutine). You can find multiple instances of these object types in the Go runtime source code. For simplicity's sake, Dynatrace uses the following alternative terms:
| Go runtime term | Dynatrace term |
|---|---|
| M (Machine) | Worker thread |
| P (Processor) | Scheduling context |
| G (Goroutine) | Goroutine |
Go executes Goroutines in the context of worker threads that are acquired from a pool of native operating system threads. A Goroutine can be assigned to a different worker thread at any time unless runtime.LockOSThread is used to enforce worker thread affinity.
Multiple Goroutines are usually assigned to a single worker thread. A scheduling context is responsible for the cooperative scheduling of Goroutines. The Go compiler adds code to each Go function prologue that checks if the currently executed Goroutine consumed its 10 milliseconds execution time slice. The actual mechanism cleverly uses stack guards to enforce rescheduling. If the time slice has exceeded, the scheduling context sets up the next Goroutine to execute. Prior to Go 1.14, scheduling was fully cooperative, leading to an issue with Goroutines that didn't invoke Go functions and therefore were not rescheduled. Go 1.14 introduced a mechanism that allows preemptive scheduling of Goroutines to handle this special case.
Each set of Goroutines is executed by a worker thread. Execution is controlled by a scheduling context. When a Goroutine writes a large chunk of data to the disk or blocks waiting for an incoming connection, the Goroutine is blocked in a system call, and no other Goroutine is scheduled. In such a situation, the scheduling context with other Goroutines is assigned to a different worker thread, either parked or newly instantiated. These Goroutines are not blocked by the system call and can continue execution. Therefore, the total number of worker threads is greater than the number of scheduling context objects. After the blocking call returns, the Goroutine is again assigned to a scheduling context. If the assignment fails, the Goroutine is sent to the global Goroutine run queue. The same principle applies to cgo (Go to C language) calls.
The number of scheduling contexts is the only setting that you can configure in the Go scheduling algorithm. You have no control over the number of worker threads. That is why writing a large chunk of data to the disk or waiting for incoming connections won't block other Goroutines that are initially assigned to the same worker thread. These Goroutines continue execution on their newly assigned worker threads.
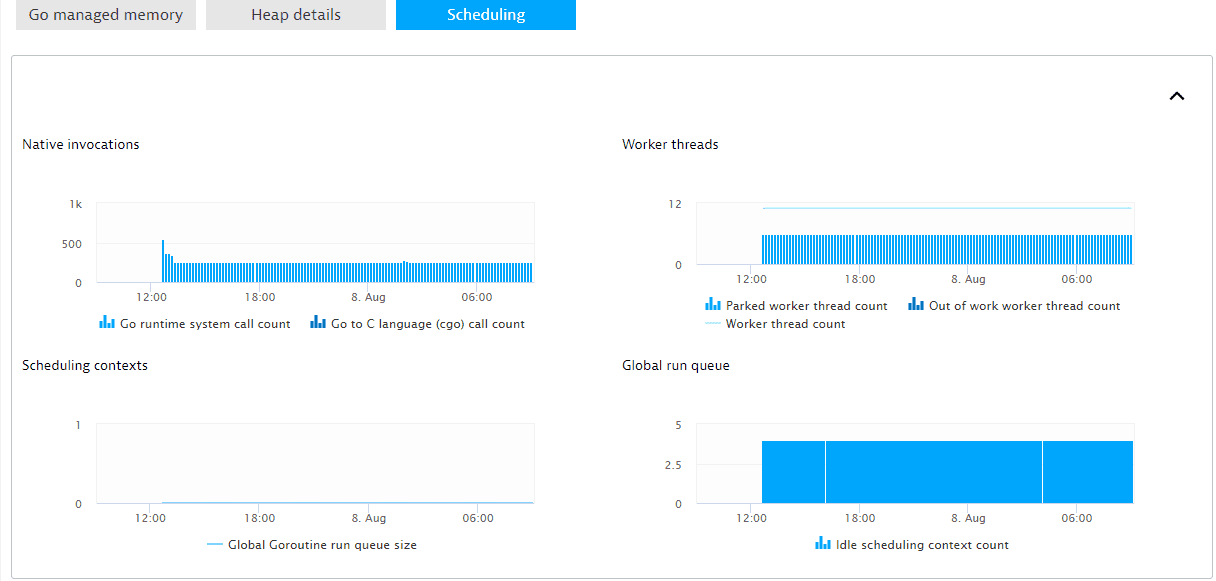
The Scheduling tab provides unique insights into Goroutine scheduling.
- Go runtime system call count: The number of system calls executed by the Go runtime. This number doesn't include system calls performed by user code.
- Go to C language (cgo) call count: The number of cgo calls.
- Parked worker thread count: The number of worker threads parked by Go runtime. A parked worker thread doesn't consume CPU cycles until the Go runtime unparks the thread.
- Out-of-work worker thread count: The number of worker threads whose associated scheduling context has no more Goroutines to execute. When this happens, the worker thread attempts to steal Goroutines from another scheduling context or the global run queue. If the stealing fails, the worker thread parks itself after some time. This same mechanism applies to a high workload scenario. When an idle scheduling context exists, the Go runtime unparks a parked worker thread and associates it with the idle scheduling context. The unparked worker thread is now in the "out of work" state and starts Goroutine stealing.
- Worker thread count: The number of operating system threads instantiated to execute Goroutines. Go doesn't terminate worker threads; it keeps them in a parked state for future reuse.
- Global Goroutine run queue size: The number of Goroutines in the global run queue. Goroutines are placed in the global run queue if the worker thread used to execute a blocking system call can't acquire a scheduling context. Scheduling contexts periodically acquire Goroutines from the global run queue.
- Idle scheduling context count: The number of scheduling contexts that have no more Goroutines to execute and for which Goroutine acquisition from the global run queue or other scheduling contexts has failed.