Azure Time Series Insights (Environment, Event Source) monitoring
Dynatrace ingests metrics from Azure Metrics API for Azure Time Series Insights (Environment, Event Source). You can view metrics for each service instance, split metrics into multiple dimensions, and create custom charts that you can pin to your dashboards.
Prerequisites
- Dynatrace version 1.203+
- Environment ActiveGate version 1.195+
Enable monitoring
To learn how to enable service monitoring, see Enable service monitoring.
View service metrics
You can view the service metrics in your Dynatrace environment either on the custom device overview page or on your Dashboards page.
View metrics on the custom device overview page
To access the custom device overview page
- Go to Technologies & Processes or Technologies & Processes Classic (latest Dynatrace).
Filter by service name and select the relevant custom device group.
- Once you select the custom device group, you're on the custom device group overview page.
- The custom device group overview page lists all instances (custom devices) belonging to the group. Select an instance to view the custom device overview page.
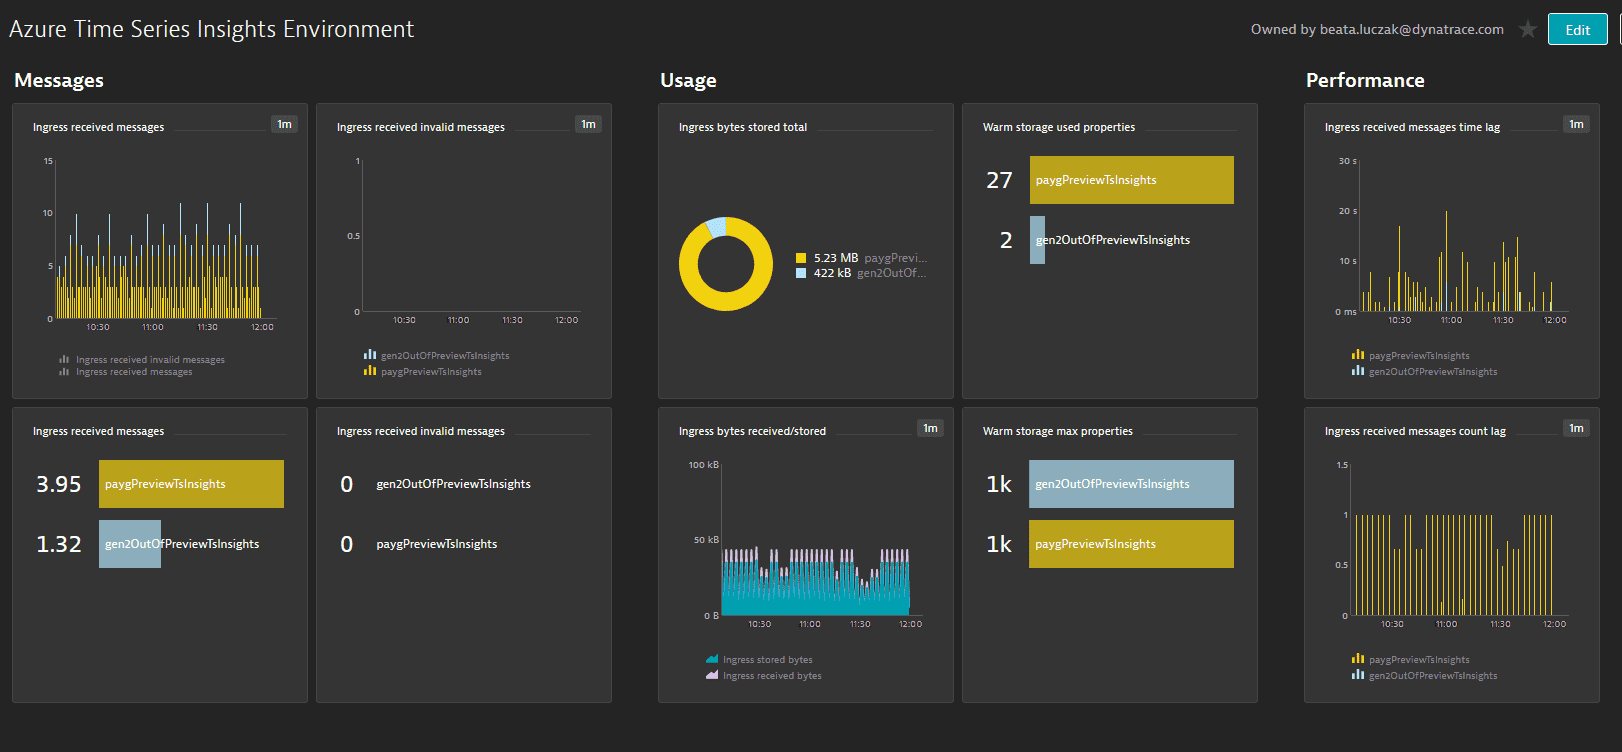
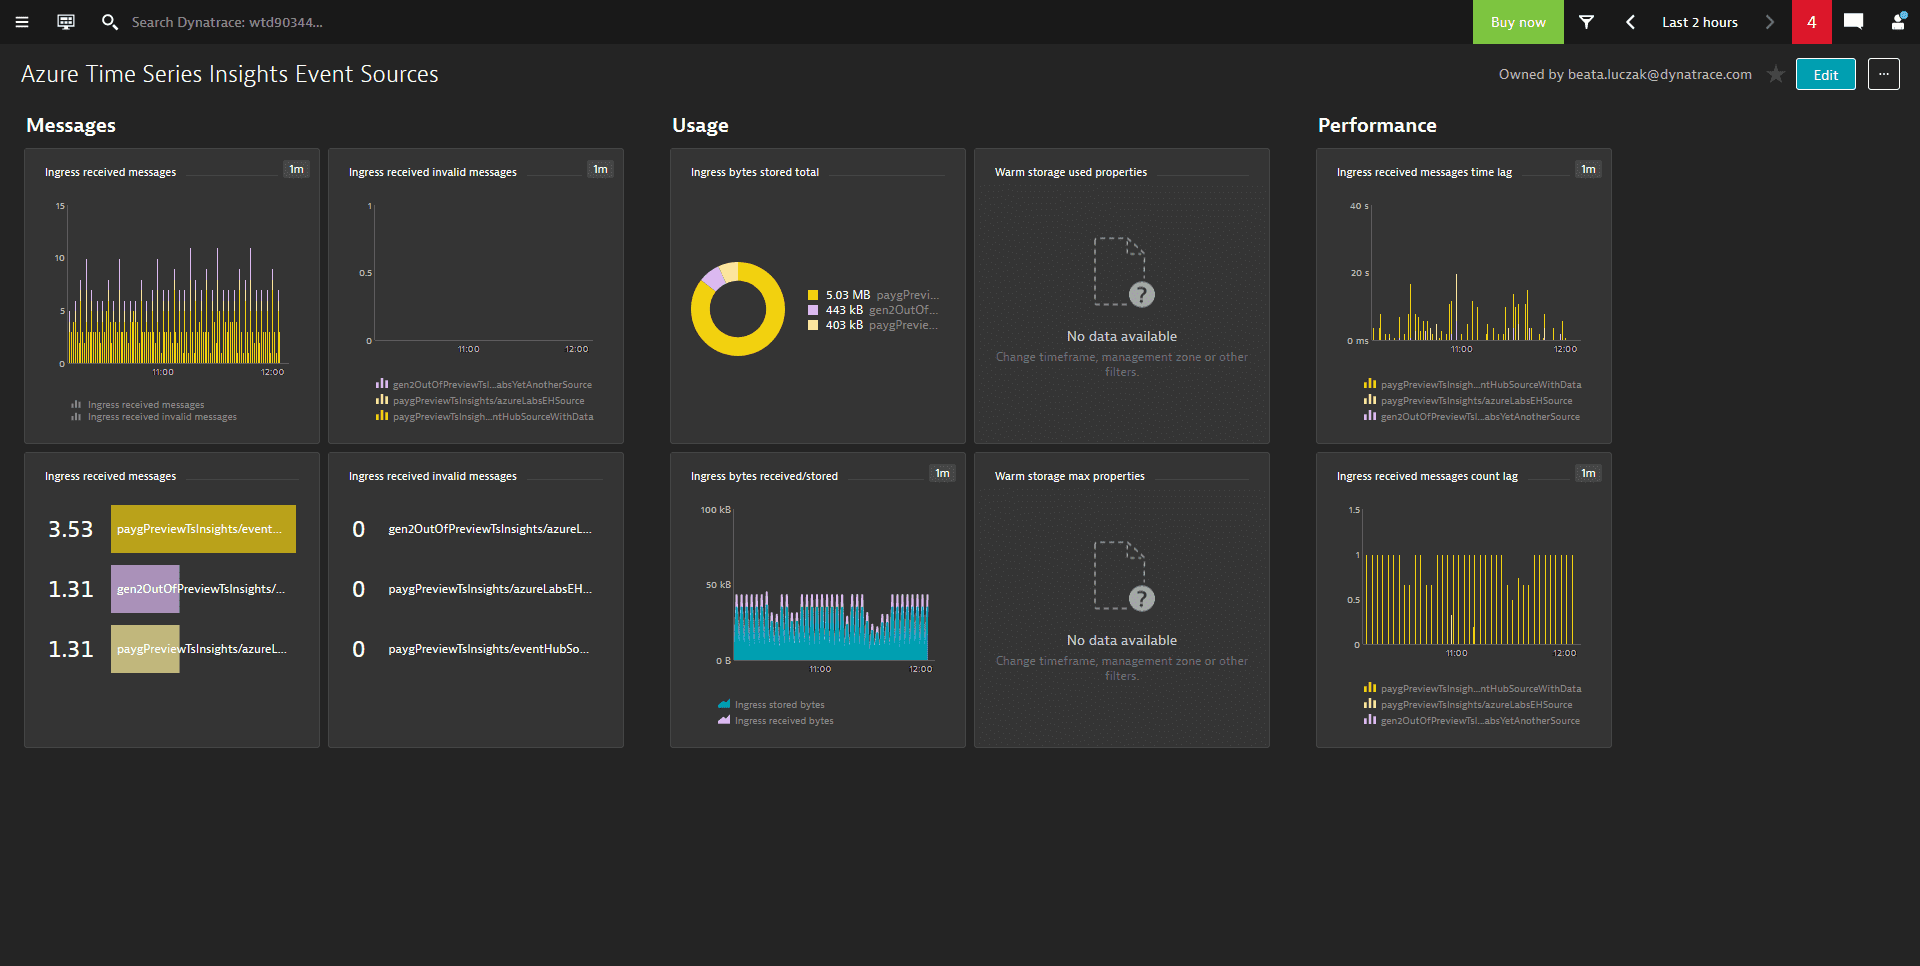
View metrics on your dashboard
Once you add a service to monitoring, a preset dashboard for the respective service containing all recommended metrics is automatically created on your Dashboards page. You can look for specific dashboards by filtering by Preset and then by Name.
For existing monitored services, you might need to resave your credentials for the preset dashboard to appear on the Dashboards page. To resave your credentials, go to Settings > Cloud and virtualization > Azure, select the desired Azure instance, then select Save.
You can't make changes on a preset dashboard directly, but you can clone and edit it. To clone a dashboard, open the browse menu (…) and select Clone.
To remove a dashboard from the dashboards list, you can hide it. To hide a dashboard, open the browse menu (…) and select Hide.
Hiding a dashboard doesn't affect other users.

Available metrics
| Name | Description | Unit | Recommended (Environment) | Recommended (Event Source) |
|---|---|---|---|---|
| IngressReceivedMessages | The number of messages read from all Event Hub or IoT Hub event sources | Count | ||
| IngressReceivedInvalidMessages | The number of invalid messages read from the event source | Count | ||
| IngressStoredBytes | The total size of events successfully processed and available for query | Byte | ||
| IngressReceivedBytes | The number of bytes read from all event sources | Byte | ||
| IngressStoredEvents | The number of flattened events successfully processed and available for query | Count | ||
| IngressReceivedMessagesTimeLag | The difference between the time that the message is enqueued in the event source and the time it is processed in ingress | Second | ||
| IngressReceivedMessagesCountLag | The difference between the sequence number of the last enqueued message in the event source partition and the sequence number of messages being processed in ingress | Count | ||
| WarmStorageMaxProperties | The maximum number of properties used allowed by the environment for S1/S2 SKU and the maximum number of properties allowed by warm store for PAYG SKU | Count | ||
| WarmStorageUsedProperties | The number of properties used by the environment for S1/S2 SKU and number of properties used by warm store for PAYG SKU | Count |