Azure IoT Hub (built-in)
For information about differences between classic services and other services, see Migrate from Azure classic (formerly "built-in") services to cloud services.
Dynatrace ingests metrics from Azure Metrics API for Azure IoT Hub. You can view metrics for each service instance, split metrics into multiple dimensions, and create custom charts that you can pin to your dashboards.
Prerequisites
Environment ActiveGate
- To disable monitoring of built-in services, you need Environment ActiveGate version 1.245+ and Dynatrace version 1.247+.
Enable monitoring
To learn how to enable service monitoring, see Enable service monitoring.
View service metrics
You can view Azure service metrics in your Dynatrace environment on the Azure subscription page or on your own dashboard.
View metrics on the Azure account page
To access metrics on the Azure account page
-
Go to Azure or Azure Classic (latest Dynatrace).
-
Choose the Azure subscription.
-
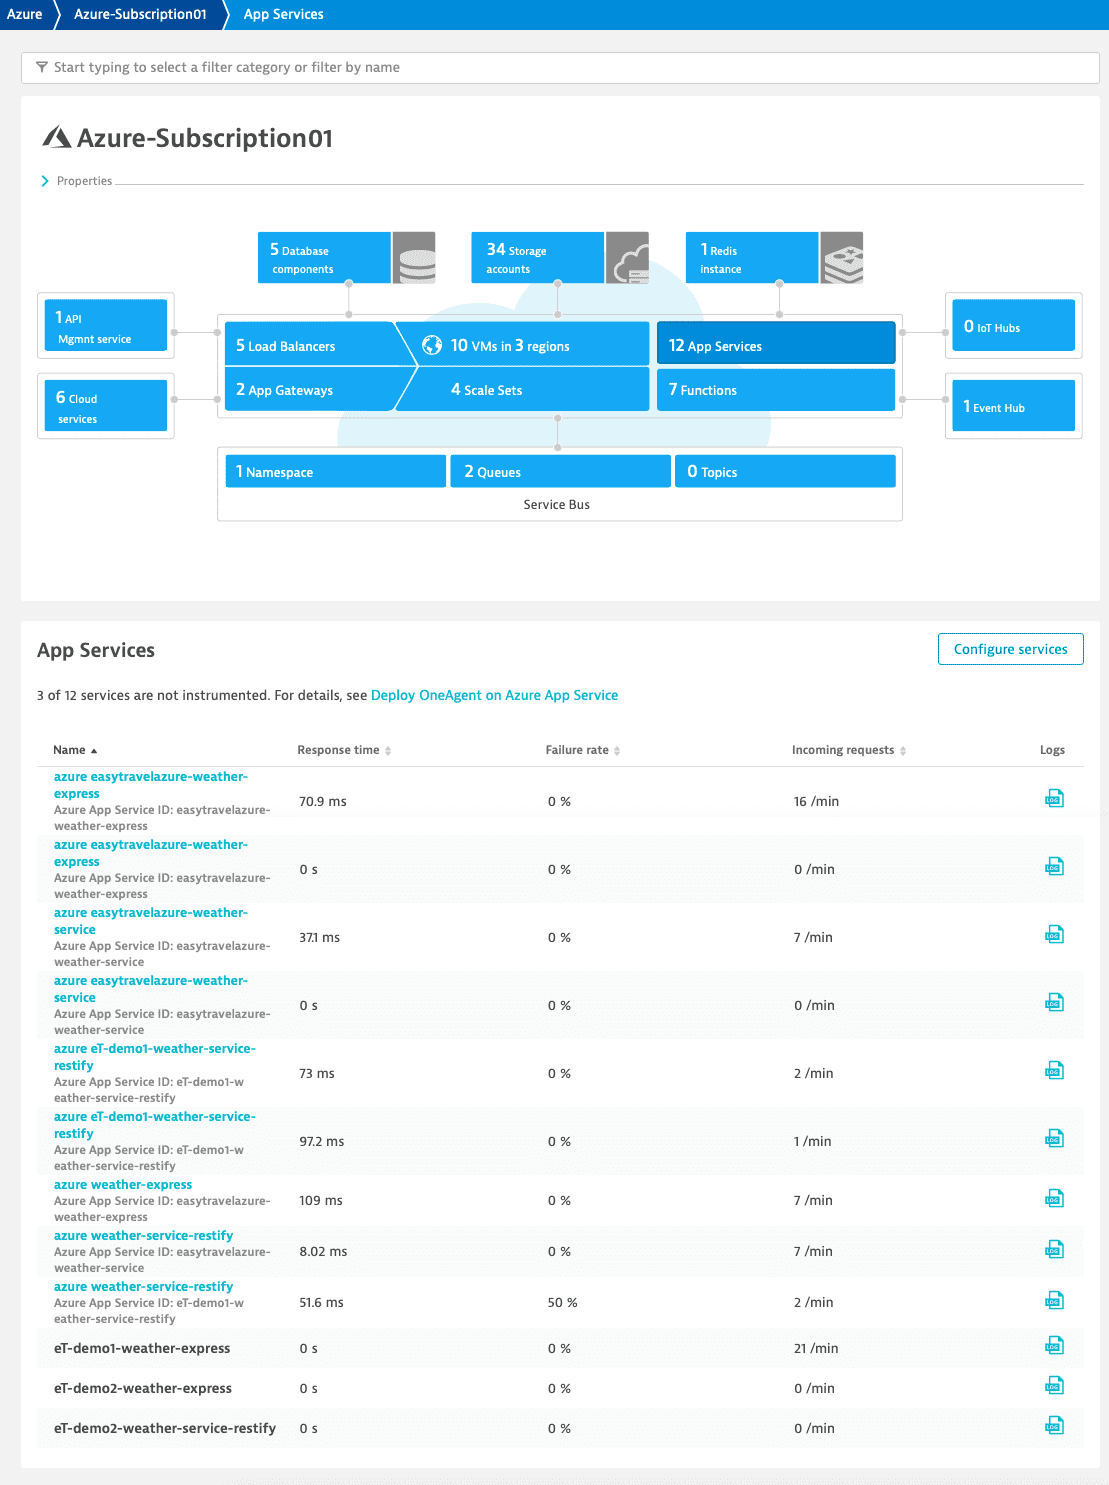
Select the service whose metrics you want to check. Metrics for the selected service are visible under the infographic in the service section, similarly to the example below.
View metrics on a dashboard
You can create your own dashboard for viewing Azure service metrics. For information on how to create dashboards, see Create and edit Dynatrace dashboards.
Available metrics
| Metric key | Name | Unit | Aggregations | Monitoring consumption |
|---|---|---|---|---|
| builtin:cloud | Commands abandoned | Count | autovalue | DDUs |
| builtin:cloud | Commands completed | Count | autovalue | DDUs |
| builtin:cloud | Commands rejected | Count | autovalue | DDUs |
| builtin:cloud | Connected devices | Count | autoavgmaxmin | DDUs |
| builtin:cloud | Number of throttling errors | Count | autovalue | DDUs |
| builtin:cloud | Total device data usage | Byte | autoavgmaxmin | DDUs |
| builtin:cloud | Total devices | Count | autoavgmaxmin | DDUs |
| builtin:cloud | Messages delivered to the built-in endpoint (messages/events) | Count | autovalue | DDUs |
| builtin:cloud | Message latency for the built-in endpoint (messages/events) | Millisecond | autoavgmaxmin | DDUs |
| builtin:cloud | Messages delivered to Event Hub endpoints | Count | autovalue | DDUs |
| builtin:cloud | Message latency for event hub endpoints | Millisecond | autoavgmaxmin | DDUs |
| builtin:cloud | Dropped messages | Count | autovalue | DDUs |
| builtin:cloud | Invalid messages | Count | autovalue | DDUs |
| builtin:cloud | Orphaned messages | Count | autovalue | DDUs |
| builtin:cloud | Telemetry message send attempts | Count | autovalue | DDUs |
| builtin:cloud | Telemetry messages sent | Count | autovalue | DDUs |
| builtin:cloud | Messages matching fallback condition | Count | autovalue | DDUs |
| builtin:cloud | Message latency for service bus queue endpoints | Millisecond | autoavgmaxmin | DDUs |
| builtin:cloud | Messages delivered to service bus queue endpoints | Count | autovalue | DDUs |
| builtin:cloud | Message latency for service bus topic endpoints | Millisecond | autoavgmaxmin | DDUs |
| builtin:cloud | Messages delivered to service bus topic endpoints | Count | autovalue | DDUs |
| builtin:cloud | Message latency for storage endpoints | Millisecond | autoavgmaxmin | DDUs |
| builtin:cloud | Blobs written to storage | Count | autovalue | DDUs |
| builtin:cloud | Data written to storage | Byte | autoavgmaxmin | DDUs |
| builtin:cloud | Messages delivered to storage endpoints | Count | autovalue | DDUs |