Azure Event Hubs (built-in)
Dynatrace ingests metrics from Azure Metrics API for Azure Event Hubs. You can view metrics for each service instance, split metrics into multiple dimensions, and create custom charts that you can pin to your dashboards.
Prerequisites
Environment ActiveGate
- To disable monitoring of built-in services, you need Environment ActiveGate version 1.245+ and Dynatrace version 1.247+.
This service monitors both Microsoft.EventHub/namespaces and Microsoft.EventHub/namespaces/eventHubs.
Only monitored Event Hubs (as opposed to Event Hub Namespaces) are directly presented on the Azure overview page, in the Event hubs section. To view metrics for Event Hub Namespace, create a custom dashboard.
Enable monitoring
To learn how to enable service monitoring, see Enable service monitoring.
View service metrics
You can view Azure service metrics in your Dynatrace environment on the Azure subscription page or on your own dashboard.
View metrics on the Azure account page
To access metrics on the Azure account page
-
Go to Azure or Azure Classic (latest Dynatrace).
-
Choose the Azure subscription.
-
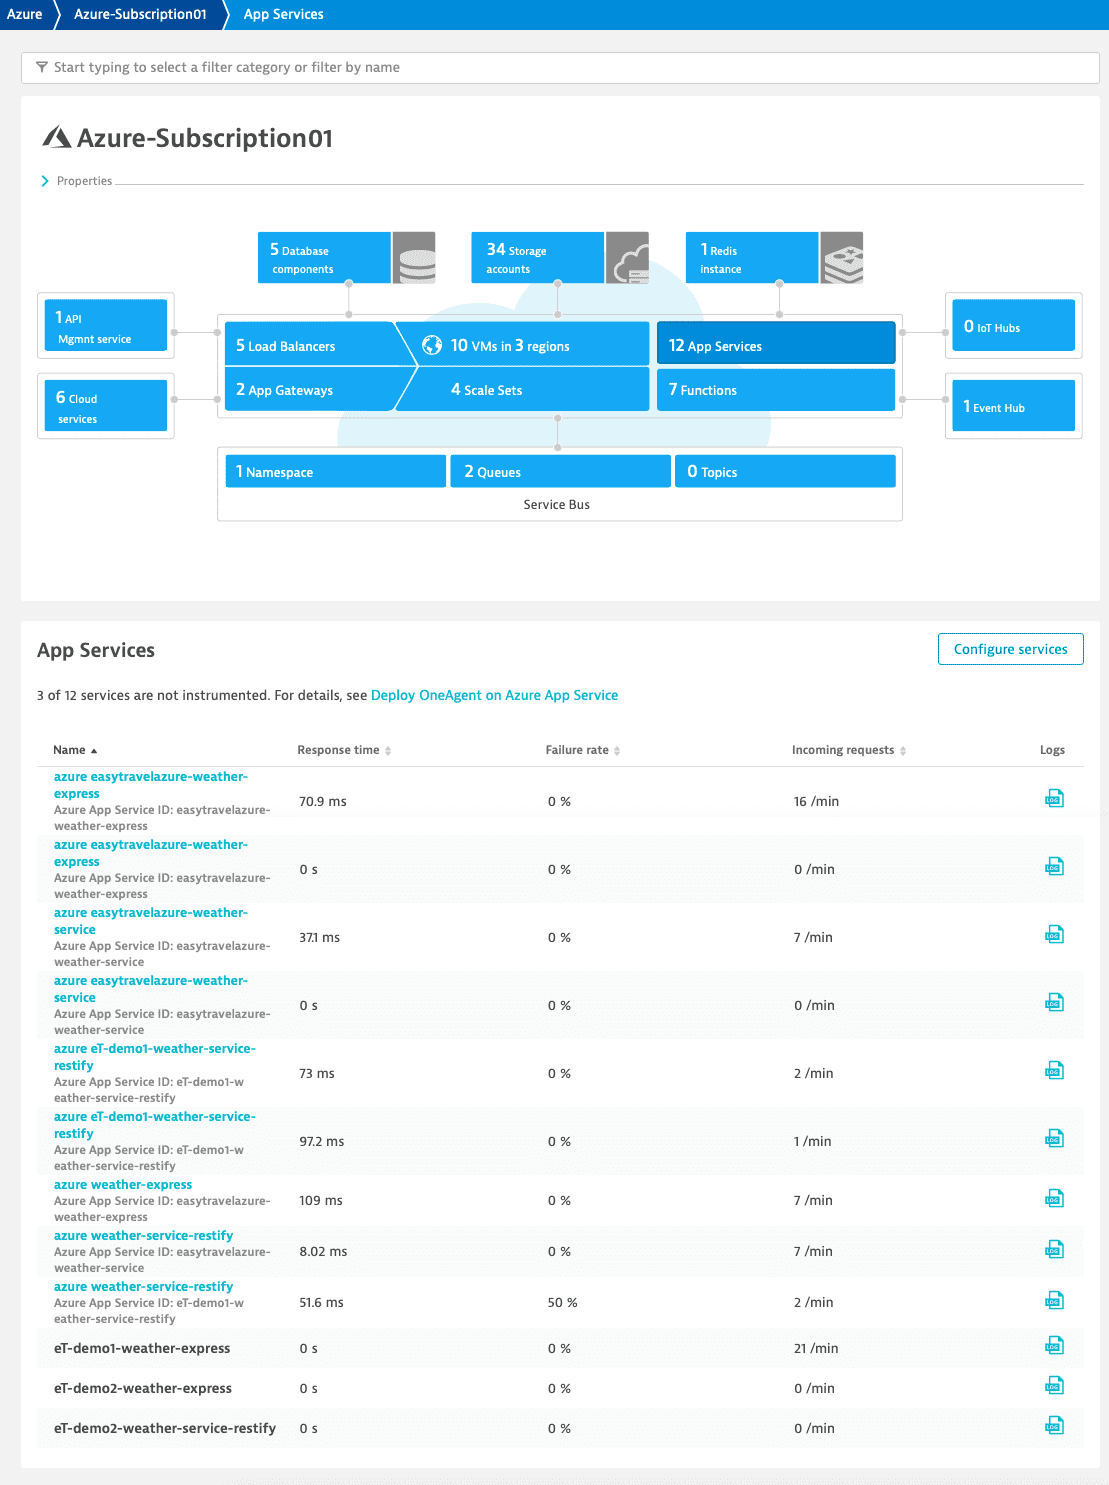
Select the service whose metrics you want to check. Metrics for the selected service are visible under the infographic in the service section, similarly to the example below.
View metrics on a dashboard
You can create your own dashboard for viewing Azure service metrics. For information on how to create dashboards, see Create and edit Dynatrace dashboards.
Available metrics
| Metric key | Name | Unit | Aggregations | Monitoring consumption |
|---|---|---|---|---|
| builtin:cloud | Capture backlog | Count | autovalue | DDUs |
| builtin:cloud | Captured bytes | Byte | autovalue | DDUs |
| builtin:cloud | Captured messages | Count | autovalue | DDUs |
| builtin:cloud | Quota exceeded errors | Count | autovalue | DDUs |
| builtin:cloud | Server errors | Count | autovalue | DDUs |
| builtin:cloud | User errors | Count | autovalue | DDUs |
| builtin:cloud | Incoming requests | Count | autovalue | DDUs |
| builtin:cloud | Successful requests | Count | autovalue | DDUs |
| builtin:cloud | Throttled requests | Count | autovalue | DDUs |
| builtin:cloud | Incoming bytes | Byte | autovalue | DDUs |
| builtin:cloud | Outgoing bytes | Byte | autovalue | DDUs |
| builtin:cloud | Incoming messages | Count | autovalue | DDUs |
| builtin:cloud | Outgoing messages | Count | autovalue | DDUs |
| builtin:cloud | Active connections | Count | autoavgmaxmin | DDUs |
| builtin:cloud | Closed connections | Count | autoavgmaxmin | DDUs |
| builtin:cloud | Opened connections | Count | autoavgmaxmin | DDUs |