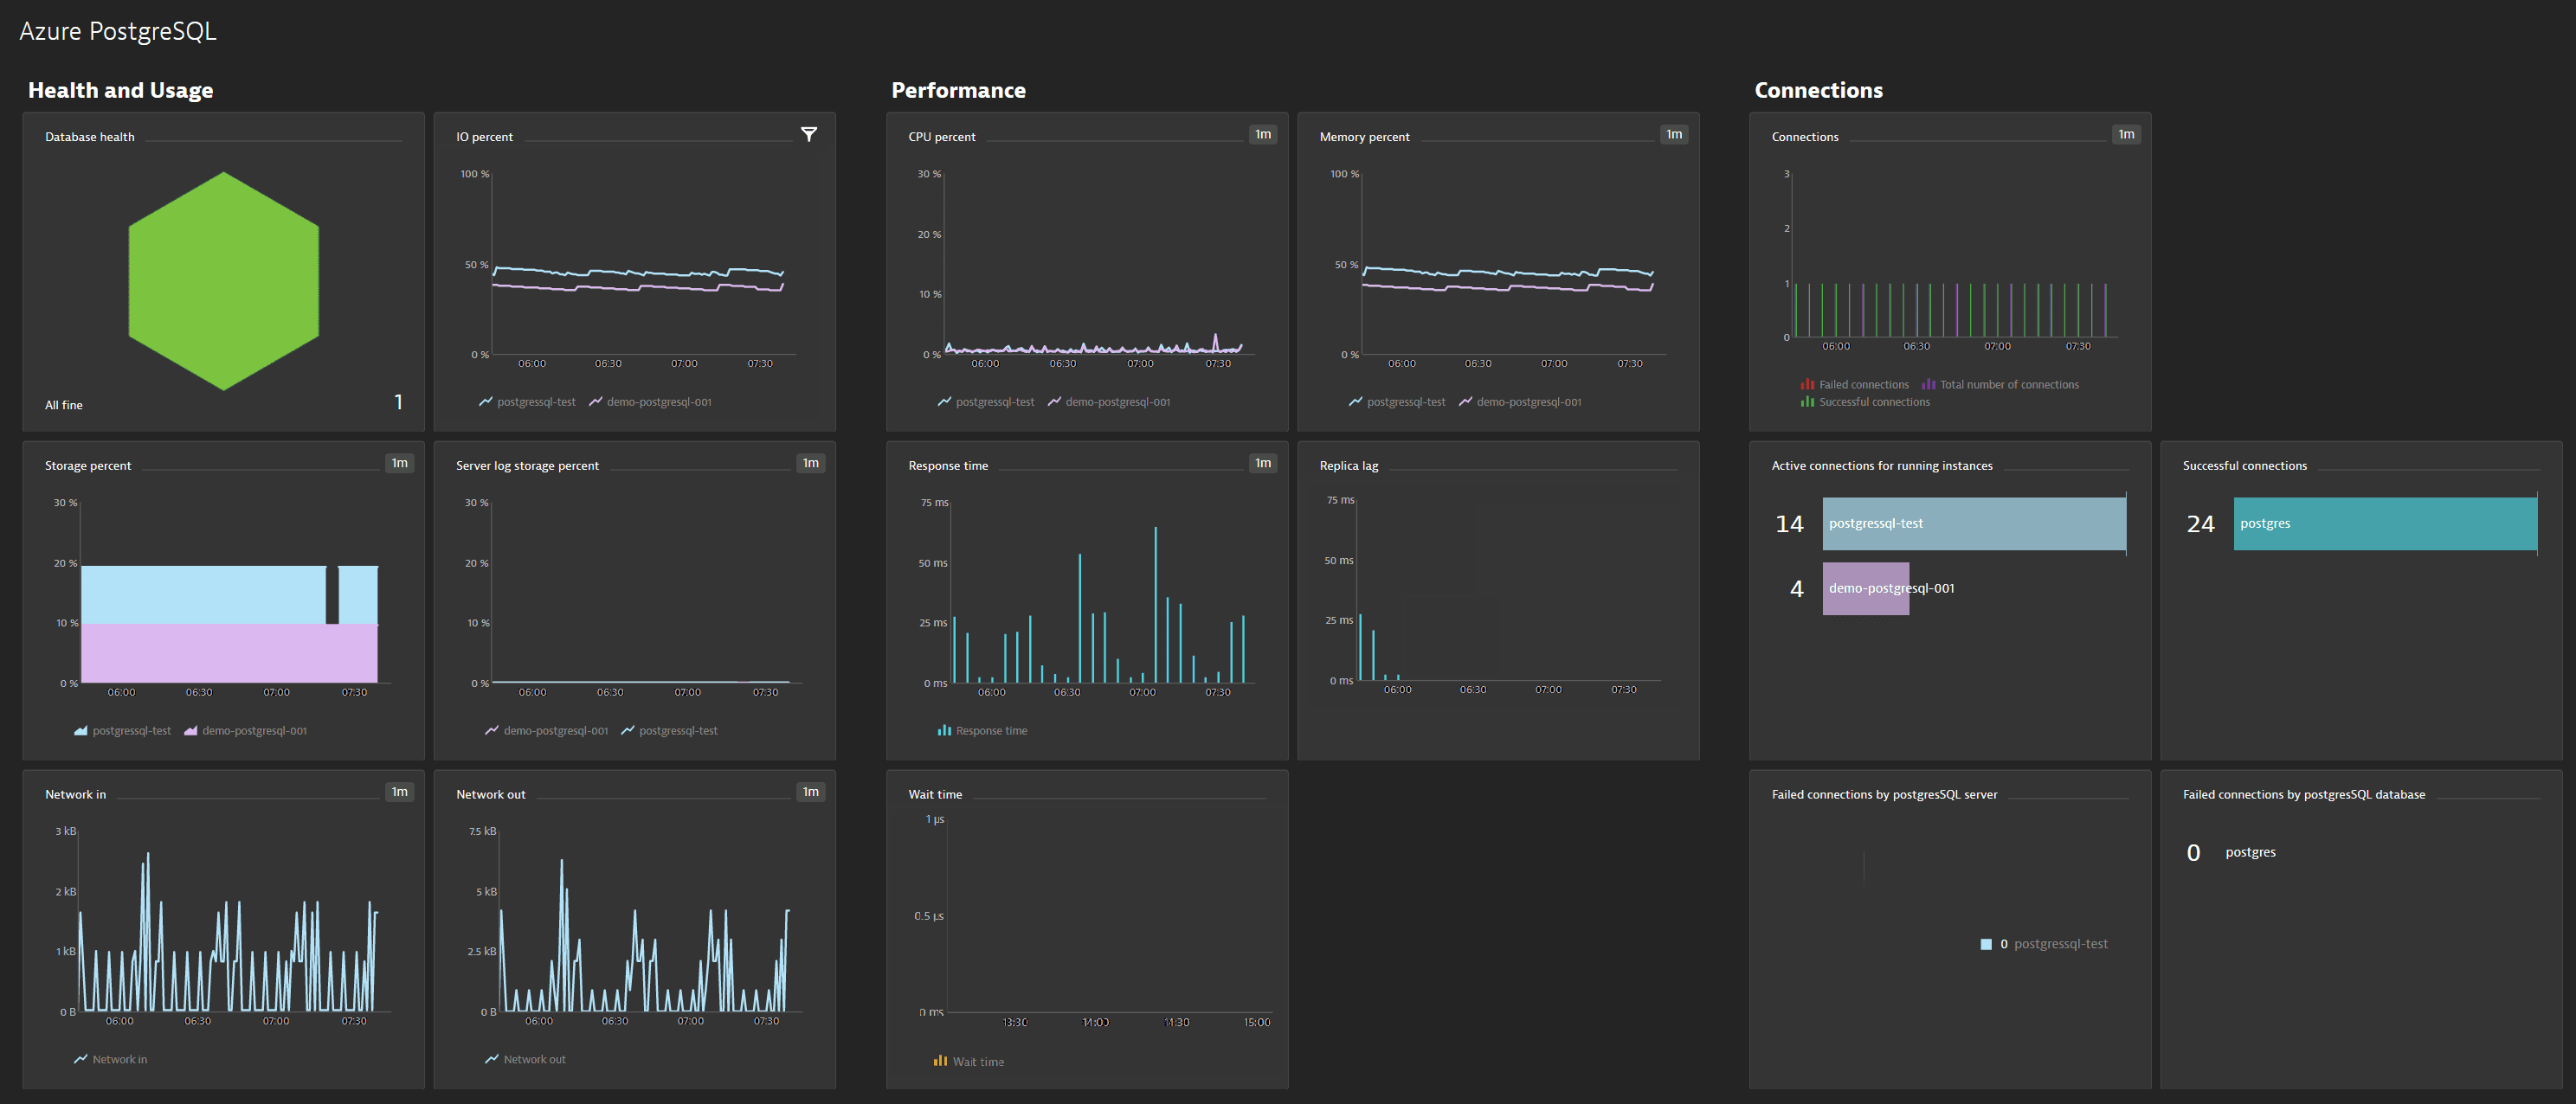
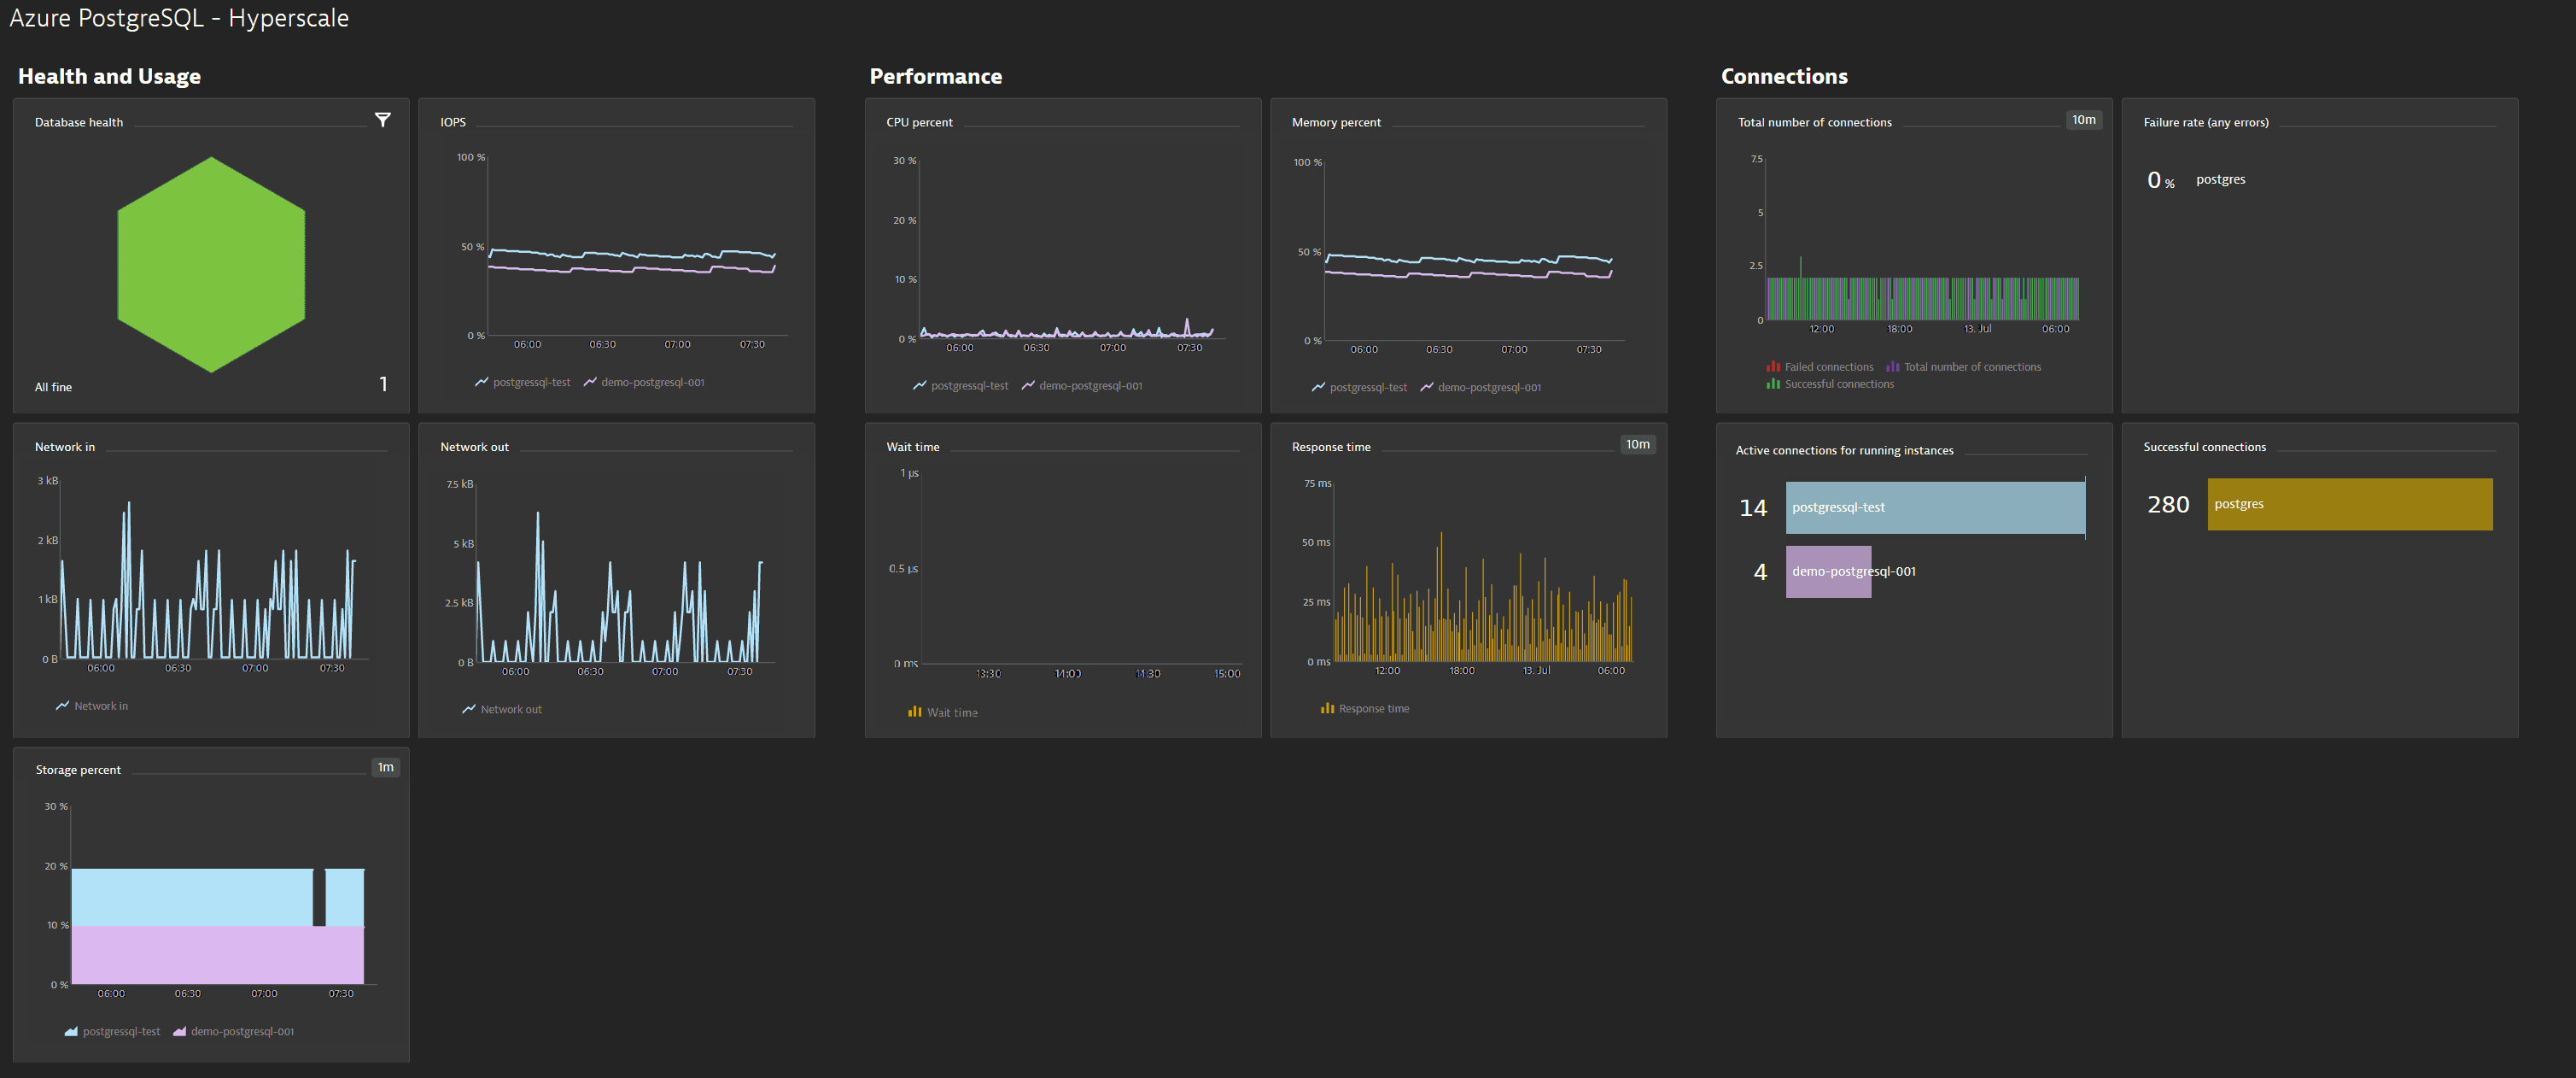
Azure Database for PostgreSQL (Single Server, Hyperscale, Flexible Server) monitoring
On the Azure Database for PostgreSQL (Single Server, Hyperscale, Flexible Server) overview pages you get insights into various aspects of database performance, including CPU and memory usage, active connections, storage space, and much more.
Prerequisites
- Dynatrace version 1.196+
- Environment ActiveGate version 1.195+
Enable monitoring
To learn how to enable service monitoring, see Enable service monitoring.
Optionally, for OneAgent integration, see how database activity is monitored.
View service metrics
You can view the service metrics in your Dynatrace environment either on the custom device overview page or on your Dashboards page.
View metrics on the custom device overview page
To access the custom device overview page
- Go to Technologies & Processes or Technologies & Processes Classic (latest Dynatrace).
Filter by service name and select the relevant custom device group.
- Once you select the custom device group, you're on the custom device group overview page.
- The custom device group overview page lists all instances (custom devices) belonging to the group. Select an instance to view the custom device overview page.
View metrics on your dashboard
Once you add a service to monitoring, a preset dashboard for the respective service containing all recommended metrics is automatically created on your Dashboards page. You can look for specific dashboards by filtering by Preset and then by Name.
For existing monitored services, you might need to resave your credentials for the preset dashboard to appear on the Dashboards page. To resave your credentials, go to Settings > Cloud and virtualization > Azure, select the desired Azure instance, then select Save.
You can't make changes on a preset dashboard directly, but you can clone and edit it. To clone a dashboard, open the browse menu (…) and select Clone.
To remove a dashboard from the dashboards list, you can hide it. To hide a dashboard, open the browse menu (…) and select Hide.
Hiding a dashboard doesn't affect other users.

Set up a management zone
To import a dashboard for Azure Database for PostgreSQL, you need to set up a management zone to limit the entities displayed on the dashboard to those relevant to this service.
When you create a management zone for this dashboard:
- Create a rule that identifies services based on a common property:
- Service topology:
Opaque service - Service type:
Database
- Service topology:
- Add a condition for the database name to contain the
postgresstring (case sensitive.)
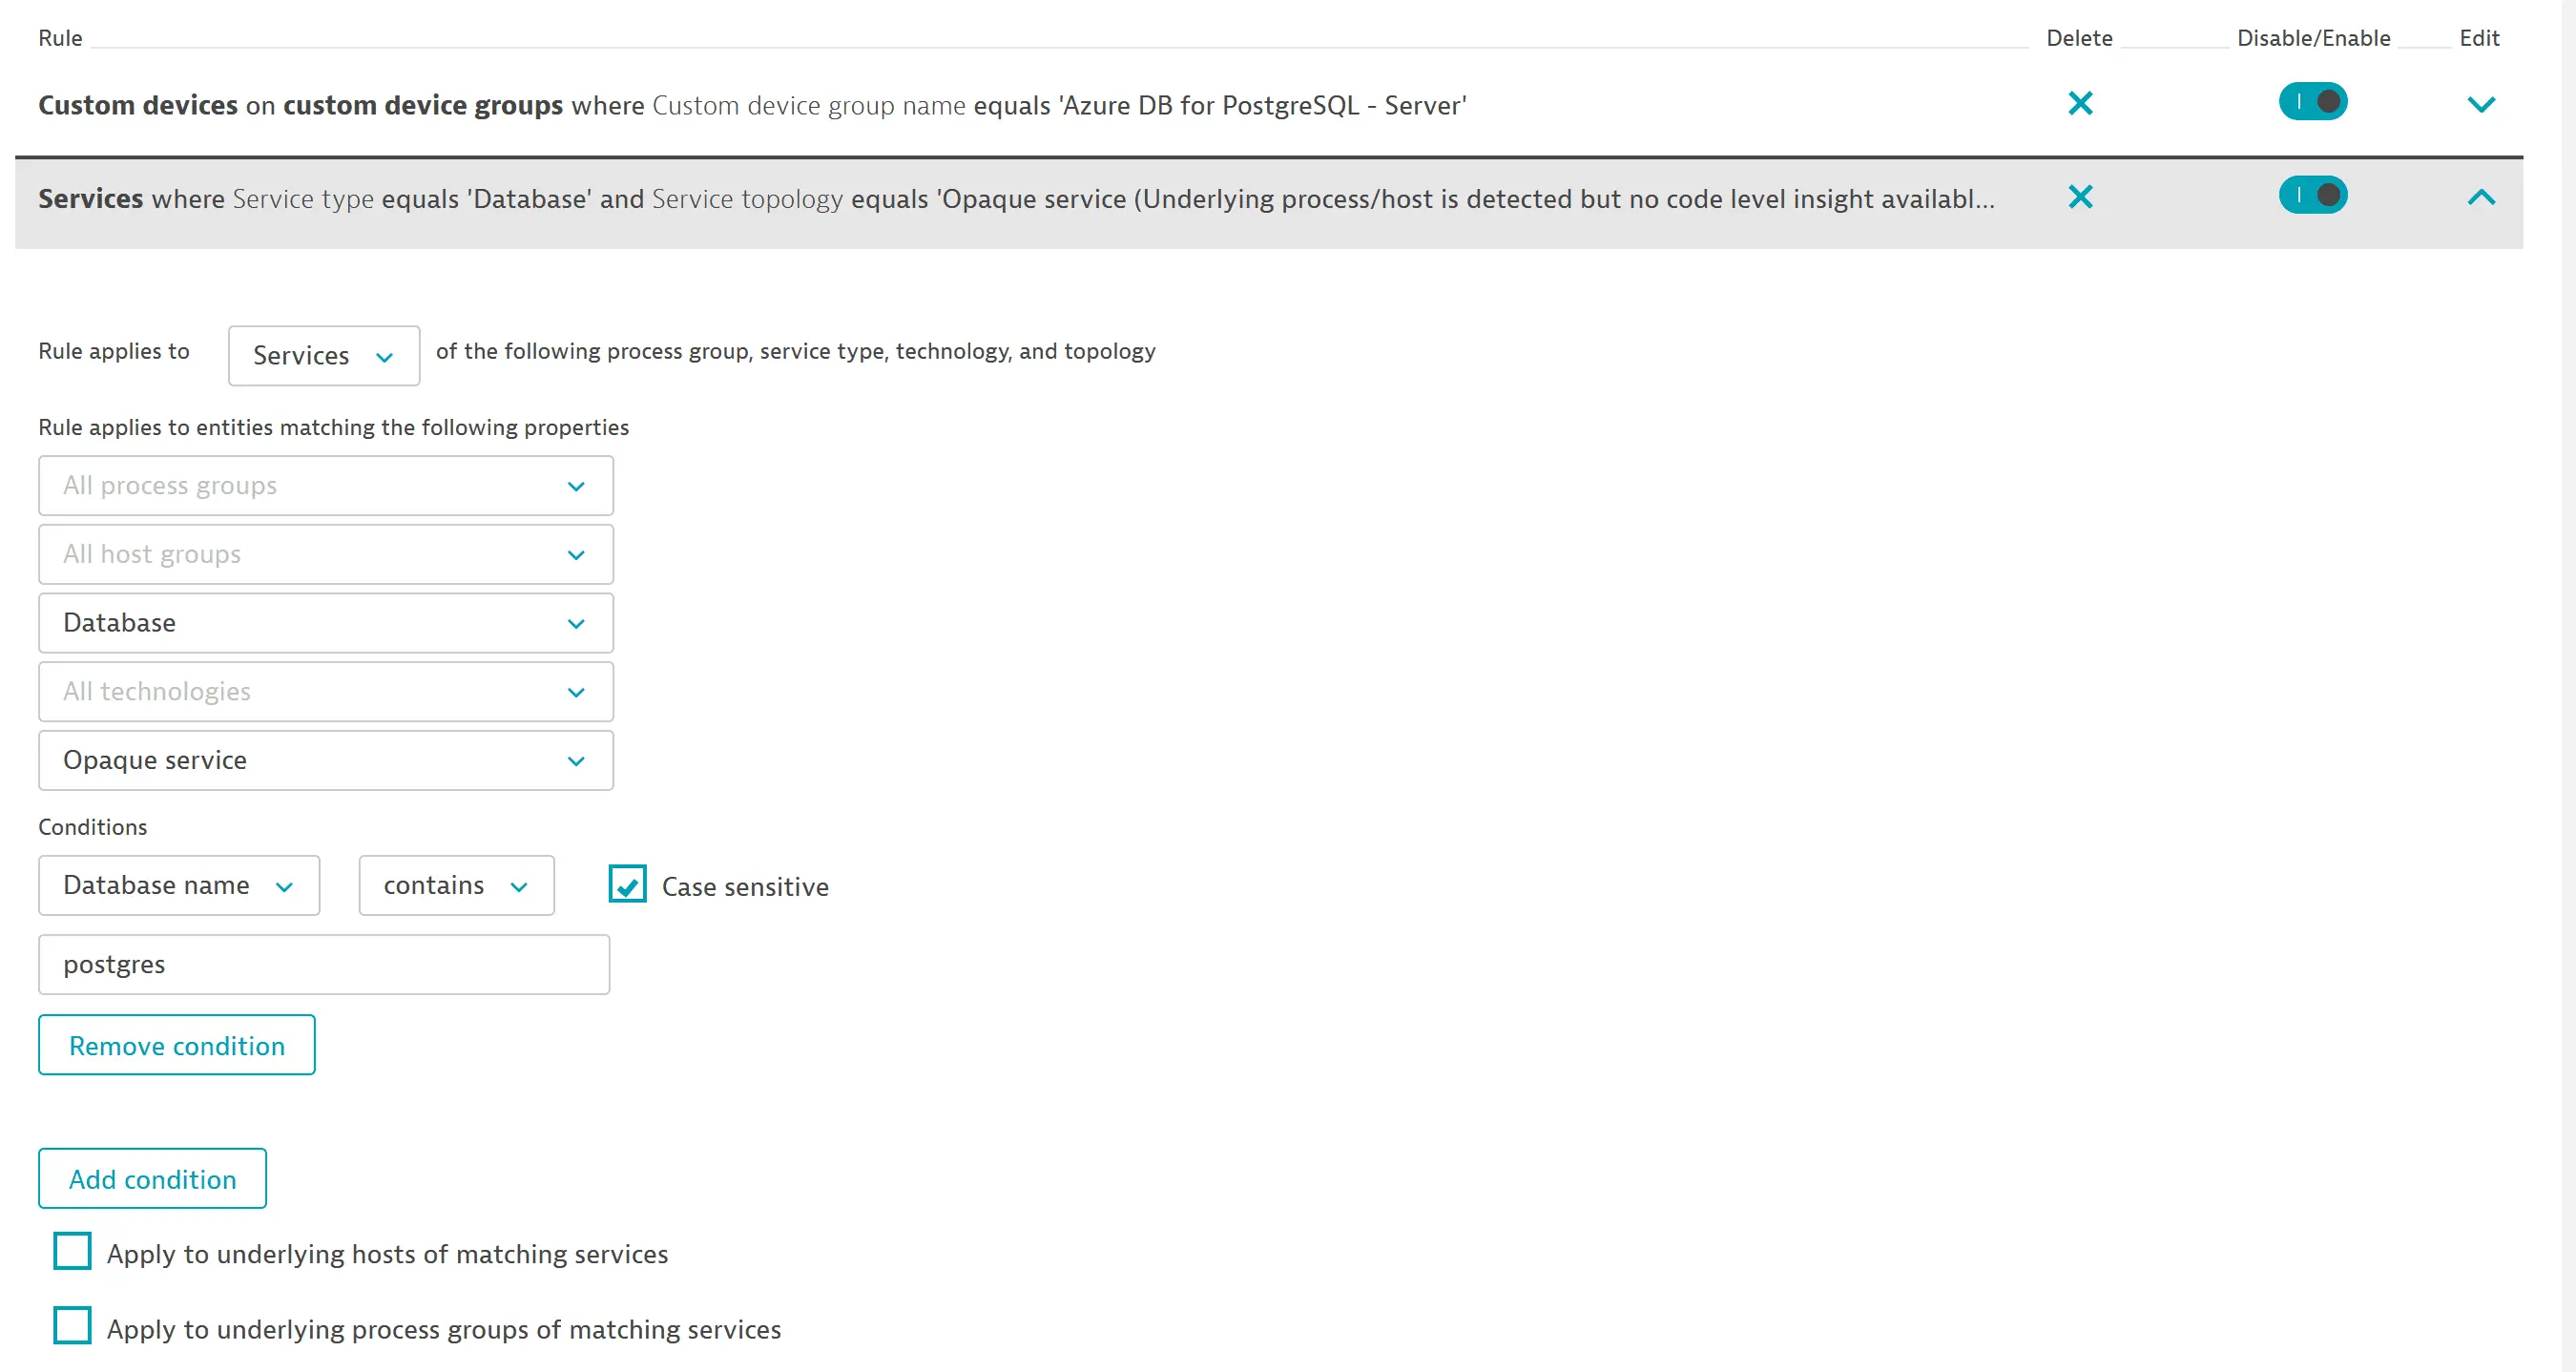
You can see whether a dashboard requires a management zone in the rules setup.
After you create the management zone, assign it to your dashboard (from the dashboard, select Edit > Settings > Default management zone). For more information, see Dashboard timeframe and management zone.
Available metrics
Azure Database for PostgreSQL (Single Server)
| Name | Description | Unit | Recommended |
|---|---|---|---|
| active_connections | The number of active connections to the server | Count | |
| backup_storage_used | The amount of backup storage used. This metric represents the sum of storage consumed by all the full database backups, differential backups, and log backups retained based on the backup retention period set for the server. | Bytes | |
| cpu_percent | The percentage of CPU in use | Percent | |
| connections_failed | The number of established connections that failed | Count | |
| io_consumption_percent | The percentage of IO in use | Percent | |
| pg_replica_log_delay_in_bytes | Lag in bytes of the most lagging replica | Bytes | |
| memory_percent | The percentage of memory in use | Percent | |
| network_bytes_ingress | Network in across active connections | Bytes | |
| network_bytes_egress | Network out across active connections | Bytes | |
| pg_replica_log_delay_in_seconds | The time since the last replayed transaction. This metric is available for replica servers only. | Seconds | |
| serverlog_storage_limit | The maximum server log storage for this server | Bytes | |
| serverlog_storage_percent | The percentage of server log storage used out of the server's maximum server log storage | Percent | |
| serverlog_storage_usage | The amount of server log storage in use | Bytes | |
| storage_limit | The maximum storage for this server | Bytes | |
| storage_percent | The percentage of storage used out of the server's maximum | Percent | |
| storage_used | The amount of storage in use. The storage used by the service may include the database files, transaction logs, and the server logs. | Bytes |
Azure Database for PostgreSQL Hyperscale
| Name | Description | Unit | Recommended |
|---|---|---|---|
| active_connections | The number of active connections to the server | Count | |
| cpu_percent | The percentage of CPU in use | Percent | |
| iops | The number of requests that your application is sending to the storage disks in one second | Count | |
| memory_percent | The percentage of memory in use | Percent | |
| network_bytes_egress | Network out across active connections | Byte | |
| network_bytes_ingress | Network in across active connections | Byte | |
| storage_percent | The percentage of storage used out of the server's maximum | Percent | |
| storage_used | The amount of storage in use. The storage used by the service may include the database files, transaction logs, and the server logs. | Byte |
Azure Database for PostgreSQL - Flexible Server
| Name | Description | Unit | Recommended |
|---|---|---|---|
| active_connections | Number of connections to your server. | Count | |
| backup_storage_used | Amount of backup storage used. This metric represents the sum of storage consumed by all the full database backups, differential backups, and log backups retained based on the backup retention period set for the server. The frequency of the backups is service managed. For geo-redundant storage, backup storage usage is twice that of the locally redundant storage. | Byte | |
| connections_failed | Failed connections. | Count | |
| connections_succeeded | Succeeded connections. | Count | |
| cpu_credits_consumed | Number of credits used by the flexible server. Applicable to Burstable tier. | Count | |
| cpu_credits_remaining | Number of credits available to burst. Applicable to Burstable tier. | Count | |
| cpu_percent | Percentage of CPU in use. | Percent | |
| disk_queue_depth | Number of outstanding I/O operations to the data disk. | Count | |
| iops | Number of I/O operations to disk per second. | Count | |
| maximum_used_transactionIDs | Maximum transaction ID in use. | Count | |
| memory_percent | Percentage of memory in use. | Percent | |
| network_bytes_ingress | Amount of incoming network traffic. | Byte | |
| network_bytes_egress | Amount of outgoing network traffic. | Byte | |
| read_iops | Number of data disk I/O read operations per second. | Count | |
| read_throughput | Bytes read per second from disk. | Count | |
| storage_free | Amount of storage space available. | Byte | |
| storage_percent | Percent of storage space used. The storage used by the service may include the database files, transaction logs, and the server logs. | Percent | |
| storage_used | The storage used by the service may include the database files, transaction logs, and the server logs. | Byte | |
| txlogs_storage_used | Amount of storage space used by the transaction logs. | Byte | |
| write_iops | Number of data disk I/O write operations per second. | Count | |
| write_throughput | Bytes written per second to disk. | Count |