Self-monitoring for the Dynatrace GCP integration
Self-monitoring allows quick diagnosis to determine if a self-monitoring function is properly processing and sending logs to Dynatrace
Enable self-monitoring
Follow the steps below according to your deployment scenario.
Enable self-monitoring for the GKE deployment
-
Connect to the Kubernetes cluster where the GCP Monitor deployment is running.
-
Edit the configmap.
kubectl -n dynatrace edit configmaps dynatrace-gcp-monitor-config -
Change the value of the
SELF_MONITORING_ENABLEDparameter totrue. -
Restart the GKE GCP Monitor.
kubectl -n dynatrace rollout restart deployment dynatrace-gcp-monitor
Enable self-monitoring for the GCP Monitor deployment
- In the GCP console, go to Cloud Functions.
- Select dynatrace-gcp-monitor.
- Select Edit.
- Under Runtime, build and connection settings, change the value of the
SELF_MONITORING_ENABLEDruntime environment variable totrue. - Select Next, and then select Deploy to apply the new settings.
Self-monitoring metrics
The Dynatrace GCP Monitor deployment reports self-monitoring metrics as Google Cloud metrics. See below the list of self-monitoring metrics for metric/log ingest.
Self-monitoring metrics for the GKE deployment
Metric ingestion
| Metric | Description |
|---|---|
| MINT lines ingested | The number of data points (metrics with dimensions) ingested by Dynatrace Metrics API v2 in a given interval. |
| Dynatrace connectivity | The connectivity status (1 = OK) between the monitoring function and Dynatrace. Connectivity can be broken due to an incorrect Dynatrace URL, an incorrect API token, or network connectivity issues. |
| Dynatrace failed requests count | The number of requests rejected by Dynatrace Metrics API v2. The reason for failure can be that the data point value doesn't comply with the metric ingestion protocol syntax, or that the limit for metric ingestion is exceeded. |
| Dynatrace requests count | The number of requests sent to Dynatrace. |
Log ingestion
| Metric | Description |
|---|---|
| All requests | All requests sent to Dynatrace |
| Dynatrace connectivity failures | The number of failed requests to connect to Dynatrace |
| Too old records | The number of log records that were invalid because the timestamp was too old |
| Too long content size | The number of records with content exceeding the maximum content length |
| Parsing errors | The number of errors that occurred while parsing logs |
| Processing time | The total amount of time for processing logs |
| Sending time | The total amount of time for sending logs |
| Sent logs entries | The number of log entries sent to Dynatrace |
| Log ingest payload size | The size of the log payload sent to Dynatrace (in KB) |
Self-monitoring metrics for the GCP Monitor deployment
Metric ingestion
| Metric | Description |
|---|---|
| MINT lines ingested | The number of data points (metrics with dimensions) ingested by Dynatrace Metrics API v2 in a given interval. |
| Dynatrace connectivity | The connectivity status (1 = OK) between the monitoring function and Dynatrace. Connectivity can be broken due to an incorrect Dynatrace URL, an incorrect API token, or network connectivity issues. |
| Dynatrace failed requests count | The number of requests rejected by Dynatrace Metrics API v2. The reason for failure can be that the data point value doesn't comply with the metric ingestion protocol syntax, or that the limit for metric ingestion is exceeded. |
| Dynatrace requests count | The number of requests sent to Dynatrace. |
View self-monitoring metrics
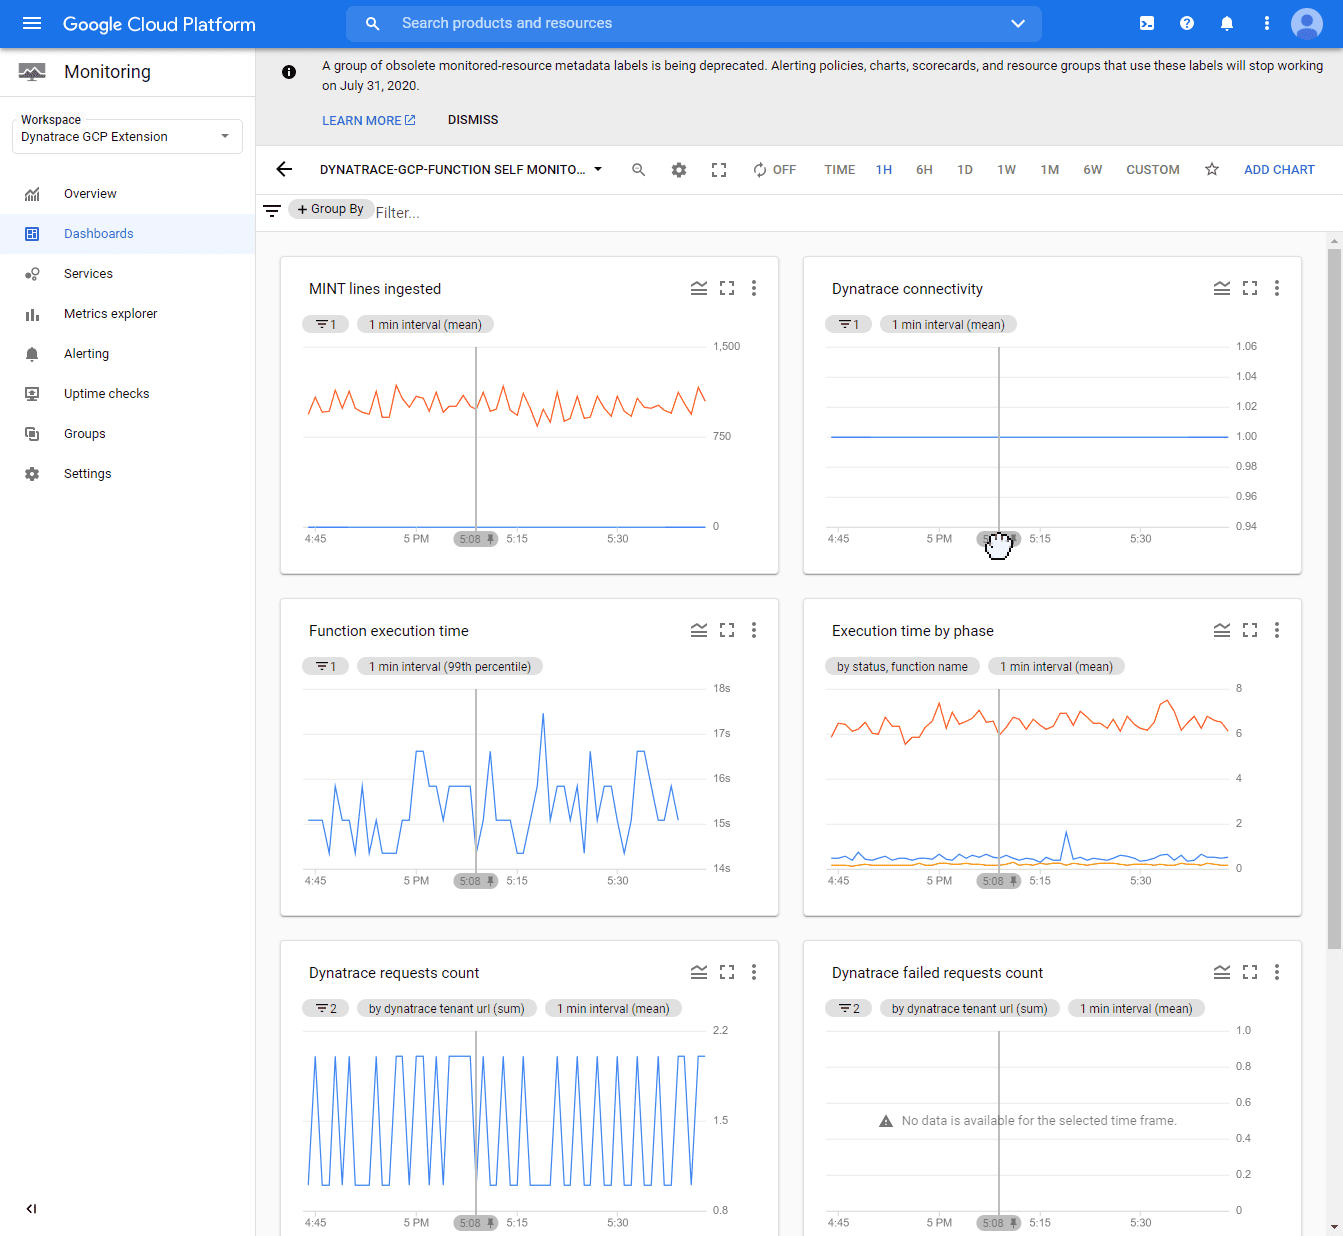
The self-monitoring dashboards present multiple metrics related to Dynatrace connectivity status, the amount of data processed, and execution times.
To view the dashboards with self-monitoring metrics
In your GCP console, go to the GCP Monitoring service.
- Select Dashboards.
- Depending on the type of deployment selected, search for
- The
dynatrace-gcp-monitor log self monitoringdashboard (for logs) - The
dynatrace-gcp-monitor self monitoringdashboard (for metrics)
- The
Example dashboard: