Amazon GameLift monitoring
Dynatrace ingests metrics for multiple preselected namespaces, including Amazon GameLift. You can view metrics for each service instance, split metrics into multiple dimensions, and create custom charts that you can pin to your dashboards.
Prerequisites
To enable monitoring for this service, you need
-
ActiveGate version 1.197+
-
For Dynatrace SaaS deployments, you need an Environment ActiveGate or a Multi-environment ActiveGate.
-
For Dynatrace Managed deployments, you can use any kind of ActiveGate.
For role-based access (whether in a SaaS or Managed deployment), you need an Environment ActiveGate installed on an Amazon EC2 host.
-
-
Dynatrace version 1.203+
-
An updated AWS monitoring policy to include the additional AWS services.
To update the AWS IAM policy, use the JSON below, containing the monitoring policy (permissions) for all supporting services.
{"Version": "2012-10-17","Statement": [{"Sid": "VisualEditor0","Effect": "Allow","Action": ["acm-pca:ListCertificateAuthorities","apigateway:GET","apprunner:ListServices","appstream:DescribeFleets","appsync:ListGraphqlApis","athena:ListWorkGroups","autoscaling:DescribeAutoScalingGroups","cloudformation:ListStackResources","cloudfront:ListDistributions","cloudhsm:DescribeClusters","cloudsearch:DescribeDomains","cloudwatch:GetMetricData","cloudwatch:GetMetricStatistics","cloudwatch:ListMetrics","codebuild:ListProjects","datasync:ListTasks","dax:DescribeClusters","directconnect:DescribeConnections","dms:DescribeReplicationInstances","dynamodb:ListTables","dynamodb:ListTagsOfResource","ec2:DescribeAvailabilityZones","ec2:DescribeInstances","ec2:DescribeNatGateways","ec2:DescribeSpotFleetRequests","ec2:DescribeTransitGateways","ec2:DescribeVolumes","ec2:DescribeVpnConnections","ecs:ListClusters","eks:ListClusters","elasticache:DescribeCacheClusters","elasticbeanstalk:DescribeEnvironmentResources","elasticbeanstalk:DescribeEnvironments","elasticfilesystem:DescribeFileSystems","elasticloadbalancing:DescribeInstanceHealth","elasticloadbalancing:DescribeListeners","elasticloadbalancing:DescribeLoadBalancers","elasticloadbalancing:DescribeRules","elasticloadbalancing:DescribeTags","elasticloadbalancing:DescribeTargetHealth","elasticmapreduce:ListClusters","elastictranscoder:ListPipelines","es:ListDomainNames","events:ListEventBuses","firehose:ListDeliveryStreams","fsx:DescribeFileSystems","gamelift:ListFleets","glue:GetJobs","inspector:ListAssessmentTemplates","kafka:ListClusters","kinesis:ListStreams","kinesisanalytics:ListApplications","kinesisvideo:ListStreams","lambda:ListFunctions","lambda:ListTags","lex:GetBots","logs:DescribeLogGroups","mediaconnect:ListFlows","mediaconvert:DescribeEndpoints","mediapackage-vod:ListPackagingConfigurations","mediapackage:ListChannels","mediatailor:ListPlaybackConfigurations","opsworks:DescribeStacks","qldb:ListLedgers","rds:DescribeDBClusters","rds:DescribeDBInstances","rds:DescribeEvents","rds:ListTagsForResource","redshift:DescribeClusters","robomaker:ListSimulationJobs","route53:ListHostedZones","route53resolver:ListResolverEndpoints","s3:ListAllMyBuckets","sagemaker:ListEndpoints","sns:ListTopics","sqs:ListQueues","storagegateway:ListGateways","sts:GetCallerIdentity","swf:ListDomains","tag:GetResources","tag:GetTagKeys","transfer:ListServers","workmail:ListOrganizations","workspaces:DescribeWorkspaces"],"Resource": "*"}]}
If you don't want to add permissions to all services, and just select permissions for certain services, consult the table below. The table contains a set of permissions that are required for All AWS cloud services and, for each supporting service, a list of optional permissions specific to that service.
"cloudwatch:GetMetricData""cloudwatch:GetMetricStatistics""cloudwatch:ListMetrics""sts:GetCallerIdentity""tag:GetResources""tag:GetTagKeys""ec2:DescribeAvailabilityZones"
| Name | Permissions |
|---|---|
| All monitored Amazon services required | cloudwatch:GetMetricData,cloudwatch:GetMetricStatistics,cloudwatch:ListMetrics,sts:GetCallerIdentity,tag:GetResources,tag:GetTagKeys,ec2:DescribeAvailabilityZones |
| AWS Certificate Manager Private Certificate Authority | acm-pca:ListCertificateAuthorities |
| Amazon MQ | |
| Amazon API Gateway | apigateway:GET |
| AWS App Runner | apprunner:ListServices |
| Amazon AppStream | appstream:DescribeFleets |
| AWS AppSync | appsync:ListGraphqlApis |
| Amazon Athena | athena:ListWorkGroups |
| Amazon Aurora | rds:DescribeDBClusters |
| Amazon EC2 Auto Scaling | autoscaling:DescribeAutoScalingGroups |
| Amazon EC2 Auto Scaling (built-in) | autoscaling:DescribeAutoScalingGroups |
| AWS Billing | |
| Amazon Keyspaces | |
| AWS Chatbot | |
| Amazon CloudFront | cloudfront:ListDistributions |
| AWS CloudHSM | cloudhsm:DescribeClusters |
| Amazon CloudSearch | cloudsearch:DescribeDomains |
| AWS CodeBuild | codebuild:ListProjects |
| Amazon Cognito | |
| Amazon Connect | |
| Amazon Elastic Kubernetes Service (EKS) | eks:ListClusters |
| AWS DataSync | datasync:ListTasks |
| Amazon DynamoDB Accelerator (DAX) | dax:DescribeClusters |
| AWS Database Migration Service (AWS DMS) | dms:DescribeReplicationInstances |
| Amazon DocumentDB | rds:DescribeDBClusters |
| AWS Direct Connect | directconnect:DescribeConnections |
| Amazon DynamoDB | dynamodb:ListTables |
| Amazon DynamoDB (built-in) | dynamodb:ListTables,dynamodb:ListTagsOfResource |
| Amazon EBS | ec2:DescribeVolumes |
| Amazon EBS (built-in) | ec2:DescribeVolumes |
| Amazon EC2 API | |
| Amazon EC2 (built-in) | ec2:DescribeInstances |
| Amazon EC2 Spot Fleet | ec2:DescribeSpotFleetRequests |
| Amazon Elastic Container Service (ECS) | ecs:ListClusters |
| Amazon ECS Container Insights | ecs:ListClusters |
| Amazon ElastiCache (EC) | elasticache:DescribeCacheClusters |
| AWS Elastic Beanstalk | elasticbeanstalk:DescribeEnvironments |
| Amazon Elastic File System (EFS) | elasticfilesystem:DescribeFileSystems |
| Amazon Elastic Inference | |
| Amazon Elastic Map Reduce (EMR) | elasticmapreduce:ListClusters |
| Amazon Elasticsearch Service (ES) | es:ListDomainNames |
| Amazon Elastic Transcoder | elastictranscoder:ListPipelines |
| Amazon Elastic Load Balancer (ELB) (built-in) | elasticloadbalancing:DescribeInstanceHealth,elasticloadbalancing:DescribeListeners,elasticloadbalancing:DescribeLoadBalancers,elasticloadbalancing:DescribeRules,elasticloadbalancing:DescribeTags,elasticloadbalancing:DescribeTargetHealth |
| Amazon EventBridge | events:ListEventBuses |
| Amazon FSx | fsx:DescribeFileSystems |
| Amazon GameLift | gamelift:ListFleets |
| AWS Glue | glue:GetJobs |
| Amazon Inspector | inspector:ListAssessmentTemplates |
| AWS Internet of Things (IoT) | |
| AWS IoT Analytics | |
| Amazon Managed Streaming for Kafka | kafka:ListClusters |
| Amazon Kinesis Data Analytics | kinesisanalytics:ListApplications |
| Amazon Kinesis Data Firehose | firehose:ListDeliveryStreams |
| Amazon Kinesis Data Streams | kinesis:ListStreams |
| Amazon Kinesis Video Streams | kinesisvideo:ListStreams |
| AWS Lambda | lambda:ListFunctions |
| AWS Lambda (built-in) | lambda:ListFunctions,lambda:ListTags |
| Amazon Lex | lex:GetBots |
| Amazon Application and Network Load Balancer (built-in) | elasticloadbalancing:DescribeInstanceHealth,elasticloadbalancing:DescribeListeners,elasticloadbalancing:DescribeLoadBalancers,elasticloadbalancing:DescribeRules,elasticloadbalancing:DescribeTags,elasticloadbalancing:DescribeTargetHealth |
| Amazon CloudWatch Logs | logs:DescribeLogGroups |
| AWS Elemental MediaConnect | mediaconnect:ListFlows |
| AWS Elemental MediaConvert | mediaconvert:DescribeEndpoints |
| AWS Elemental MediaPackage Live | mediapackage:ListChannels |
| AWS Elemental MediaPackage Video on Demand | mediapackage-vod:ListPackagingConfigurations |
| AWS Elemental MediaTailor | mediatailor:ListPlaybackConfigurations |
| Amazon VPC NAT Gateways | ec2:DescribeNatGateways |
| Amazon Neptune | rds:DescribeDBClusters |
| AWS OpsWorks | opsworks:DescribeStacks |
| Amazon Polly | |
| Amazon QLDB | qldb:ListLedgers |
| Amazon RDS | rds:DescribeDBInstances |
| Amazon RDS (built-in) | rds:DescribeDBInstances,rds:DescribeEvents,rds:ListTagsForResource |
| Amazon Redshift | redshift:DescribeClusters |
| Amazon Rekognition | |
| AWS RoboMaker | robomaker:ListSimulationJobs |
| Amazon Route 53 | route53:ListHostedZones |
| Amazon Route 53 Resolver | route53resolver:ListResolverEndpoints |
| Amazon S3 | s3:ListAllMyBuckets |
| Amazon S3 (built-in) | s3:ListAllMyBuckets |
| Amazon SageMaker Batch Transform Jobs | |
| Amazon SageMaker Endpoint Instances | sagemaker:ListEndpoints |
| Amazon SageMaker Endpoints | sagemaker:ListEndpoints |
| Amazon SageMaker Ground Truth | |
| Amazon SageMaker Processing Jobs | |
| Amazon SageMaker Training Jobs | |
| AWS Service Catalog | |
| Amazon Simple Email Service (SES) | |
| Amazon Simple Notification Service (SNS) | sns:ListTopics |
| Amazon Simple Queue Service (SQS) | sqs:ListQueues |
| AWS Systems Manager - Run Command | |
| AWS Step Functions | |
| AWS Storage Gateway | storagegateway:ListGateways |
| Amazon SWF | swf:ListDomains |
| Amazon Textract | |
| AWS IoT Things Graph | |
| AWS Transfer Family | transfer:ListServers |
| AWS Transit Gateway | ec2:DescribeTransitGateways |
| Amazon Translate | |
| AWS Trusted Advisor | |
| AWS API Usage | |
| AWS Site-to-Site VPN | ec2:DescribeVpnConnections |
| AWS WAF Classic | |
| AWS WAF | |
| Amazon WorkMail | workmail:ListOrganizations |
| Amazon WorkSpaces | workspaces:DescribeWorkspaces |
Example of JSON policy for one single service.
{"Version": "2012-10-17","Statement": [{"Sid": "VisualEditor0","Effect": "Allow","Action": ["apigateway:GET","cloudwatch:GetMetricData","cloudwatch:GetMetricStatistics","cloudwatch:ListMetrics","sts:GetCallerIdentity","tag:GetResources","tag:GetTagKeys","ec2:DescribeAvailabilityZones"],"Resource": "*"}]}
In this example, from the complete list of permissions you need to select
"apigateway:GET"for Amazon API Gateway"cloudwatch:GetMetricData","cloudwatch:GetMetricStatistics","cloudwatch:ListMetrics","sts:GetCallerIdentity","tag:GetResources","tag:GetTagKeys", and"ec2:DescribeAvailabilityZones"for All AWS cloud services.
| Endpoint | Service |
|---|---|
autoscaling.<REGION>.amazonaws.com | Amazon EC2 Auto Scaling (built-in), Amazon EC2 Auto Scaling |
lambda.<REGION>.amazonaws.com | AWS Lambda (built-in), AWS Lambda |
elasticloadbalancing.<REGION>.amazonaws.com | Amazon Application and Network Load Balancer (built-in), Amazon Elastic Load Balancer (ELB) (built-in) |
dynamodb.<REGION>.amazonaws.com | Amazon DynamoDB (built-in), Amazon DynamoDB |
ec2.<REGION>.amazonaws.com | Amazon EBS (built-in), Amazon EC2 (built-in), Amazon EBS, Amazon EC2 Spot Fleet, Amazon VPC NAT Gateways, AWS Transit Gateway, AWS Site-to-Site VPN |
rds.<REGION>.amazonaws.com | Amazon RDS (built-in), Amazon Aurora, Amazon DocumentDB, Amazon Neptune, Amazon RDS |
s3.<REGION>.amazonaws.com | Amazon S3 (built-in) |
acm-pca.<REGION>.amazonaws.com | AWS Certificate Manager Private Certificate Authority |
apigateway.<REGION>.amazonaws.com | Amazon API Gateway |
apprunner.<REGION>.amazonaws.com | AWS App Runner |
appstream2.<REGION>.amazonaws.com | Amazon AppStream |
appsync.<REGION>.amazonaws.com | AWS AppSync |
athena.<REGION>.amazonaws.com | Amazon Athena |
cloudfront.amazonaws.com | Amazon CloudFront |
cloudhsmv2.<REGION>.amazonaws.com | AWS CloudHSM |
cloudsearch.<REGION>.amazonaws.com | Amazon CloudSearch |
codebuild.<REGION>.amazonaws.com | AWS CodeBuild |
datasync.<REGION>.amazonaws.com | AWS DataSync |
dax.<REGION>.amazonaws.com | Amazon DynamoDB Accelerator (DAX) |
dms.<REGION>.amazonaws.com | AWS Database Migration Service (AWS DMS) |
directconnect.<REGION>.amazonaws.com | AWS Direct Connect |
ecs.<REGION>.amazonaws.com | Amazon Elastic Container Service (ECS), Amazon ECS Container Insights |
elasticfilesystem.<REGION>.amazonaws.com | Amazon Elastic File System (EFS) |
eks.<REGION>.amazonaws.com | Amazon Elastic Kubernetes Service (EKS) |
elasticache.<REGION>.amazonaws.com | Amazon ElastiCache (EC) |
elasticbeanstalk.<REGION>.amazonaws.com | AWS Elastic Beanstalk |
elastictranscoder.<REGION>.amazonaws.com | Amazon Elastic Transcoder |
es.<REGION>.amazonaws.com | Amazon Elasticsearch Service (ES) |
events.<REGION>.amazonaws.com | Amazon EventBridge |
fsx.<REGION>.amazonaws.com | Amazon FSx |
gamelift.<REGION>.amazonaws.com | Amazon GameLift |
glue.<REGION>.amazonaws.com | AWS Glue |
inspector.<REGION>.amazonaws.com | Amazon Inspector |
kafka.<REGION>.amazonaws.com | Amazon Managed Streaming for Kafka |
models.lex.<REGION>.amazonaws.com | Amazon Lex |
logs.<REGION>.amazonaws.com | Amazon CloudWatch Logs |
api.mediatailor.<REGION>.amazonaws.com | AWS Elemental MediaTailor |
mediaconnect.<REGION>.amazonaws.com | AWS Elemental MediaConnect |
mediapackage.<REGION>.amazonaws.com | AWS Elemental MediaPackage Live |
mediapackage-vod.<REGION>.amazonaws.com | AWS Elemental MediaPackage Video on Demand |
opsworks.<REGION>.amazonaws.com | AWS OpsWorks |
qldb.<REGION>.amazonaws.com | Amazon QLDB |
redshift.<REGION>.amazonaws.com | Amazon Redshift |
robomaker.<REGION>.amazonaws.com | AWS RoboMaker |
route53.amazonaws.com | Amazon Route 53 |
route53resolver.<REGION>.amazonaws.com | Amazon Route 53 Resolver |
api.sagemaker.<REGION>.amazonaws.com | Amazon SageMaker Endpoints, Amazon SageMaker Endpoint Instances |
sns.<REGION>.amazonaws.com | Amazon Simple Notification Service (SNS) |
sqs.<REGION>.amazonaws.com | Amazon Simple Queue Service (SQS) |
storagegateway.<REGION>.amazonaws.com | AWS Storage Gateway |
swf.<REGION>.amazonaws.com | Amazon SWF |
transfer.<REGION>.amazonaws.com | AWS Transfer Family |
workmail.<REGION>.amazonaws.com | Amazon WorkMail |
workspaces.<REGION>.amazonaws.com | Amazon WorkSpaces |
Enable monitoring
To learn how to enable service monitoring, see Enable service monitoring.
View service metrics
You can view the service metrics in your Dynatrace environment either on the custom device overview page or on your Dashboards page.
View metrics on the custom device overview page
To access the custom device overview page
- Go to Technologies & Processes or Technologies & Processes Classic (latest Dynatrace).
Filter by service name and select the relevant custom device group.
- Once you select the custom device group, you're on the custom device group overview page.
- The custom device group overview page lists all instances (custom devices) belonging to the group. Select an instance to view the custom device overview page.
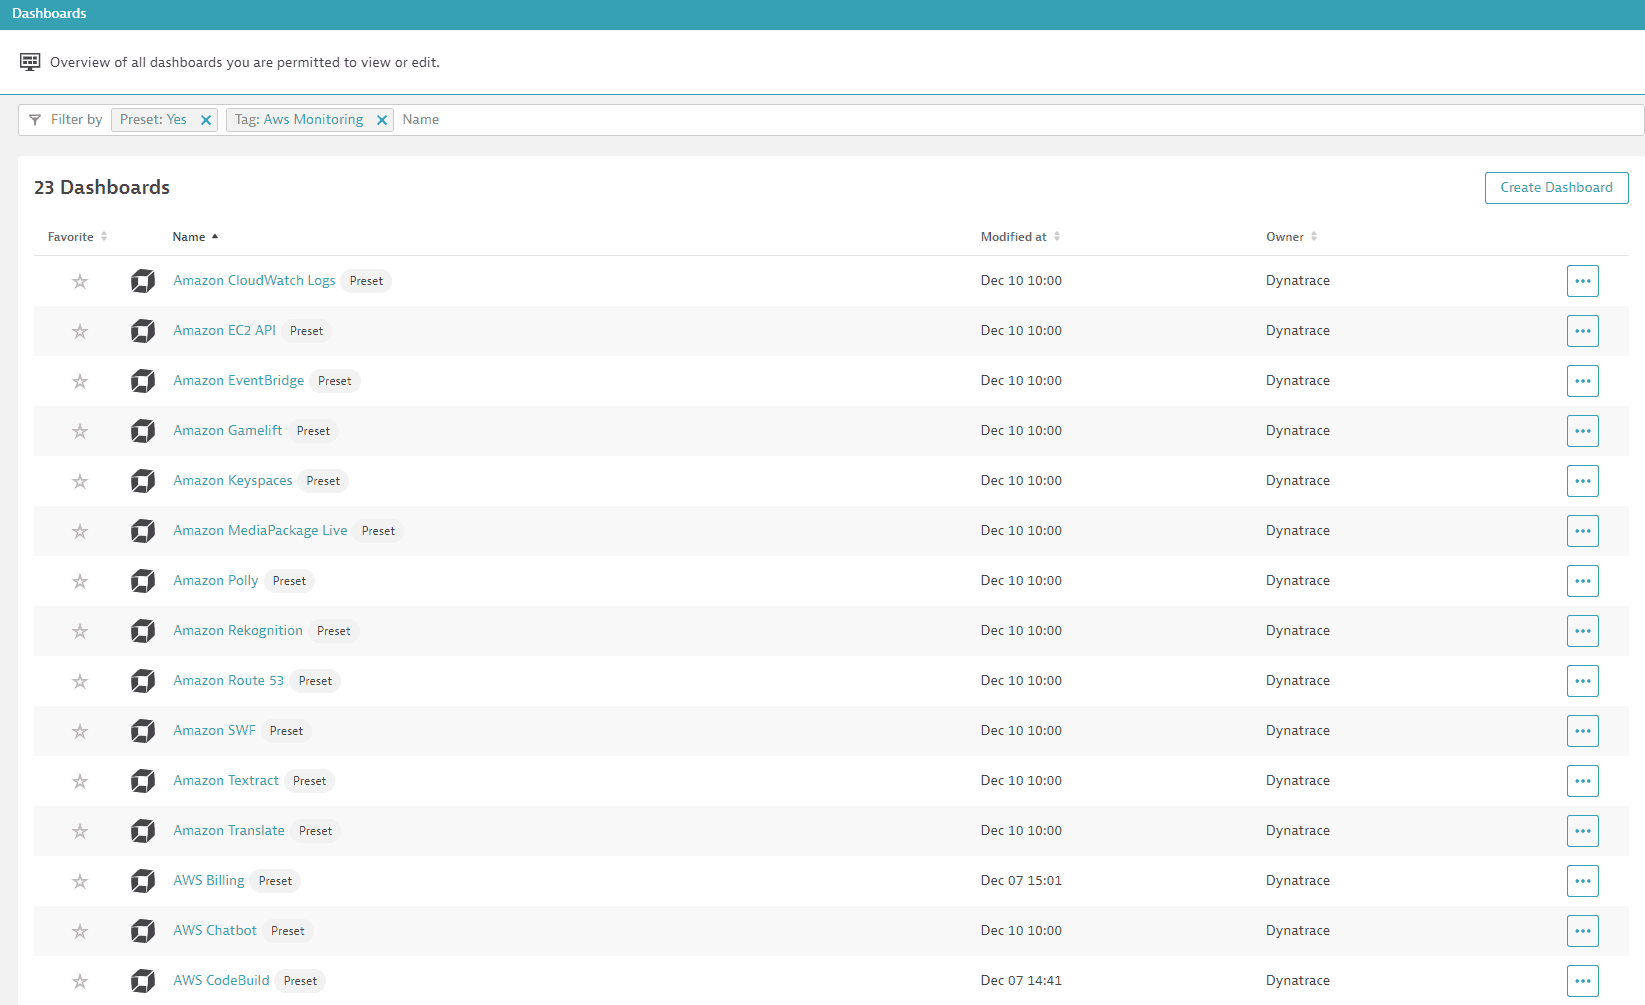
View metrics on your dashboard
After you add the service to monitoring, a preset dashboard containing all recommended metrics is automatically listed on your Dashboards page. To look for specific dashboards, filter by Preset and then by Name.
For existing monitored services, you might need to resave your credentials for the preset dashboard to appear on the Dashboards page. To resave your credentials, go to Settings > Cloud and virtualization > AWS, select the desired AWS instance, and then select Save.
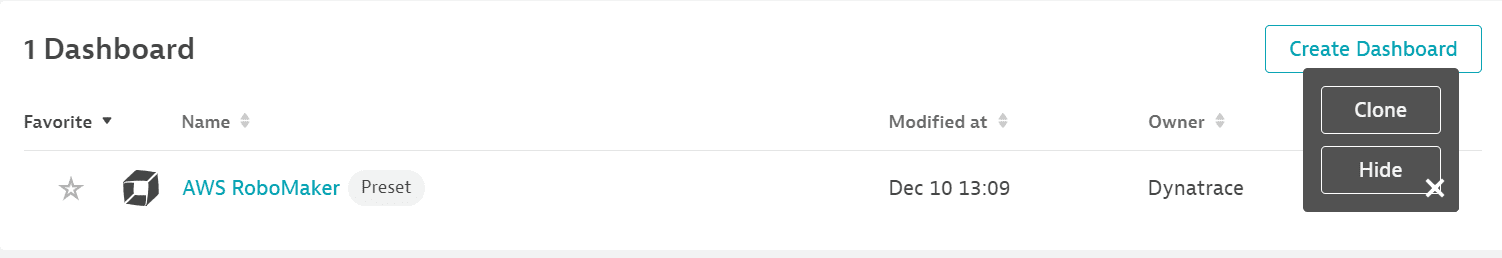
You can't make changes on a preset dashboard directly, but you can clone and edit it. To clone a dashboard, open the browse menu (…) and select Clone.
To remove a dashboard from the dashboards page, you can hide it. To hide a dashboard, open the browse menu (…) and select Hide.
Hiding a dashboard doesn't affect other users.
To check the availability of preset dashboards for each AWS service, see the list below.
| AWS service | Preset dashboard |
|---|---|
| Amazon EC2 Auto Scaling (built-in) | no |
| AWS Lambda (built-in) | no |
| Amazon Application and Network Load Balancer (built-in) | no |
| Amazon DynamoDB (built-in) | no |
| Amazon EBS (built-in) | no |
| Amazon EC2 (built-in) | no |
| Amazon Elastic Load Balancer (ELB) (built-in) | no |
| Amazon RDS (built-in) | no |
| Amazon S3 (built-in) | no |
| AWS Certificate Manager Private Certificate Authority | no |
| All monitored Amazon services | no |
| Amazon API Gateway | no |
| AWS App Runner | no |
| Amazon AppStream | yes |
| AWS AppSync | yes |
| Amazon Athena | yes |
| Amazon Aurora | no |
| Amazon EC2 Auto Scaling | yes |
| AWS Billing | yes |
| Amazon Keyspaces | yes |
| AWS Chatbot | yes |
| Amazon CloudFront | no |
| AWS CloudHSM | yes |
| Amazon CloudSearch | yes |
| AWS CodeBuild | yes |
| Amazon Cognito | no |
| Amazon Connect | yes |
| AWS DataSync | yes |
| Amazon DynamoDB Accelerator (DAX) | yes |
| AWS Database Migration Service (AWS DMS) | yes |
| Amazon DocumentDB | yes |
| AWS Direct Connect | yes |
| Amazon DynamoDB | no |
| Amazon EBS | no |
| Amazon EC2 Spot Fleet | no |
| Amazon EC2 API | yes |
| Amazon Elastic Container Service (ECS) | no |
| Amazon ECS Container Insights | yes |
| Amazon Elastic File System (EFS) | no |
| Amazon Elastic Kubernetes Service (EKS) | yes |
| Amazon ElastiCache (EC) | no |
| AWS Elastic Beanstalk | yes |
| Amazon Elastic Inference | yes |
| Amazon Elastic Transcoder | yes |
| Amazon Elastic Map Reduce (EMR) | no |
| Amazon Elasticsearch Service (ES) | no |
| Amazon EventBridge | yes |
| Amazon FSx | yes |
| Amazon GameLift | yes |
| AWS Glue | no |
| Amazon Inspector | yes |
| AWS Internet of Things (IoT) | no |
| AWS IoT Things Graph | yes |
| AWS IoT Analytics | yes |
| Amazon Managed Streaming for Kafka | yes |
| Amazon Kinesis Data Analytics | no |
| Amazon Kinesis Data Firehose | no |
| Amazon Kinesis Data Streams | no |
| Amazon Kinesis Video Streams | no |
| AWS Lambda | no |
| Amazon Lex | yes |
| Amazon CloudWatch Logs | yes |
| AWS Elemental MediaTailor | yes |
| AWS Elemental MediaConnect | yes |
| AWS Elemental MediaConvert | yes |
| AWS Elemental MediaPackage Live | yes |
| AWS Elemental MediaPackage Video on Demand | yes |
| Amazon MQ | yes |
| Amazon VPC NAT Gateways | no |
| Amazon Neptune | yes |
| AWS OpsWorks | yes |
| Amazon Polly | yes |
| Amazon QLDB | yes |
| Amazon RDS | no |
| Amazon Redshift | no |
| Amazon Rekognition | yes |
| AWS RoboMaker | yes |
| Amazon Route 53 | yes |
| Amazon Route 53 Resolver | yes |
| Amazon S3 | no |
| Amazon SageMaker Batch Transform Jobs | no |
| Amazon SageMaker Endpoints | no |
| Amazon SageMaker Endpoint Instances | no |
| Amazon SageMaker Ground Truth | no |
| Amazon SageMaker Processing Jobs | no |
| Amazon SageMaker Training Jobs | no |
| AWS Service Catalog | yes |
| Amazon Simple Email Service (SES) | no |
| Amazon Simple Notification Service (SNS) | no |
| Amazon Simple Queue Service (SQS) | no |
| AWS Systems Manager - Run Command | yes |
| AWS Step Functions | yes |
| AWS Storage Gateway | yes |
| Amazon SWF | yes |
| Amazon Textract | yes |
| AWS Transfer Family | yes |
| AWS Transit Gateway | yes |
| Amazon Translate | yes |
| AWS Trusted Advisor | yes |
| AWS API Usage | yes |
| AWS Site-to-Site VPN | yes |
| AWS WAF Classic | yes |
| AWS WAF | yes |
| Amazon WorkMail | yes |
| Amazon WorkSpaces | yes |
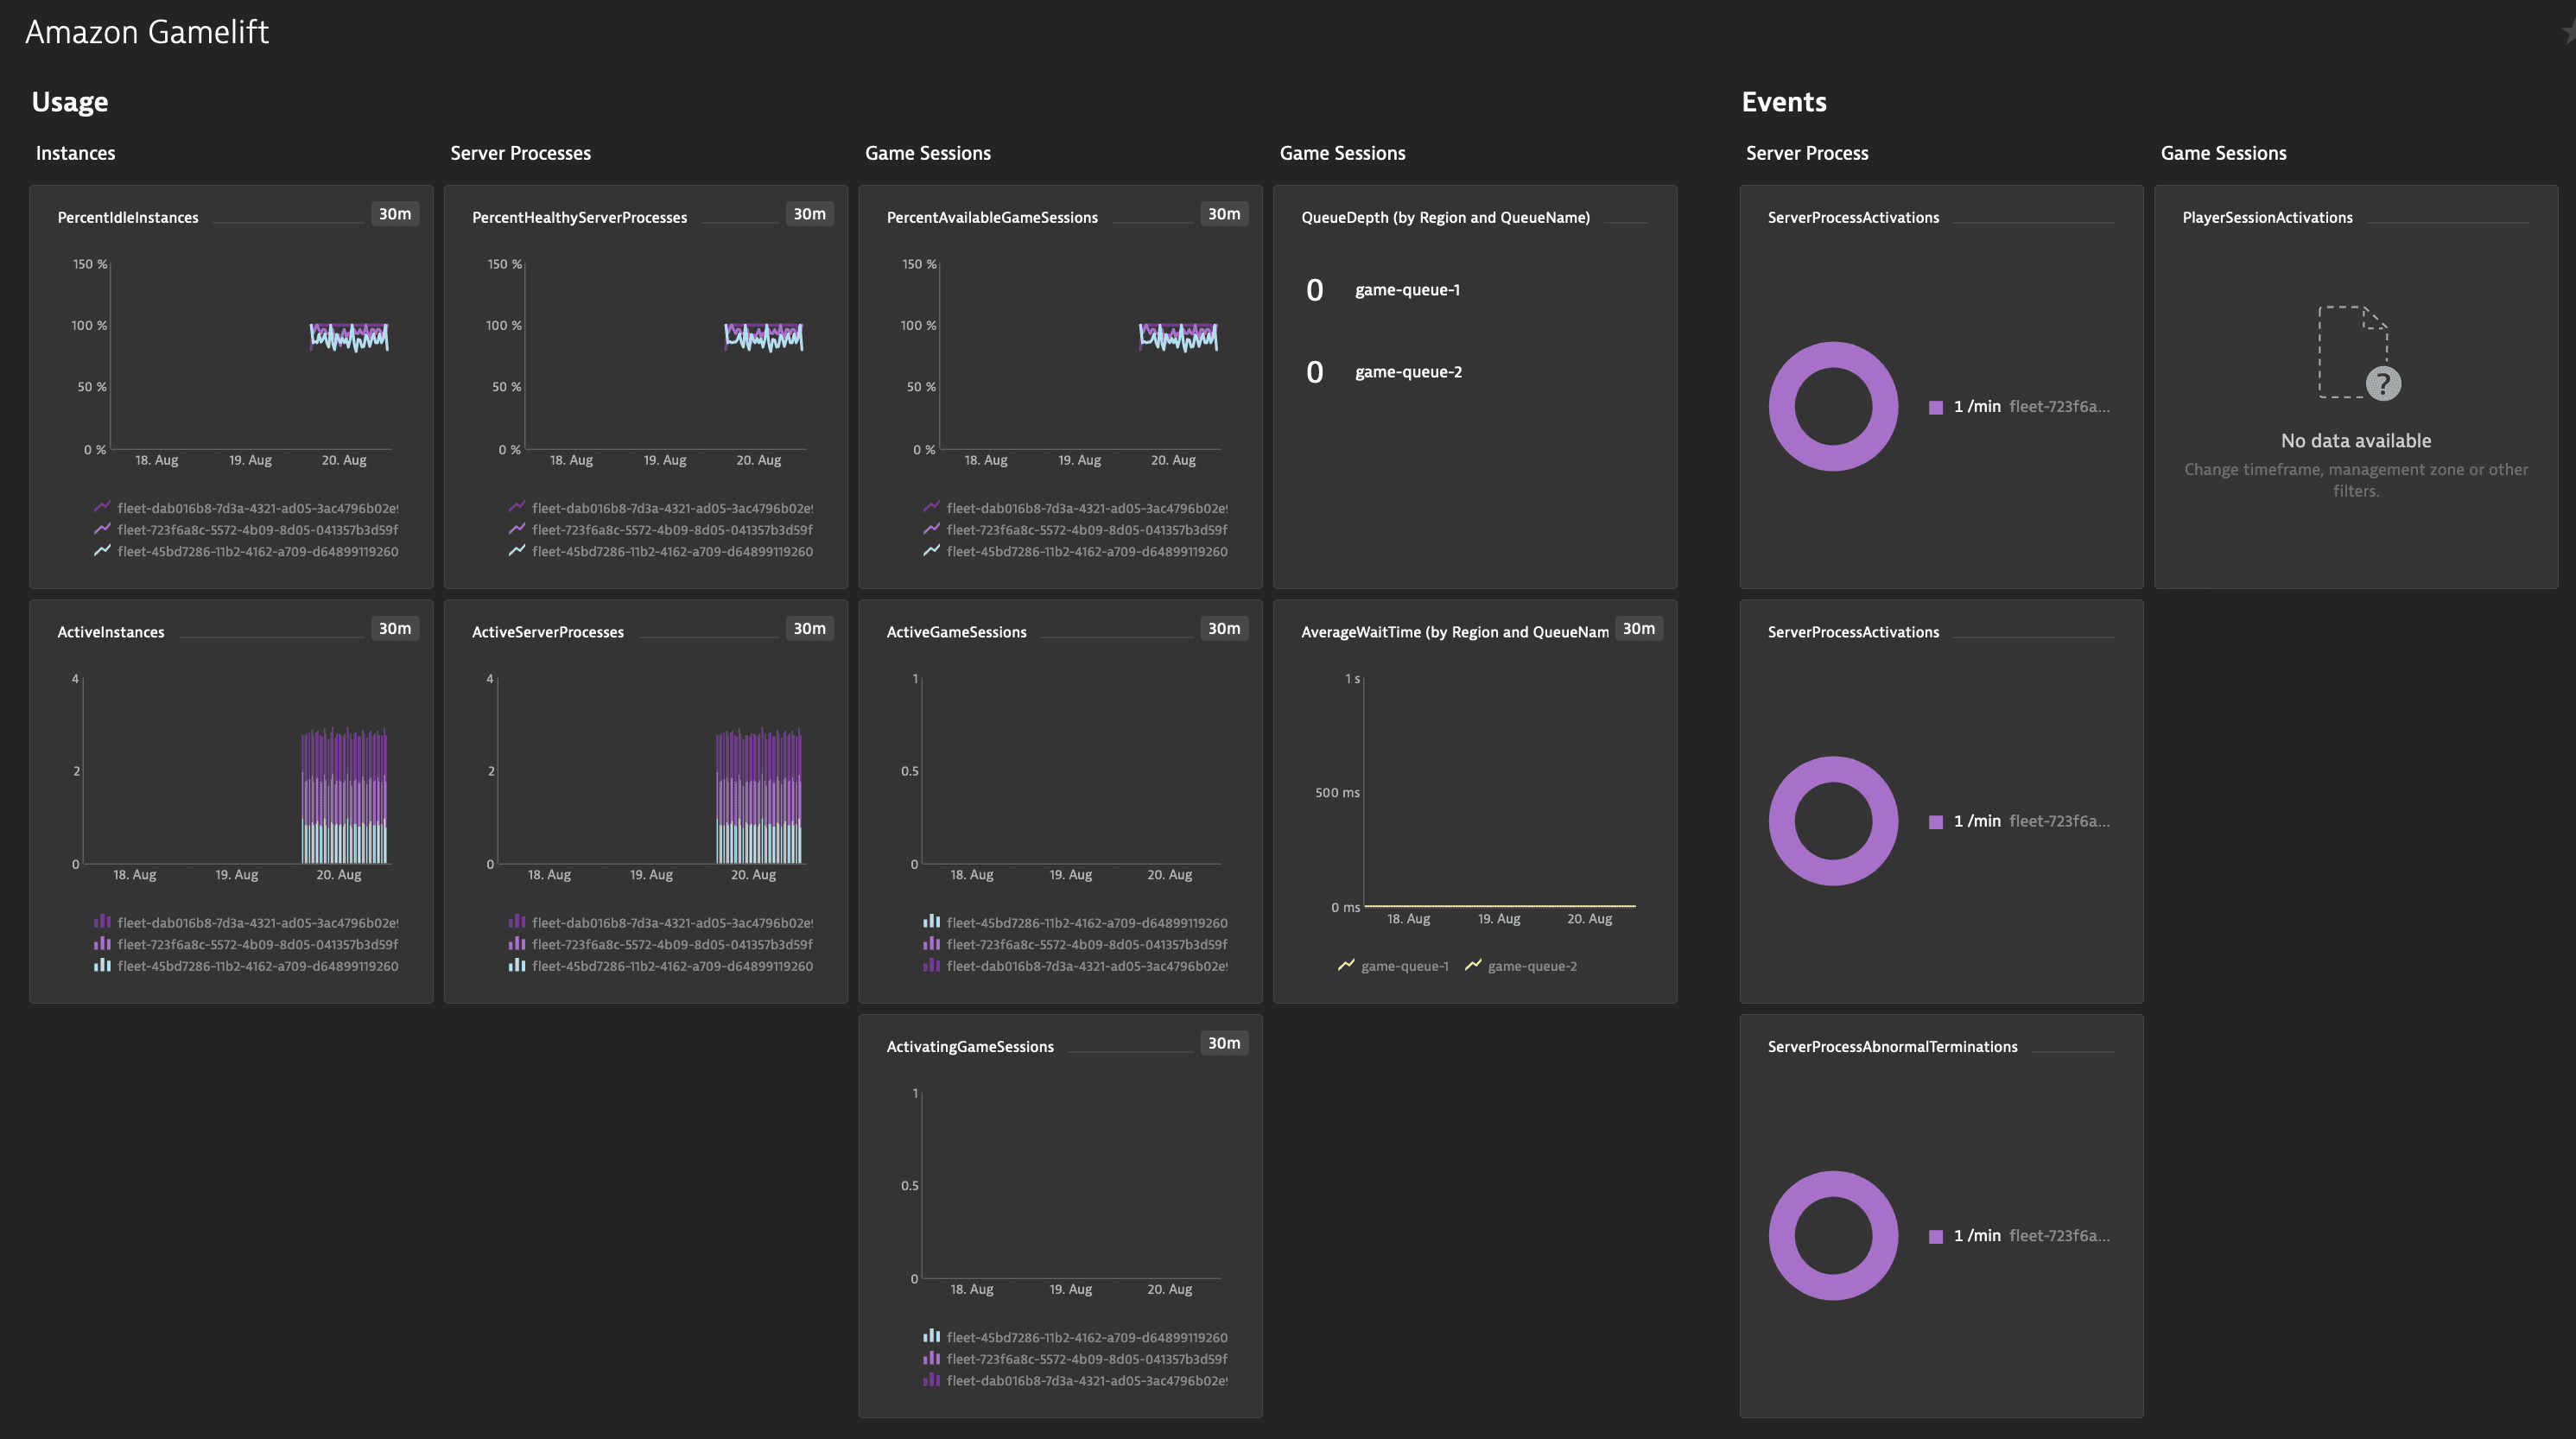
Available metrics
| Name | Description | Unit | Statistics | Dimensions | Recommended |
|---|---|---|---|---|---|
| ActivatingGameSessions | Game sessions with Activating status, which means they are in the process of starting up | Count | Multi | FleetId | |
| ActivatingGameSessions | Count | Multi | Region, MetricGroups | ||
| ActiveGameSessions | Game sessions with Active status, which means they are able to host players, and are hosting zero or more players | Count | Multi | FleetId | |
| ActiveGameSessions | Count | Multi | Region, MetricGroups | ||
| ActiveInstances | Instances with Active status, which means they are running active server processes | Count | Multi | FleetId | |
| ActiveInstances | Count | Multi | Region, MetricGroups | ||
| ActiveServerProcesses | Server processes with Active status, which means they are running and able to host game session | Count | Multi | FleetId | |
| ActiveServerProcesses | Count | Multi | Region, MetricGroups | ||
| AvailableGameSessions | Active, healthy server processes that are not currently being used to host a game session and can start a new game session without a delay to spin up new server processes or instances | Count | Multi | FleetId | |
| AvailableGameSessions | Count | Multi | Region, MetricGroups | ||
| AverageWaitTime | Average amount of time that game session placement requests in the queue in Pending status have been waiting to be fulfilled | Seconds | Multi | Region, QueueName | |
| AverageWaitTime | Seconds | Sum | Region, QueueName | ||
| CurrentPlayerSessions | Player sessions with either Active status (player is connected to an active game session) or Reserved status (player has been given a slot in a game session but hasn't yet connected) | Count | Multi | FleetId | |
| CurrentPlayerSessions | Count | Multi | Region, MetricGroups | ||
| CurrentTickets | Matchmaking requests currently being processed or waiting to be processed | Count | Multi | Region, ConfigurationName | |
| CurrentTickets | Count | Sum | Region, ConfigurationName | ||
| DesiredInstances | Target number of active instances that GameLift is working to maintain in the fleet | Count | Multi | FleetId | |
| FirstChoiceNotViable | Game sessions successfully placed but that aren't in the first-choice fleet, because that fleet isn't considered viable (such as a spot fleet with a high interruption rate) | Count/Minute | Multi | Region | |
| FirstChoiceNotViable | Count/Minute | Multi | Region, QueueName | ||
| FirstChoiceNotViable | Count/Minute | Sum | Region | ||
| FirstChoiceNotViable | Count/Minute | Sum | Region, QueueName | ||
| FirstChoiceOutOfCapacity | Game sessions successfully placed but that aren't in the first-choice fleet, because that fleet doesn't have any available resources | Count/Minute | Multi | Region | |
| FirstChoiceOutOfCapacity | Count/Minute | Multi | Region, QueueName | ||
| FirstChoiceOutOfCapacity | Count/Minute | Sum | Region | ||
| FirstChoiceOutOfCapacity | Count/Minute | Sum | Region, QueueName | ||
| GameSessionInterruptions | Number of game sessions on spot instances that have been interrupted | Count/Minute | Multi | FleetId | |
| GameSessionInterruptions | Count/Minute | Multi | Region, MetricGroups | ||
| GameSessionInterruptions | Count/Minute | Sum | FleetId | ||
| GameSessionInterruptions | Count/Minute | Sum | Region, MetricGroups | ||
| HealthyServerProcesses | Active server processes that are reporting healthy | Count | Multi | FleetId | |
| HealthyServerProcesses | Count | Multi | Region, MetricGroups | ||
| IdleInstances | Active instances that are currently hosting zero (0) game sessions. This metric measures capacity that is available but unused. | Count | Multi | FleetId | |
| IdleInstances | Count | Multi | Region, MetricGroups | ||
| InstanceInterruptions | Number of spot instances that have been interrupted | Count/Minute | Multi | FleetId | |
| InstanceInterruptions | Count/Minute | Multi | Region, MetricGroups | ||
| InstanceInterruptions | Count/Minute | Sum | FleetId | ||
| InstanceInterruptions | Count/Minute | Sum | Region, MetricGroups | ||
| LowestLatencyPlacement | Game sessions that were successfully placed in a region that offers the queue's lowest possible latency for the players | Count/Minute | Multi | Region | |
| LowestLatencyPlacement | Count/Minute | Multi | Region, QueueName | ||
| LowestLatencyPlacement | Count/Minute | Sum | Region | ||
| LowestLatencyPlacement | Count/Minute | Sum | Region, QueueName | ||
| LowestPricePlacement | Game sessions that were successfully placed in a fleet with the queue's lowest possible price for the chosen region | Count/Minute | Multi | Region | |
| LowestPricePlacement | Count/Minute | Multi | Region, QueueName | ||
| LowestPricePlacement | Count/Minute | Sum | Region | ||
| LowestPricePlacement | Count/Minute | Sum | Region, QueueName | ||
| MatchAcceptancesTimedOut | For matchmaking configurations that require acceptance, the potential matches that timed out during acceptance since the last report | Count/Minute | Sum | Region, ConfigurationName | |
| MatchesAccepted | For matchmaking configurations that require acceptance, the potential matches that were accepted since the last report | Count/Minute | Sum | Region, ConfigurationName | |
| MatchesCreated | Potential matches that were created since the last report | Count/Minute | Sum | Region, ConfigurationName | |
| MatchesPlaced | Matches that were successfully placed into a game session since the last report | Count/Minute | Sum | Region, ConfigurationName | |
| MatchesRejected | For matchmaking configurations that require acceptance, the potential matches that were rejected by at least one player since the last report | Count/Minute | Sum | Region, ConfigurationName | |
| MaxInstances | Maximum number of instances that are allowed for the fleet | Count | Multi | FleetId | |
| MinInstances | Minimum number of instances allowed for the fleet | Count | Multi | FleetId | |
| PercentAvailableGameSessions | Percentage of game session slots on all active server processes (healthy or unhealthy) that are not currently being used (calculated as AvailableGameSessions / [ActiveGameSessions + AvailableGameSessions + unhealthy server processes]) | Percent | Average | FleetId | |
| PercentAvailableGameSessions | Percent | Average | Region, MetricGroups | ||
| PercentHealthyServerProcesses | Percentage of all active server processes that are reporting healthy (calculated as HealthyServerProcesses / ActiveServerProcesses) | Percent | Multi | FleetId | |
| PercentHealthyServerProcesses | Percent | Multi | Region, MetricGroups | ||
| PercentIdleInstances | Percentage of all active instances that are idle (calculated as IdleInstances / ActiveInstances) | Percent | Multi | FleetId | |
| PercentIdleInstances | Percent | Multi | Region, MetricGroups | ||
| PlacementsCanceled | Game session placement requests canceled before timing out since the last report | Count/Minute | Multi | Region, QueueName | |
| PlacementsCanceled | Count/Minute | Sum | Region, QueueName | ||
| PlacementsFailed | Game session placement requests that failed for any reason since the last report | Count/Minute | Multi | Region, QueueName | |
| PlacementsFailed | Count/Minute | Sum | Region, QueueName | ||
| PlacementsStarted | New game session placement requests added to the queue since the last report | Count/Minute | Multi | Region, QueueName | |
| PlacementsStarted | Count/Minute | Sum | Region, QueueName | ||
| PlacementsSucceeded | Game session placement requests that resulted in a new game session since the last report | Count/Minute | Multi | Region, QueueName | |
| PlacementsSucceeded | Count/Minute | Sum | Region, QueueName | ||
| PlacementsTimedOut | Game session placement requests that reached the queue's timeout limit without being fulfilled since the last report | Count/Minute | Multi | Region, QueueName | |
| PlacementsTimedOut | Count/Minute | Sum | Region, QueueName | ||
| PlayerSessionActivations | Player sessions that transitioned from Reserved to Active status since the last report | Count/Minute | Multi | FleetId | |
| PlayerSessionActivations | Count/Minute | Multi | Region, MetricGroups | ||
| PlayerSessionActivations | Count/Minute | Sum | FleetId | ||
| PlayerSessionActivations | Count/Minute | Sum | Region, MetricGroups | ||
| PlayersStarted | Players in matchmaking tickets that were added since the last report | Count/Minute | Sum | Region, ConfigurationName | |
| QueueDepth | Number of game session placement requests in the queue with Pending status | Count | Multi | Region, QueueName | |
| QueueDepth | Count | Sum | Region, QueueName | ||
| ServerProcessAbnormalTerminations | Server processes that were shut down due to abnormal circumstances since the last report | Count/Minute | Multi | FleetId | |
| ServerProcessAbnormalTerminations | Count/Minute | Sum | FleetId | ||
| ServerProcessAbnormalTerminations | Count/Minute | Multi | Region, MetricGroups | ||
| ServerProcessAbnormalTerminations | Count/Minute | Sum | Region, MetricGroups | ||
| ServerProcessActivations | Server processes that successfully transitioned from Activating to Active status since the last report | Count/Minute | Multi | FleetId | |
| ServerProcessActivations | Count/Minute | Sum | FleetId | ||
| ServerProcessActivations | Count/Minute | Multi | Region, MetricGroups | ||
| ServerProcessActivations | Count/Minute | Sum | Region, MetricGroups | ||
| ServerProcessTerminations | Server processes that were shut down since the last report | Count/Minute | Multi | FleetId | |
| ServerProcessTerminations | Count/Minute | Sum | FleetId | ||
| ServerProcessTerminations | Count/Minute | Multi | Region, MetricGroups | ||
| ServerProcessTerminations | Count/Minute | Sum | Region, MetricGroups | ||
| TicketsFailed | Matchmaking requests that resulted in failure since the last report | Count/Minute | Sum | Region, ConfigurationName | |
| TicketsStarted | New matchmaking requests that were created since the last report | Count/Minute | Sum | Region, ConfigurationName | |
| TicketsTimedOut | Matchmaking requests that reached the timeout limit since the last report | Count/Minute | Sum | Region, ConfigurationName | |
| TimeToMatch | For matchmaking requests that were put into a potential match before the last report, the amount of time between ticket creation and potential match creation | Seconds | Multi | Region, ConfigurationName | |
| TimeToTicketCancel | For matchmaking requests that were canceled before the last report, the amount of time between ticket creation and cancellation | Seconds | Multi | Region, ConfigurationName | |
| TimeToTicketSuccess | For matchmaking requests that succeeded before the last report, the amount of time between ticket creation and successful match placement | Seconds | Multi | Region, ConfigurationName |