Amazon Application and Network Load Balancer (built-in) monitoring
Dynatrace ingests metrics for multiple preselected namespaces, including Amazon Application and Network Load Balancer. You can view metrics for each service instance, split metrics into multiple dimensions, and create custom charts that you can pin to your dashboards.
Prerequisites
To enable monitoring for this service, you need:
-
Any version of ActiveGate in both Dynatrace SaaS and Managed deployments.
-
An updated AWS monitoring policy to include the additional AWS services.
To update the AWS IAM policy, use the JSON below, containing the monitoring policy (permissions) for all cloud services.
{"Version": "2012-10-17","Statement": [{"Sid": "VisualEditor0","Effect": "Allow","Action": ["acm-pca:ListCertificateAuthorities","apigateway:GET","apprunner:ListServices","appstream:DescribeFleets","appsync:ListGraphqlApis","athena:ListWorkGroups","autoscaling:DescribeAutoScalingGroups","cloudformation:ListStackResources","cloudfront:ListDistributions","cloudhsm:DescribeClusters","cloudsearch:DescribeDomains","cloudwatch:GetMetricData","cloudwatch:GetMetricStatistics","cloudwatch:ListMetrics","codebuild:ListProjects","datasync:ListTasks","dax:DescribeClusters","directconnect:DescribeConnections","dms:DescribeReplicationInstances","dynamodb:ListTables","dynamodb:ListTagsOfResource","ec2:DescribeAvailabilityZones","ec2:DescribeInstances","ec2:DescribeNatGateways","ec2:DescribeSpotFleetRequests","ec2:DescribeTransitGateways","ec2:DescribeVolumes","ec2:DescribeVpnConnections","ecs:ListClusters","eks:ListClusters","elasticache:DescribeCacheClusters","elasticbeanstalk:DescribeEnvironmentResources","elasticbeanstalk:DescribeEnvironments","elasticfilesystem:DescribeFileSystems","elasticloadbalancing:DescribeInstanceHealth","elasticloadbalancing:DescribeListeners","elasticloadbalancing:DescribeLoadBalancers","elasticloadbalancing:DescribeRules","elasticloadbalancing:DescribeTags","elasticloadbalancing:DescribeTargetHealth","elasticmapreduce:ListClusters","elastictranscoder:ListPipelines","es:ListDomainNames","events:ListEventBuses","firehose:ListDeliveryStreams","fsx:DescribeFileSystems","gamelift:ListFleets","glue:GetJobs","inspector:ListAssessmentTemplates","kafka:ListClusters","kinesis:ListStreams","kinesisanalytics:ListApplications","kinesisvideo:ListStreams","lambda:ListFunctions","lambda:ListTags","lex:GetBots","logs:DescribeLogGroups","mediaconnect:ListFlows","mediaconvert:DescribeEndpoints","mediapackage-vod:ListPackagingConfigurations","mediapackage:ListChannels","mediatailor:ListPlaybackConfigurations","opsworks:DescribeStacks","qldb:ListLedgers","rds:DescribeDBClusters","rds:DescribeDBInstances","rds:DescribeEvents","rds:ListTagsForResource","redshift:DescribeClusters","robomaker:ListSimulationJobs","route53:ListHostedZones","route53resolver:ListResolverEndpoints","s3:ListAllMyBuckets","sagemaker:ListEndpoints","sns:ListTopics","sqs:ListQueues","storagegateway:ListGateways","sts:GetCallerIdentity","swf:ListDomains","tag:GetResources","tag:GetTagKeys","transfer:ListServers","workmail:ListOrganizations","workspaces:DescribeWorkspaces"],"Resource": "*"}]}
If you don't want to add permissions to all services, and just select permissions for certain services, consult the table below. The table contains a set of permissions that are required for All AWS cloud services and, for each cloud service, a list of optional permissions specific to that service.
"cloudwatch:GetMetricData""cloudwatch:GetMetricStatistics""cloudwatch:ListMetrics""sts:GetCallerIdentity""tag:GetResources""tag:GetTagKeys""ec2:DescribeAvailabilityZones"
| Name | Permissions |
|---|---|
| All monitored Amazon services required | cloudwatch:GetMetricData,cloudwatch:GetMetricStatistics,cloudwatch:ListMetrics,sts:GetCallerIdentity,tag:GetResources,tag:GetTagKeys,ec2:DescribeAvailabilityZones |
| AWS Certificate Manager Private Certificate Authority | acm-pca:ListCertificateAuthorities |
| Amazon MQ | |
| Amazon API Gateway | apigateway:GET |
| AWS App Runner | apprunner:ListServices |
| Amazon AppStream | appstream:DescribeFleets |
| AWS AppSync | appsync:ListGraphqlApis |
| Amazon Athena | athena:ListWorkGroups |
| Amazon Aurora | rds:DescribeDBClusters |
| Amazon EC2 Auto Scaling | autoscaling:DescribeAutoScalingGroups |
| Amazon EC2 Auto Scaling (built-in) | autoscaling:DescribeAutoScalingGroups |
| AWS Billing | |
| Amazon Keyspaces | |
| AWS Chatbot | |
| Amazon CloudFront | cloudfront:ListDistributions |
| AWS CloudHSM | cloudhsm:DescribeClusters |
| Amazon CloudSearch | cloudsearch:DescribeDomains |
| AWS CodeBuild | codebuild:ListProjects |
| Amazon Cognito | |
| Amazon Connect | |
| Amazon Elastic Kubernetes Service (EKS) | eks:ListClusters |
| AWS DataSync | datasync:ListTasks |
| Amazon DynamoDB Accelerator (DAX) | dax:DescribeClusters |
| AWS Database Migration Service (AWS DMS) | dms:DescribeReplicationInstances |
| Amazon DocumentDB | rds:DescribeDBClusters |
| AWS Direct Connect | directconnect:DescribeConnections |
| Amazon DynamoDB | dynamodb:ListTables |
| Amazon DynamoDB (built-in) | dynamodb:ListTables,dynamodb:ListTagsOfResource |
| Amazon EBS | ec2:DescribeVolumes |
| Amazon EBS (built-in) | ec2:DescribeVolumes |
| Amazon EC2 API | |
| Amazon EC2 (built-in) | ec2:DescribeInstances |
| Amazon EC2 Spot Fleet | ec2:DescribeSpotFleetRequests |
| Amazon Elastic Container Service (ECS) | ecs:ListClusters |
| Amazon ECS Container Insights | ecs:ListClusters |
| Amazon ElastiCache (EC) | elasticache:DescribeCacheClusters |
| AWS Elastic Beanstalk | elasticbeanstalk:DescribeEnvironments |
| Amazon Elastic File System (EFS) | elasticfilesystem:DescribeFileSystems |
| Amazon Elastic Inference | |
| Amazon Elastic Map Reduce (EMR) | elasticmapreduce:ListClusters |
| Amazon Elasticsearch Service (ES) | es:ListDomainNames |
| Amazon Elastic Transcoder | elastictranscoder:ListPipelines |
| Amazon Elastic Load Balancer (ELB) (built-in) | elasticloadbalancing:DescribeInstanceHealth,elasticloadbalancing:DescribeListeners,elasticloadbalancing:DescribeLoadBalancers,elasticloadbalancing:DescribeRules,elasticloadbalancing:DescribeTags,elasticloadbalancing:DescribeTargetHealth |
| Amazon EventBridge | events:ListEventBuses |
| Amazon FSx | fsx:DescribeFileSystems |
| Amazon GameLift | gamelift:ListFleets |
| AWS Glue | glue:GetJobs |
| Amazon Inspector | inspector:ListAssessmentTemplates |
| AWS Internet of Things (IoT) | |
| AWS IoT Analytics | |
| Amazon Managed Streaming for Kafka | kafka:ListClusters |
| Amazon Kinesis Data Analytics | kinesisanalytics:ListApplications |
| Amazon Kinesis Data Firehose | firehose:ListDeliveryStreams |
| Amazon Kinesis Data Streams | kinesis:ListStreams |
| Amazon Kinesis Video Streams | kinesisvideo:ListStreams |
| AWS Lambda | lambda:ListFunctions |
| AWS Lambda (built-in) | lambda:ListFunctions,lambda:ListTags |
| Amazon Lex | lex:GetBots |
| Amazon Application and Network Load Balancer (built-in) | elasticloadbalancing:DescribeInstanceHealth,elasticloadbalancing:DescribeListeners,elasticloadbalancing:DescribeLoadBalancers,elasticloadbalancing:DescribeRules,elasticloadbalancing:DescribeTags,elasticloadbalancing:DescribeTargetHealth |
| Amazon CloudWatch Logs | logs:DescribeLogGroups |
| AWS Elemental MediaConnect | mediaconnect:ListFlows |
| AWS Elemental MediaConvert | mediaconvert:DescribeEndpoints |
| AWS Elemental MediaPackage Live | mediapackage:ListChannels |
| AWS Elemental MediaPackage Video on Demand | mediapackage-vod:ListPackagingConfigurations |
| AWS Elemental MediaTailor | mediatailor:ListPlaybackConfigurations |
| Amazon VPC NAT Gateways | ec2:DescribeNatGateways |
| Amazon Neptune | rds:DescribeDBClusters |
| AWS OpsWorks | opsworks:DescribeStacks |
| Amazon Polly | |
| Amazon QLDB | qldb:ListLedgers |
| Amazon RDS | rds:DescribeDBInstances |
| Amazon RDS (built-in) | rds:DescribeDBInstances,rds:DescribeEvents,rds:ListTagsForResource |
| Amazon Redshift | redshift:DescribeClusters |
| Amazon Rekognition | |
| AWS RoboMaker | robomaker:ListSimulationJobs |
| Amazon Route 53 | route53:ListHostedZones |
| Amazon Route 53 Resolver | route53resolver:ListResolverEndpoints |
| Amazon S3 | s3:ListAllMyBuckets |
| Amazon S3 (built-in) | s3:ListAllMyBuckets |
| Amazon SageMaker Batch Transform Jobs | |
| Amazon SageMaker Endpoint Instances | sagemaker:ListEndpoints |
| Amazon SageMaker Endpoints | sagemaker:ListEndpoints |
| Amazon SageMaker Ground Truth | |
| Amazon SageMaker Processing Jobs | |
| Amazon SageMaker Training Jobs | |
| AWS Service Catalog | |
| Amazon Simple Email Service (SES) | |
| Amazon Simple Notification Service (SNS) | sns:ListTopics |
| Amazon Simple Queue Service (SQS) | sqs:ListQueues |
| AWS Systems Manager - Run Command | |
| AWS Step Functions | |
| AWS Storage Gateway | storagegateway:ListGateways |
| Amazon SWF | swf:ListDomains |
| Amazon Textract | |
| AWS IoT Things Graph | |
| AWS Transfer Family | transfer:ListServers |
| AWS Transit Gateway | ec2:DescribeTransitGateways |
| Amazon Translate | |
| AWS Trusted Advisor | |
| AWS API Usage | |
| AWS Site-to-Site VPN | ec2:DescribeVpnConnections |
| AWS WAF Classic | |
| AWS WAF | |
| Amazon WorkMail | workmail:ListOrganizations |
| Amazon WorkSpaces | workspaces:DescribeWorkspaces |
Example of JSON policy for one single service.
{"Version": "2012-10-17","Statement": [{"Sid": "VisualEditor0","Effect": "Allow","Action": ["apigateway:GET","cloudwatch:GetMetricData","cloudwatch:GetMetricStatistics","cloudwatch:ListMetrics","sts:GetCallerIdentity","tag:GetResources","tag:GetTagKeys","ec2:DescribeAvailabilityZones"],"Resource": "*"}]}
In this example, from the complete list of permissions you need to select
-
"apigateway:GET"for Amazon API Gateway -
"cloudwatch:GetMetricData","cloudwatch:GetMetricStatistics","cloudwatch:ListMetrics","sts:GetCallerIdentity","tag:GetResources","tag:GetTagKeys", and"ec2:DescribeAvailabilityZones"for All AWS cloud services. -
To disable monitoring of built-in services, you need Environment ActiveGate version 1.245+ and Dynatrace version 1.247+.
Enable monitoring
To learn how to enable service monitoring, see Enable service monitoring.
View service metrics
You can view the service metrics in your Dynatrace environment either on the AWS account page or on your Dashboards page.
View metrics on the AWS account page
To view metrics on the AWS account page
- Go to AWS or AWS Classic (latest Dynatrace).
Choose AWS account you want to check metrics for.
- Select Service box. Metrics for the selected service are visible under the infographic in the service section.
View metrics on the Dashboard
You can also create your own dashboard. For more information on how to create dashboards, go to Create and edit Dynatrace dashboards
This is a built-in service. It's monitored out-of-the-box once a new AWS integration instance is created. For built-in services, all metrics are recommended (changing configuration is not possible).
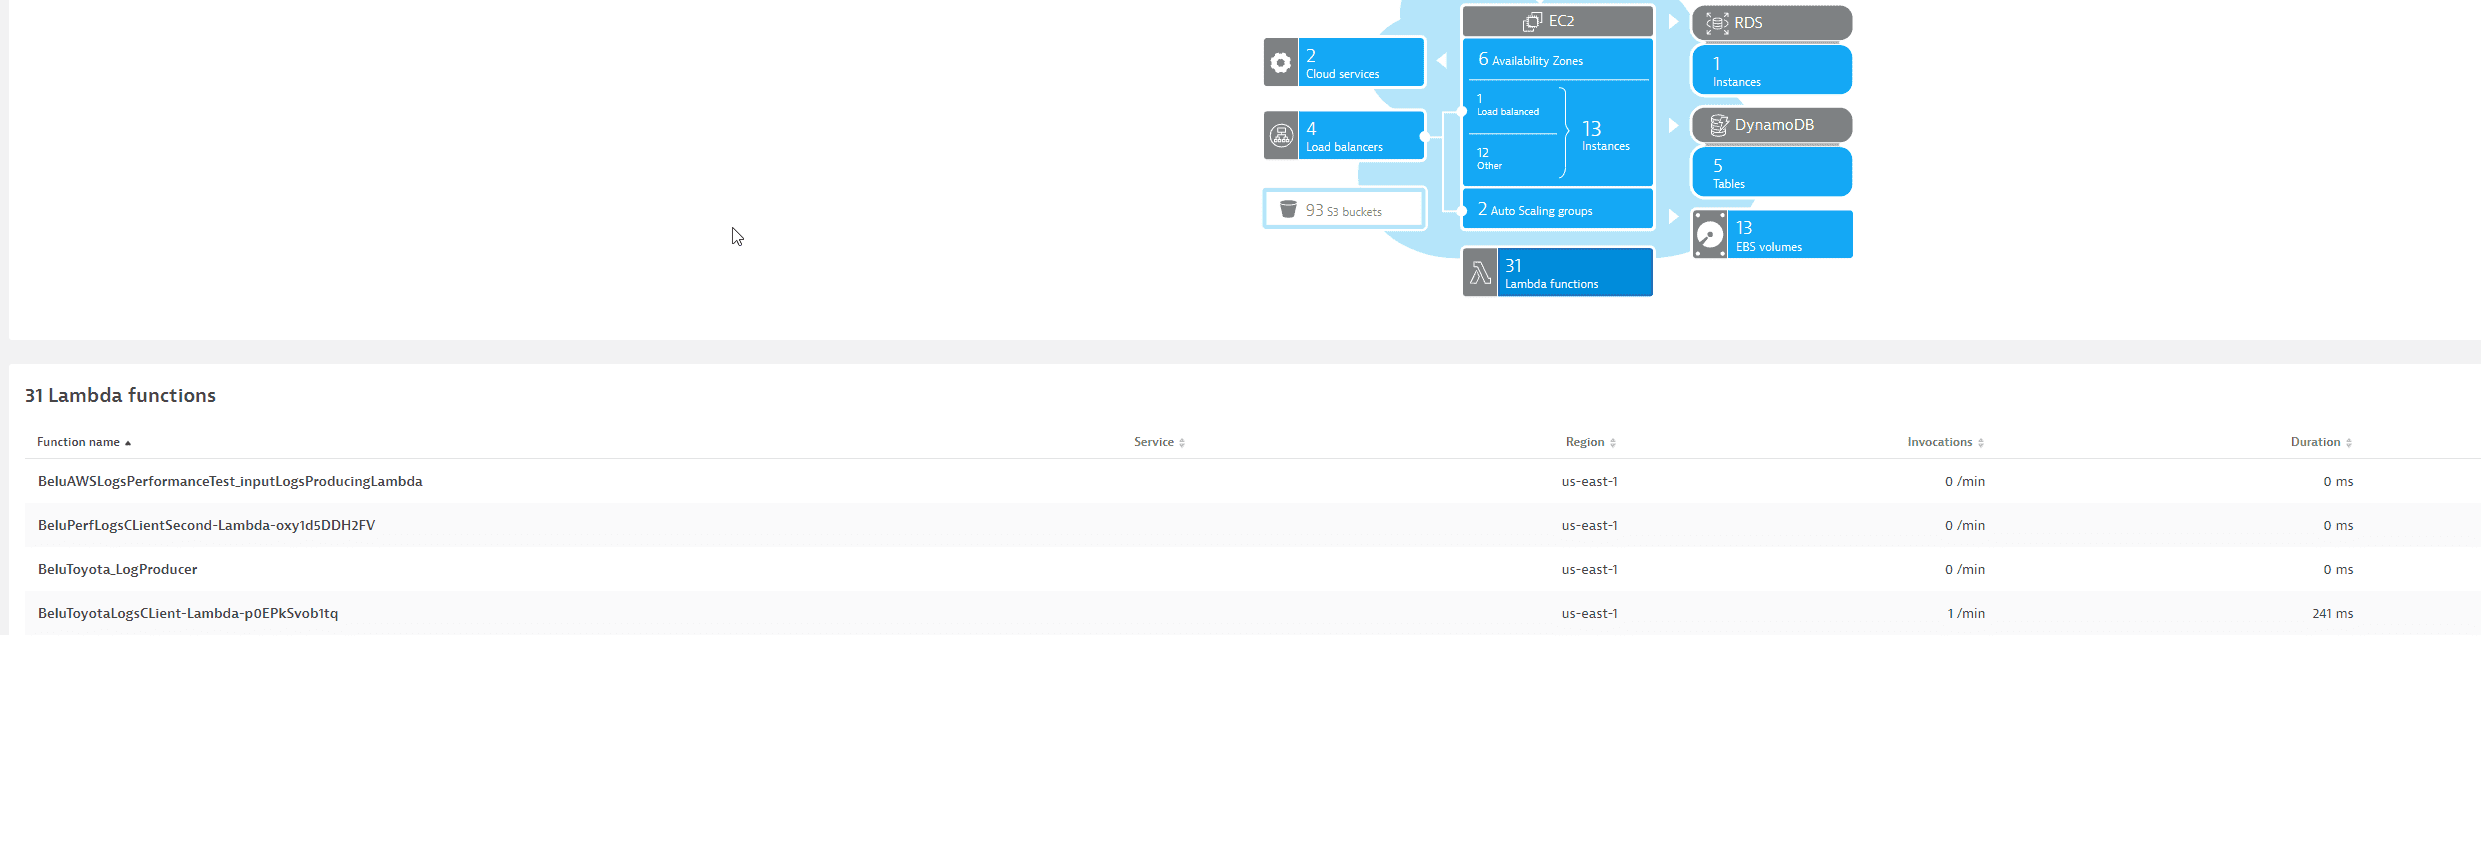
Example of AWS built-in monitoring service
Available metrics
Application Load Balancer metrics
| Metric key | Name | Unit | Aggregations | Monitoring consumption |
|---|---|---|---|---|
| builtin:cloud | ALB number of active connections | Count | autoavgmaxmin | DDUs |
| builtin:cloud | ALB number of new connections | Count | autovalue | DDUs |
| builtin:cloud | ALB number of 4XX errors | Count | autovalue | DDUs |
| builtin:cloud | ALB number of 5XX errors | Count | autovalue | DDUs |
| builtin:cloud | ALB number of 4XX target errors | Count | autovalue | DDUs |
| builtin:cloud | ALB number of 5XX target errors | Count | autovalue | DDUs |
| builtin:cloud | ALB number of rejected connections | Count | autovalue | DDUs |
| builtin:cloud | ALB number of target connection errors | Count | autovalue | DDUs |
| builtin:cloud | ALB number of client TLS negotiation errors | Count | autovalue | DDUs |
| builtin:cloud | ALB number of processed bytes | Count | autovalue | DDUs |
| builtin:cloud | ALB number of consumed LCUs | Count | autovalue | DDUs |
| builtin:cloud | ALB number of requests | Count | autovalue | DDUs |
| builtin:cloud | ALB target response time | Second | autoavgmaxmin | DDUs |
Network Load Balancer metrics
| Metric key | Name | Unit | Aggregations | Monitoring consumption |
|---|---|---|---|---|
| builtin:cloud | NLB number of active flows | Count | autoavgmaxmin | DDUs |
| builtin:cloud | NLB number of new flows | Count | autovalue | DDUs |
| builtin:cloud | NLB number of client resets | Count | autovalue | DDUs |
| builtin:cloud | NLB number of resets | Count | autovalue | DDUs |
| builtin:cloud | NLB number of target resets | Count | autovalue | DDUs |
| builtin:cloud | NLB number of processed bytes | Count | autovalue | DDUs |
| builtin:cloud | NLB number of consumed LCUs | Count | autovalue | DDUs |