Trace .NET Lambda functions
Dynatrace uses OpenTelemetry to monitor AWS Lambda invocations.
Prerequisites
Ensure that you use a supported AWS Lambda runtime and that you have followed the initial configuration steps described in Configuration for monitoring AWS Lambda with OpenTelemetry before using the packages below.
The following NuGet packages can be used to cover different aspects of AWS Lambda tracing:
- recommended OpenTelemetry.Instrumentation.AWSLambda version 1.2.0-beta.1+—contains methods to trace incoming AWS Lambda invocations, such as calls triggered by AWS SQS/SNS messages.
- recommended OpenTelemetry.Instrumentation.AWS version 1.1.0-beta.1+—traces outgoing AWS SDK calls to other AWS Lambda invocations and calls to AWS services, such as DynamoDB, SQS, and SNS.
- required
Dynatrace.OpenTelemetry.Instrumentation.AwsLambda—enables linking through outgoing AWS Lambda Invoke SDK calls from one Lambda to another. This is the only way to link these kinds of requests; however, if you don't need such linking or don't use the AWS Lambda client SDK to invoke or receive other Lambda invocations, you can replace the package withDynatrace.OpenTelemetry.
Installation
Any of the above-listed packages can be installed via the CLI. For example, Dynatrace.OpenTelemetry.Instrumentation.AwsLambda can be installed using the following command:
dotnet add package Dynatrace.OpenTelemetry.Instrumentation.AwsLambda
Some packages may require you to specify a version explicitly or use the --prerelease command line flag, such as
dotnet add package --prerelease OpenTelemetry.Instrumentation.AWSLambda.
Compatibility with OpenTelemetry and System.Diagnostics.DiagnosticSource versions
Periodically, we need to upgrade the minimum version of the OpenTelemetry NuGet package
our components depend on, and consequently, the minimum version of the System.Diagnostics.DiagnosticSource library.
This table lists the compatibility between Dynatrace.OpenTelemetry, OpenTelemetry, and System.Diagnostics.DiagnosticSource versions.
Dynatrace.OpenTelemetry version | Minimum OpenTelemetry version | Minimum System.Diagnostics.DiagnosticSource version |
|---|---|---|
| 1.273 and earlier | 1.1.0 | 5.0.1 |
| 1.275+ | 1.3.1 | 6.0.0 |
You don't usually need to worry about these dependencies as they're defined for you in our NuGet package. This
means that when you upgrade Dynatrace.OpenTelemetry, NuGet might implicitly upgrade your OpenTelemetry or
System.Diagnostics.DiagnosticSource version if you are currently on an earlier one.
Initialization
The initialization code for AWS Lambda tracing in your Function.cs file could look as follows (where Function is the configured Lambda handler class):
using System.Threading.Tasks;using Amazon.Lambda.Core;using Dynatrace.OpenTelemetry;using Dynatrace.OpenTelemetry.Instrumentation.AwsLambda;using OpenTelemetry;using OpenTelemetry.Instrumentation.AWSLambda;using OpenTelemetry.Trace;[assembly: LambdaSerializer(typeof(Amazon.Lambda.Serialization.SystemTextJson.DefaultLambdaJsonSerializer))]namespace Examples.AwsFunctionApp{public class Function{private static readonly TracerProvider TracerProvider;static Function(){DynatraceSetup.InitializeLogging();TracerProvider = Sdk.CreateTracerProviderBuilder().AddDynatrace()// Configures AWS Lambda invocations tracing.AddAWSLambdaConfigurations(c => c.DisableAwsXRayContextExtraction = true)// Instrumentation for creation of span (Activity) representing AWS SDK call.// Can be omitted if there are no outgoing AWS SDK calls to other AWS Lambdas and/or calls to AWS services like DynamoDB and SQS..AddAWSInstrumentation(c => c.SuppressDownstreamInstrumentation = true)// Adds injection of Dynatrace-specific context information in certain SDK calls (e.g. Lambda Invoke).// Can be omitted if there are no outgoing calls to other Lambdas via the AWS Lambda SDK..AddDynatraceAwsSdkInjection().Build();}}}
- Setting the option
DisableAwsXRayContextExtractiontotrueis required to skip Amazon X-Ray parent extraction, which may conflict with the Dynatrace propagation. - If the option
SuppressDownstreamInstrumentationis set totrue, HTTP child nodes will not be shown under AWS SDK calls.
Tracing incoming AWS Lambda calls
Example 1: Trace an AWS Lambda invoked via AWS SDK
In addition to the initialization part provided above, the handler method of a Lambda invoked via AWS SDK could look as follows:
using System.Threading.Tasks;using Amazon.Lambda.Core;using Dynatrace.OpenTelemetry;using Dynatrace.OpenTelemetry.Instrumentation.AwsLambda;using OpenTelemetry;using OpenTelemetry.Instrumentation.AWSLambda;using OpenTelemetry.Trace;[assembly: LambdaSerializer(typeof(Amazon.Lambda.Serialization.SystemTextJson.DefaultLambdaJsonSerializer))]namespace Examples.AwsFunctionApp{public class Function{private static readonly TracerProvider TracerProvider;// Use initialization code from the "Initialization" section of the docspublic Task FunctionHandlerAsync(object input, ILambdaContext context){var propagationContext = AwsLambdaHelpers.ExtractPropagationContext(context);return AWSLambdaWrapper.TraceAsync(TracerProvider, FunctionHandlerInternalAsync, input, context, propagationContext.ActivityContext);}private Task FunctionHandlerInternalAsync(object input, ILambdaContext context){// This is just an example of function handler and should be replaced by actual code.return Task.CompletedTask;}}}
- A parent context is extracted explicitly using the
AwsLambdaHelpersclass from theDynatrace.OpenTelemetry.Instrumentation.AwsLambdapackage. - An activity tracing the incoming request and the handler is created by the
TraceAsyncmethod. TraceAsyncshould be used when you trace an async function or a function returning a task. That way, the activity ends only when the task completes.
Example 2: Trace an AWS Lambda invoked via Amazon API Gateway (incoming HTTP request)
In addition to the initialization part provided above, the Lambda handler invoked via Amazon API Gateway could look as follows:
using Amazon.Lambda.APIGatewayEvents;using Amazon.Lambda.Core;using Dynatrace.OpenTelemetry;using Dynatrace.OpenTelemetry.Instrumentation.AwsLambda;using OpenTelemetry;using OpenTelemetry.Instrumentation.AWSLambda;using OpenTelemetry.Trace;[assembly: LambdaSerializer(typeof(Amazon.Lambda.Serialization.SystemTextJson.DefaultLambdaJsonSerializer))]namespace Examples.AwsFunctionApp{public class Function{private static readonly TracerProvider TracerProvider;// Use initialization code from the "Initialization" section of the docspublic APIGatewayHttpApiV2ProxyResponse FunctionHandler(APIGatewayHttpApiV2ProxyRequest request, ILambdaContext context){return AWSLambdaWrapper.Trace(TracerProvider, FunctionHandlerInternal, request, context);}private APIGatewayHttpApiV2ProxyResponse FunctionHandlerInternal(APIGatewayHttpApiV2ProxyRequest request, ILambdaContext context){// This is just an example of function handler and should be replaced by actual code.return new APIGatewayHttpApiV2ProxyResponse{StatusCode = 200,Body = "Example function result",};}}}
- A parent context is extracted from the incoming request in the
Trace(orTraceAsync) method. - An activity tracing the incoming request and the handler is created by the
Tracemethod. - In general, the
Trace/TraceAsyncmethods support any trigger, but extended support is available for theAPIGatewayProxyRequestandAPIGatewayHttpApiV2ProxyRequesttrigger types. For more details about request/response types, consult the GitHub documentation. Traceshould only be used when you have a function returning something other than aTask. For the asynchronous handler,TraceAsyncshould be used instead.
Example 3: Tracing without the AwsLambda package
If you prefer not to use the OpenTelemetry.Instrumentation.AWSLambda package, you can manually create an activity for Lambda. Note that this involves quite a bit of work, as Dynatrace requires certain activity tags (span attributes) to detect the service (conforming to the OpenTelemetry FaaS trace conventions
and resource conventions). You also need to manually extract the parent context.
For this example, only the Dynatrace.OpenTelemetry.Instrumentation.AwsLambda package is required.
using System;using System.Collections.Generic;using System.Diagnostics;using System.Reflection;using Amazon.Lambda.APIGatewayEvents;using Amazon.Lambda.Core;using Dynatrace.OpenTelemetry;using Dynatrace.OpenTelemetry.Instrumentation.AwsLambda;using OpenTelemetry;using OpenTelemetry.Context.Propagation;using OpenTelemetry.Trace;[assembly: LambdaSerializer(typeof(Amazon.Lambda.Serialization.SystemTextJson.DefaultLambdaJsonSerializer))]namespace Examples.AwsFunctionApp{public class Function{private static readonly TracerProvider TracerProvider;private static readonly ActivitySource ActivitySource;static Function(){DynatraceSetup.InitializeLogging();var activitySourceName = Assembly.GetExecutingAssembly().GetName().Name;ActivitySource = new ActivitySource(activitySourceName);TracerProvider = Sdk.CreateTracerProviderBuilder().AddSource(activitySourceName).AddDynatrace().Build();}public static IEnumerable<KeyValuePair<string, object>> GetFunctionTags(ILambdaContext context, string trigger){return new KeyValuePair<string, object>[]{new("faas.name", context.FunctionName),new("faas.id", context.InvokedFunctionArn),new("faas.trigger", trigger),new("cloud.platform", "aws_lambda"),new("cloud.provider", "aws"),new("cloud.region", Environment.GetEnvironmentVariable("AWS_REGION")),};}public APIGatewayProxyResponse FunctionHandler(APIGatewayHttpApiV2ProxyRequest apiGatewayProxyEvent, ILambdaContext context){try{var parentContext = ExtractParentContext(apiGatewayProxyEvent, context);using var activity = ActivitySource.StartActivity(ActivityKind.Server, parentContext, GetFunctionTags(context, "http"));return new APIGatewayProxyResponse{StatusCode = 200,Body = "Example function result",};}catch (Exception ex){context.Logger.LogLine($"Exception occurred while handling request: {ex.Message}");throw;}finally{TracerProvider?.ForceFlush();}}private static ActivityContext ExtractParentContext(APIGatewayHttpApiV2ProxyRequest apiGatewayProxyEvent, ILambdaContext context){var propagationContext = AwsLambdaHelpers.ExtractPropagationContext(context);if (propagationContext == default){propagationContext = Propagators.DefaultTextMapPropagator.Extract(default, apiGatewayProxyEvent, HeaderValuesGetter);}return propagationContext.ActivityContext;}private static IEnumerable<string> HeaderValuesGetter(APIGatewayHttpApiV2ProxyRequest apiGatewayProxyEvent, string name) =>(apiGatewayProxyEvent.Headers != null && apiGatewayProxyEvent.Headers.TryGetValue(name.ToLowerInvariant(), out var value)) ? new[] { value } : null;}}
Tracing AWS SDK calls
You can use open-source instrumentation NuGet packages to trace Amazon DynamoDB calls using client like AmazonDynamoDBClient or SQS and SNS calls using clients like AmazonSQSClientor AmazonSimpleNotificationServiceClient.
To set up tracing of AWS SDK calls,
-
Make sure that the following packages are added to your project:
OpenTelemetry.Instrumentation.AWSLambdaOpenTelemetry.Instrumentation.AWS
To learn more about the packages, see Prerequisites
-
After you add packages to your project, add the following initialization code:
using Dynatrace.OpenTelemetry;using OpenTelemetry;using OpenTelemetry.Trace;namespace Examples.AwsFunctionApp{public class Function{private static readonly TracerProvider TracerProvider;static Function(){DynatraceSetup.InitializeLogging();TracerProvider = Sdk.CreateTracerProviderBuilder().AddDynatrace().AddAWSLambdaConfigurations(c =>{c.DisableAwsXRayContextExtraction = true;c.SetParentFromBatch = true;})// Instrumentation used for tracing outgoing calls to AWS services via AWS SDK (including Amazon DynamoDB, SQS/SNS).// Can be omitted if no outgoing AWS SDK calls expected..AddAWSInstrumentation(c => c.SuppressDownstreamInstrumentation = true).Build();}}}SuppressDownstreamInstrumentation
When set totrue, HTTP child nodes will not be shown under AWS SDK calls.- SQS
SetParentFromBatch
It controls whether the parent Activity should be set when a potentially batched event is received where multiple parents would be available (e.g. SQS). When set totruethe parent is set using one of the received messages. Else, the parent is not set. In both cases, links will be created. DisableAwsXRayContextExtraction
We reccomend to set it totrueto skip Amazon X-Ray parent extraction and avoid conflicts with the Dynatrace propagation.
Tracing of Amazon DynamoDB operations
To trace Amazon DynamoDB calls, set up AWS SDK instrumentation. No additional code is required.
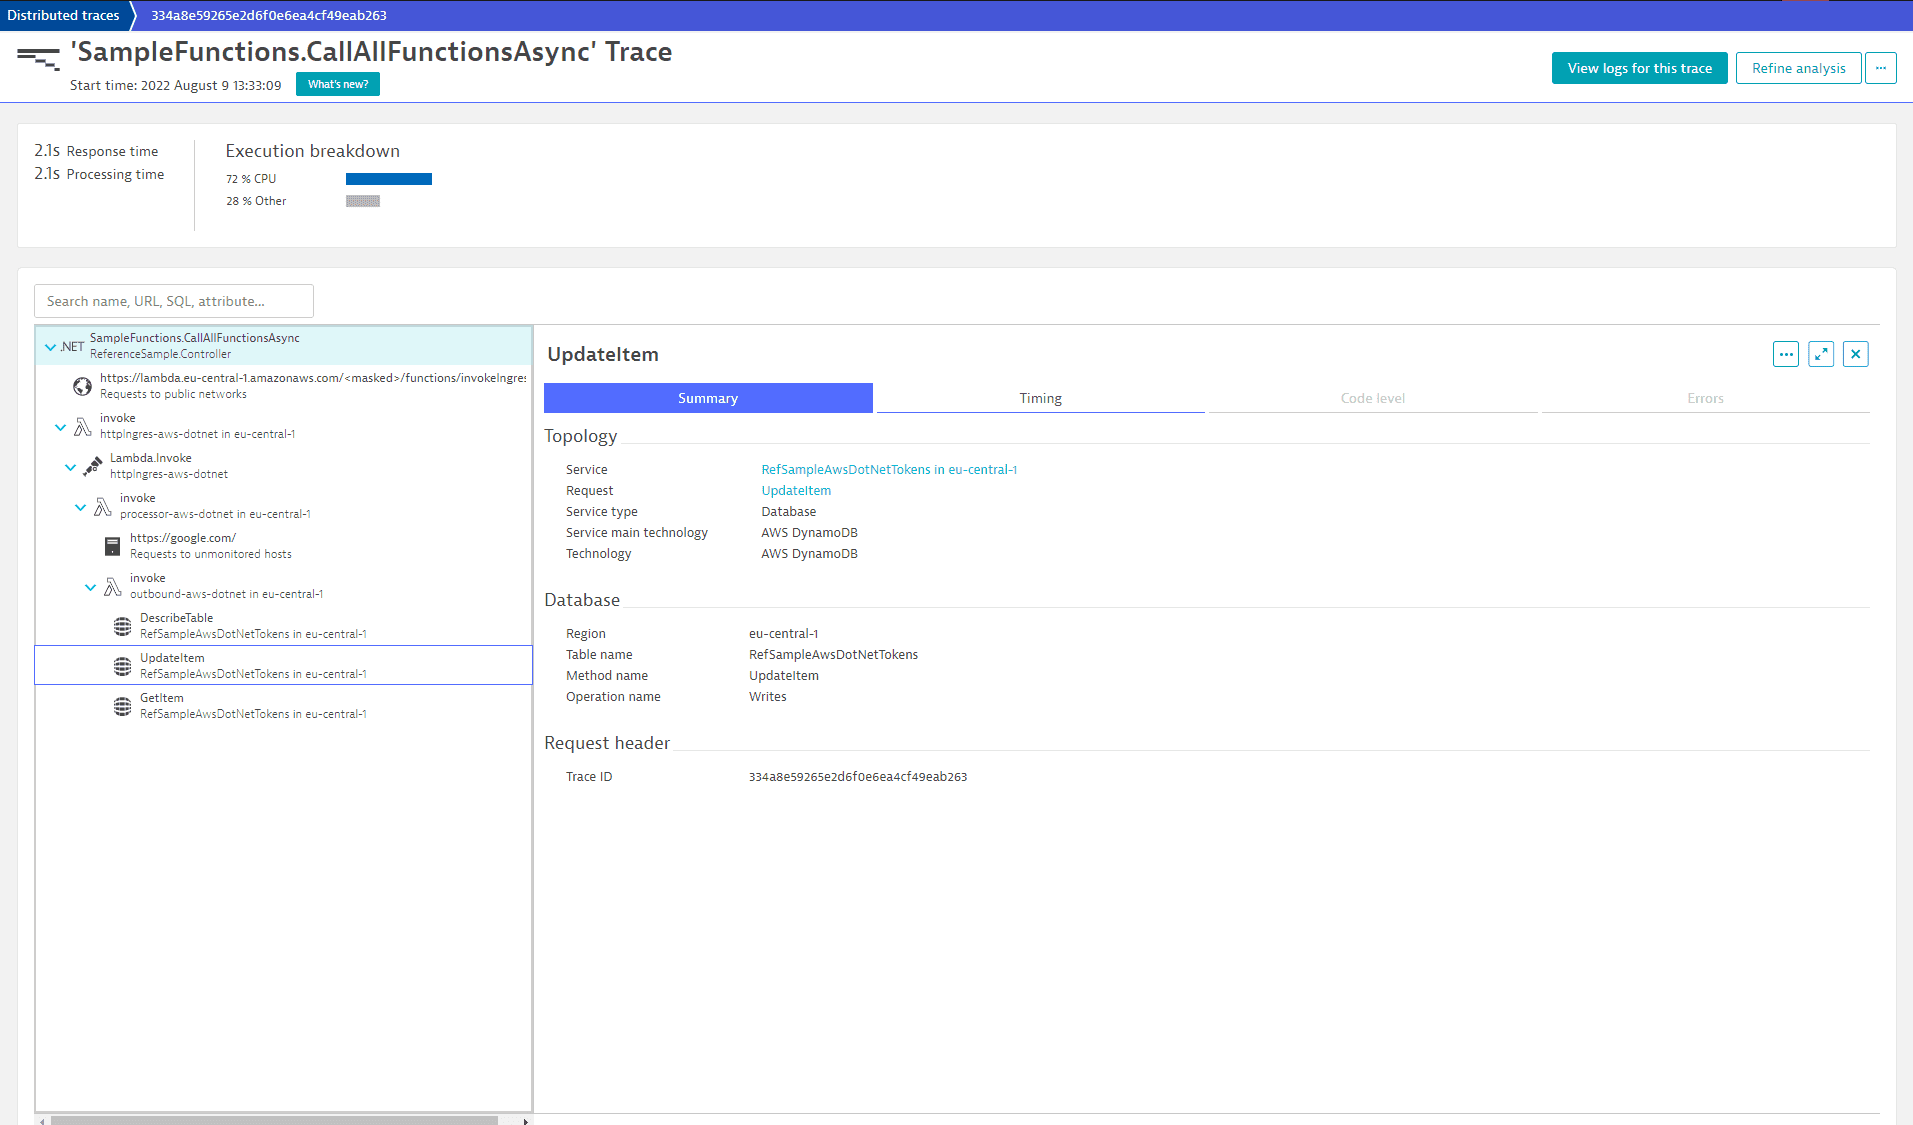
In the following example, the DynamoDB operations DescribeTable, UpdateItem, and GetItem are represented as separate span child nodes with a common parent outbound-aws-dotnet in eu-central-1 (Lambda function performing DynamoDB operations):
Tracing of outgoing SQS/SNS messages
To trace outgoing SQS/SNS messages, set up AWS SDK instrumentation. No additional code is required.
Tracing of incoming SQS/SNS messages
To trace incoming SQS/SNS messages,
- Set up AWS SDK instrumentation.
- Wrap the function handler into one of the tracing methods of the
AWSLambdaWrapperclass:
using Amazon.Lambda.Core;using Amazon.Lambda.SQSEvents;using Dynatrace.OpenTelemetry;using OpenTelemetry;using OpenTelemetry.Instrumentation.AWSLambda;using OpenTelemetry.Trace;using System.Threading.Tasks;namespace Examples.AwsFunctionApp{public class Function{private static readonly TracerProvider TracerProvider;static Function(){// See "Set up tracing for AWS SDK calls" section above.}public Task Handler(SQSEvent sqsEvent, ILambdaContext context) =>AWSLambdaWrapper.TraceAsync(tracerProvider, HandlerInternal, sqsEvent, context);private Task HandlerInternal(SQSEvent sqsEvent, ILambdaContext context){// This is just an example of async function handler and it should be replaced by actual code.return Task.CompletedTask;}}}
Special considerations for HttpClient instrumentation
Because with AWS Lambda the function execution environment might be suspended at any time after the function handler execution, the span export might be interrupted or delayed (for example, in some cases, the span might not be exported at all) and outgoing HTTP requests will typically appear only with the next function invocation.
However, outgoing HTTP request activities related to AWS Runtime API might be captured by OpenTelemetry HttpClient instrumentation in the current function invocation, even if unexpected. To avoid unexpected outgoing HTTP requests in the current function invocation, we recommend configuring the following filter when initializing the HttpClient instrumentation.
var tracerProvider = Sdk.CreateTracerProviderBuilder()// Initialization code similar to previous examples....AddHttpClientInstrumentation(op =>{op.FilterHttpRequestMessage = req => Activity.Current?.Parent?.IsAllDataRequested ?? false;}).Build();
Support of .NET Lambda functions with container images
Starting from .NET 6, Lambda functions can be built and deployed as container images. Initialization and tracing for Managed .NET runtime apply to container image functions without any changes.