Dynatrace for z/OS
With Dynatrace, you can get complete transactional insights into your workloads from the mobile frontend down to mainframe programs and everything in between so that you can troubleshoot anomalies on the code level. Furthermore, Dynatrace can accompany you in your hybrid cloud journey with end-to-end observability from the mainframe to the cloud.
Learn how Dynatrace addresses the most typical mainframe challenges:
The AI-powered fault domain isolation pinpoints the root-cause of problems and assesses their user impact so that you can prioritize mitigation strategies and reduce the mean-time to repair.
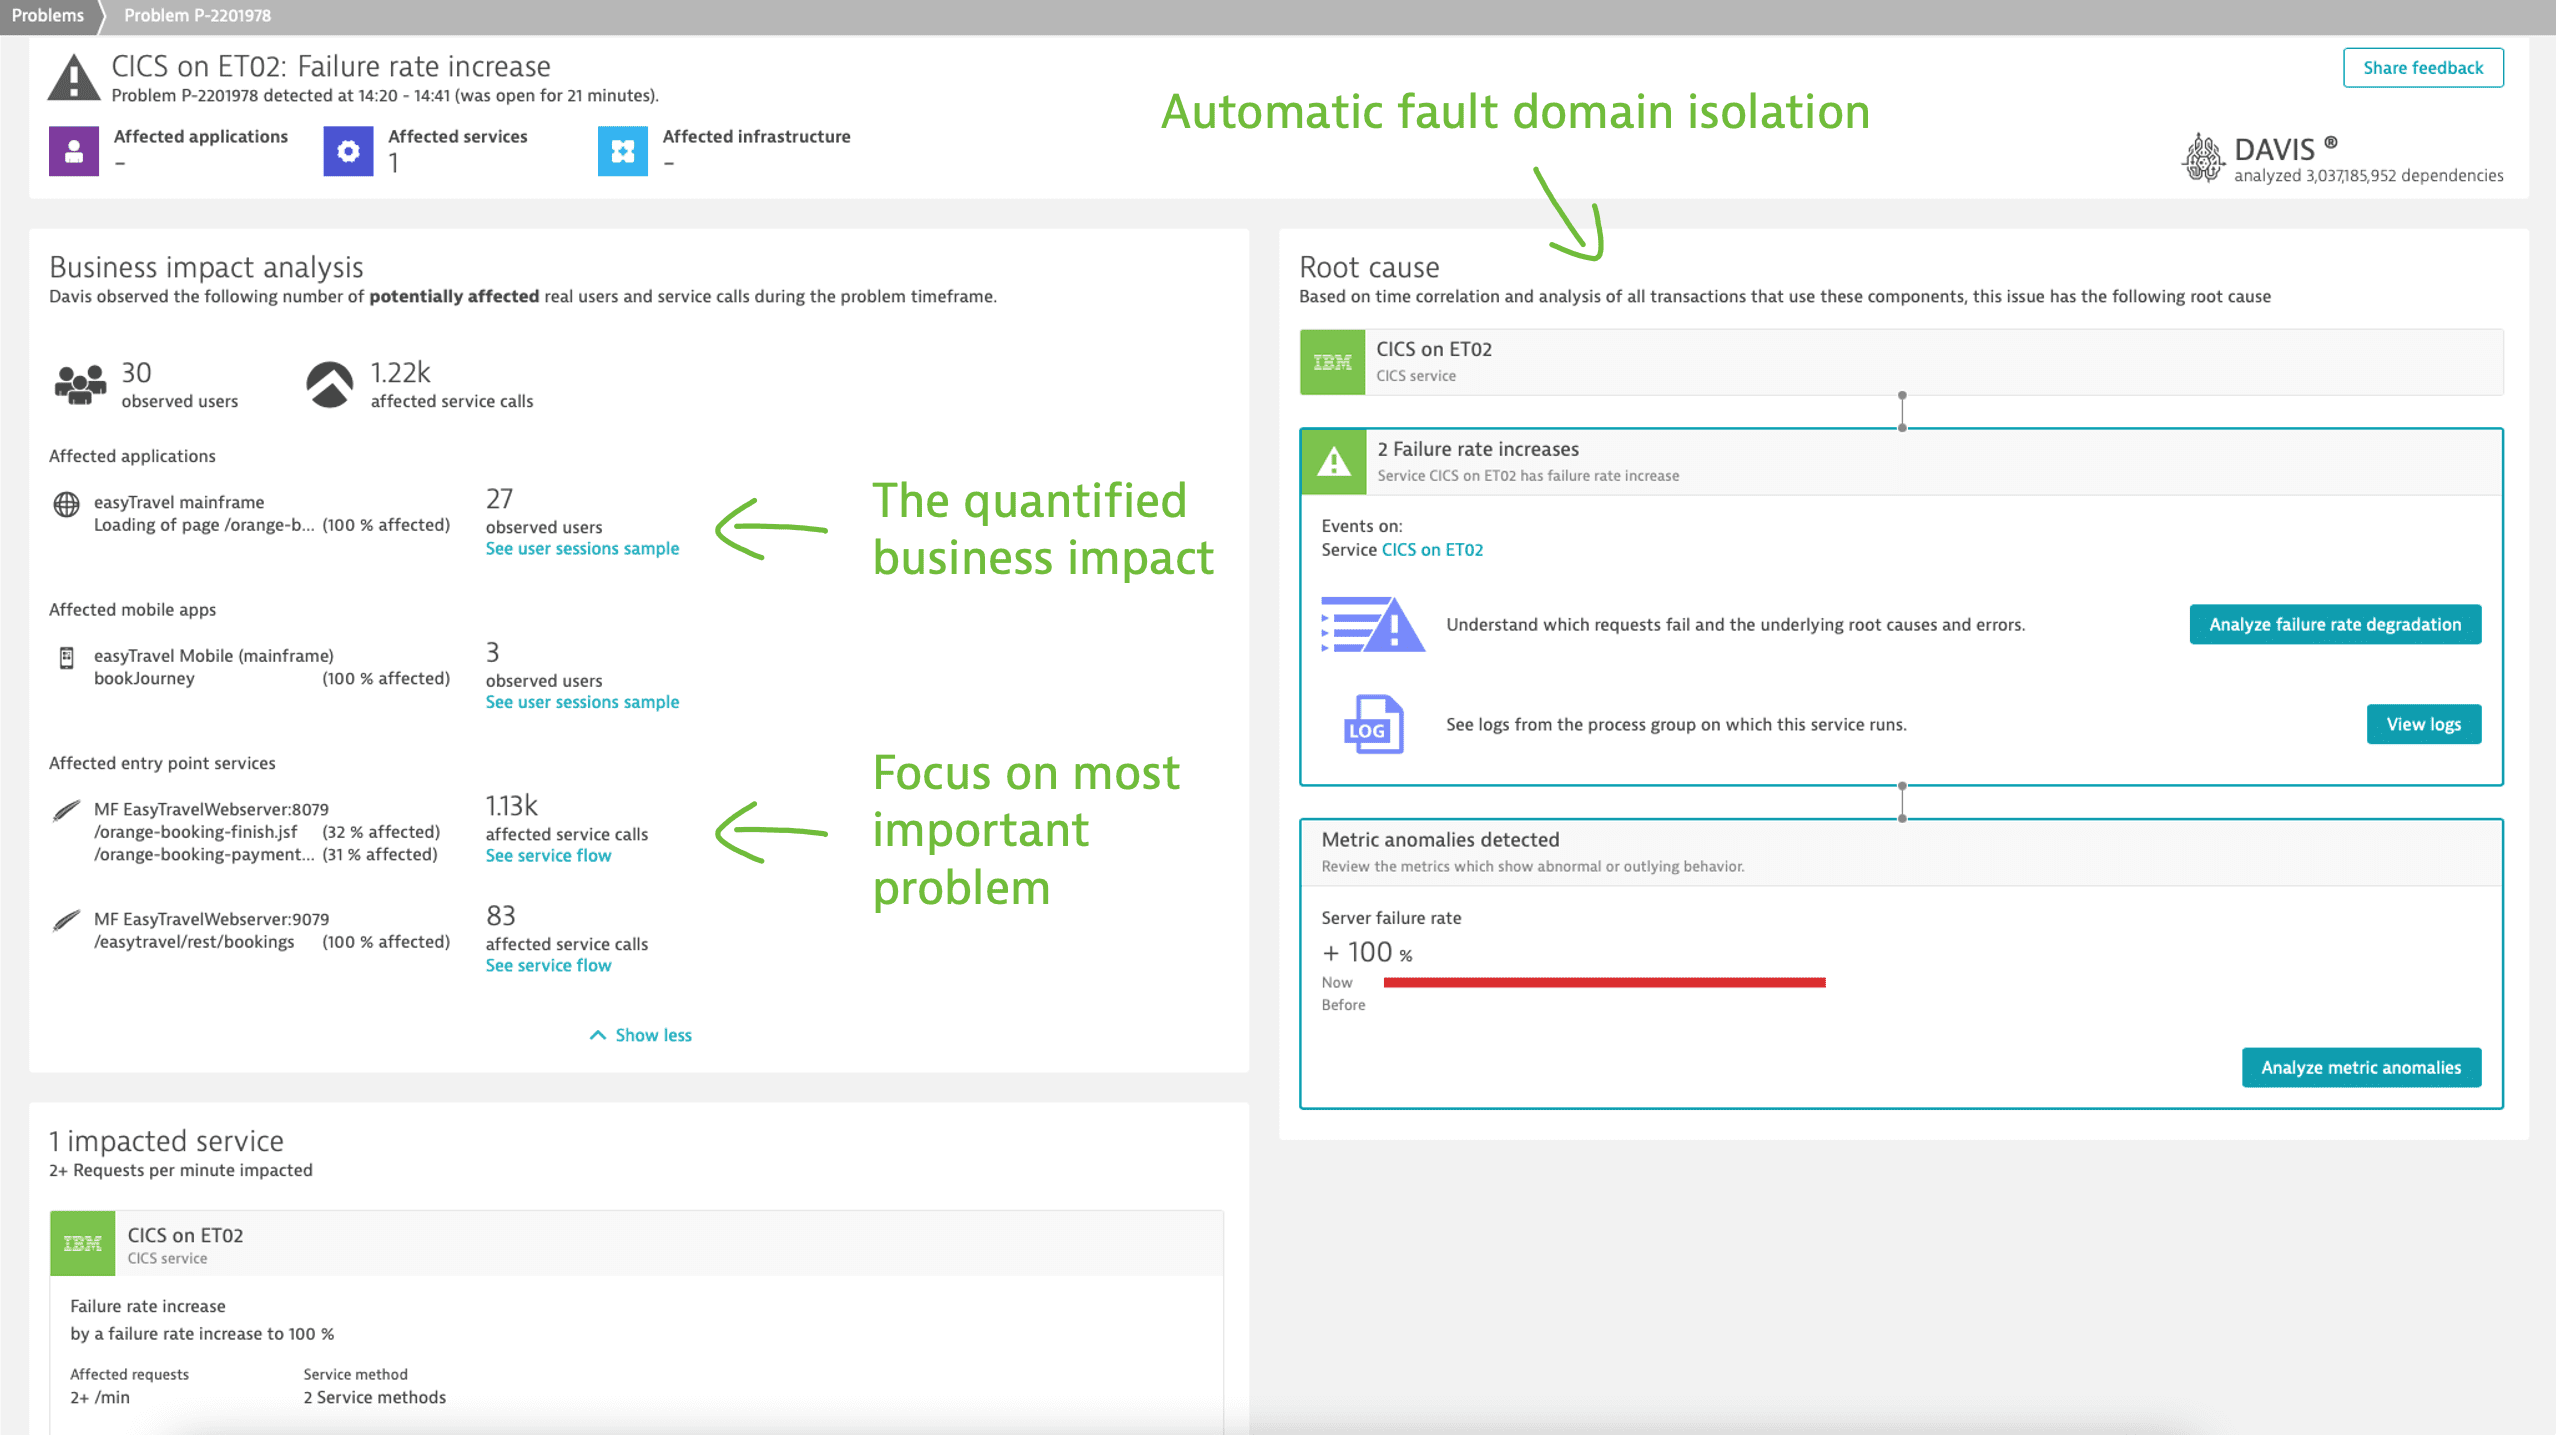
All monitored LPARs, regions, and applications are contributing to this fault domain isolation.
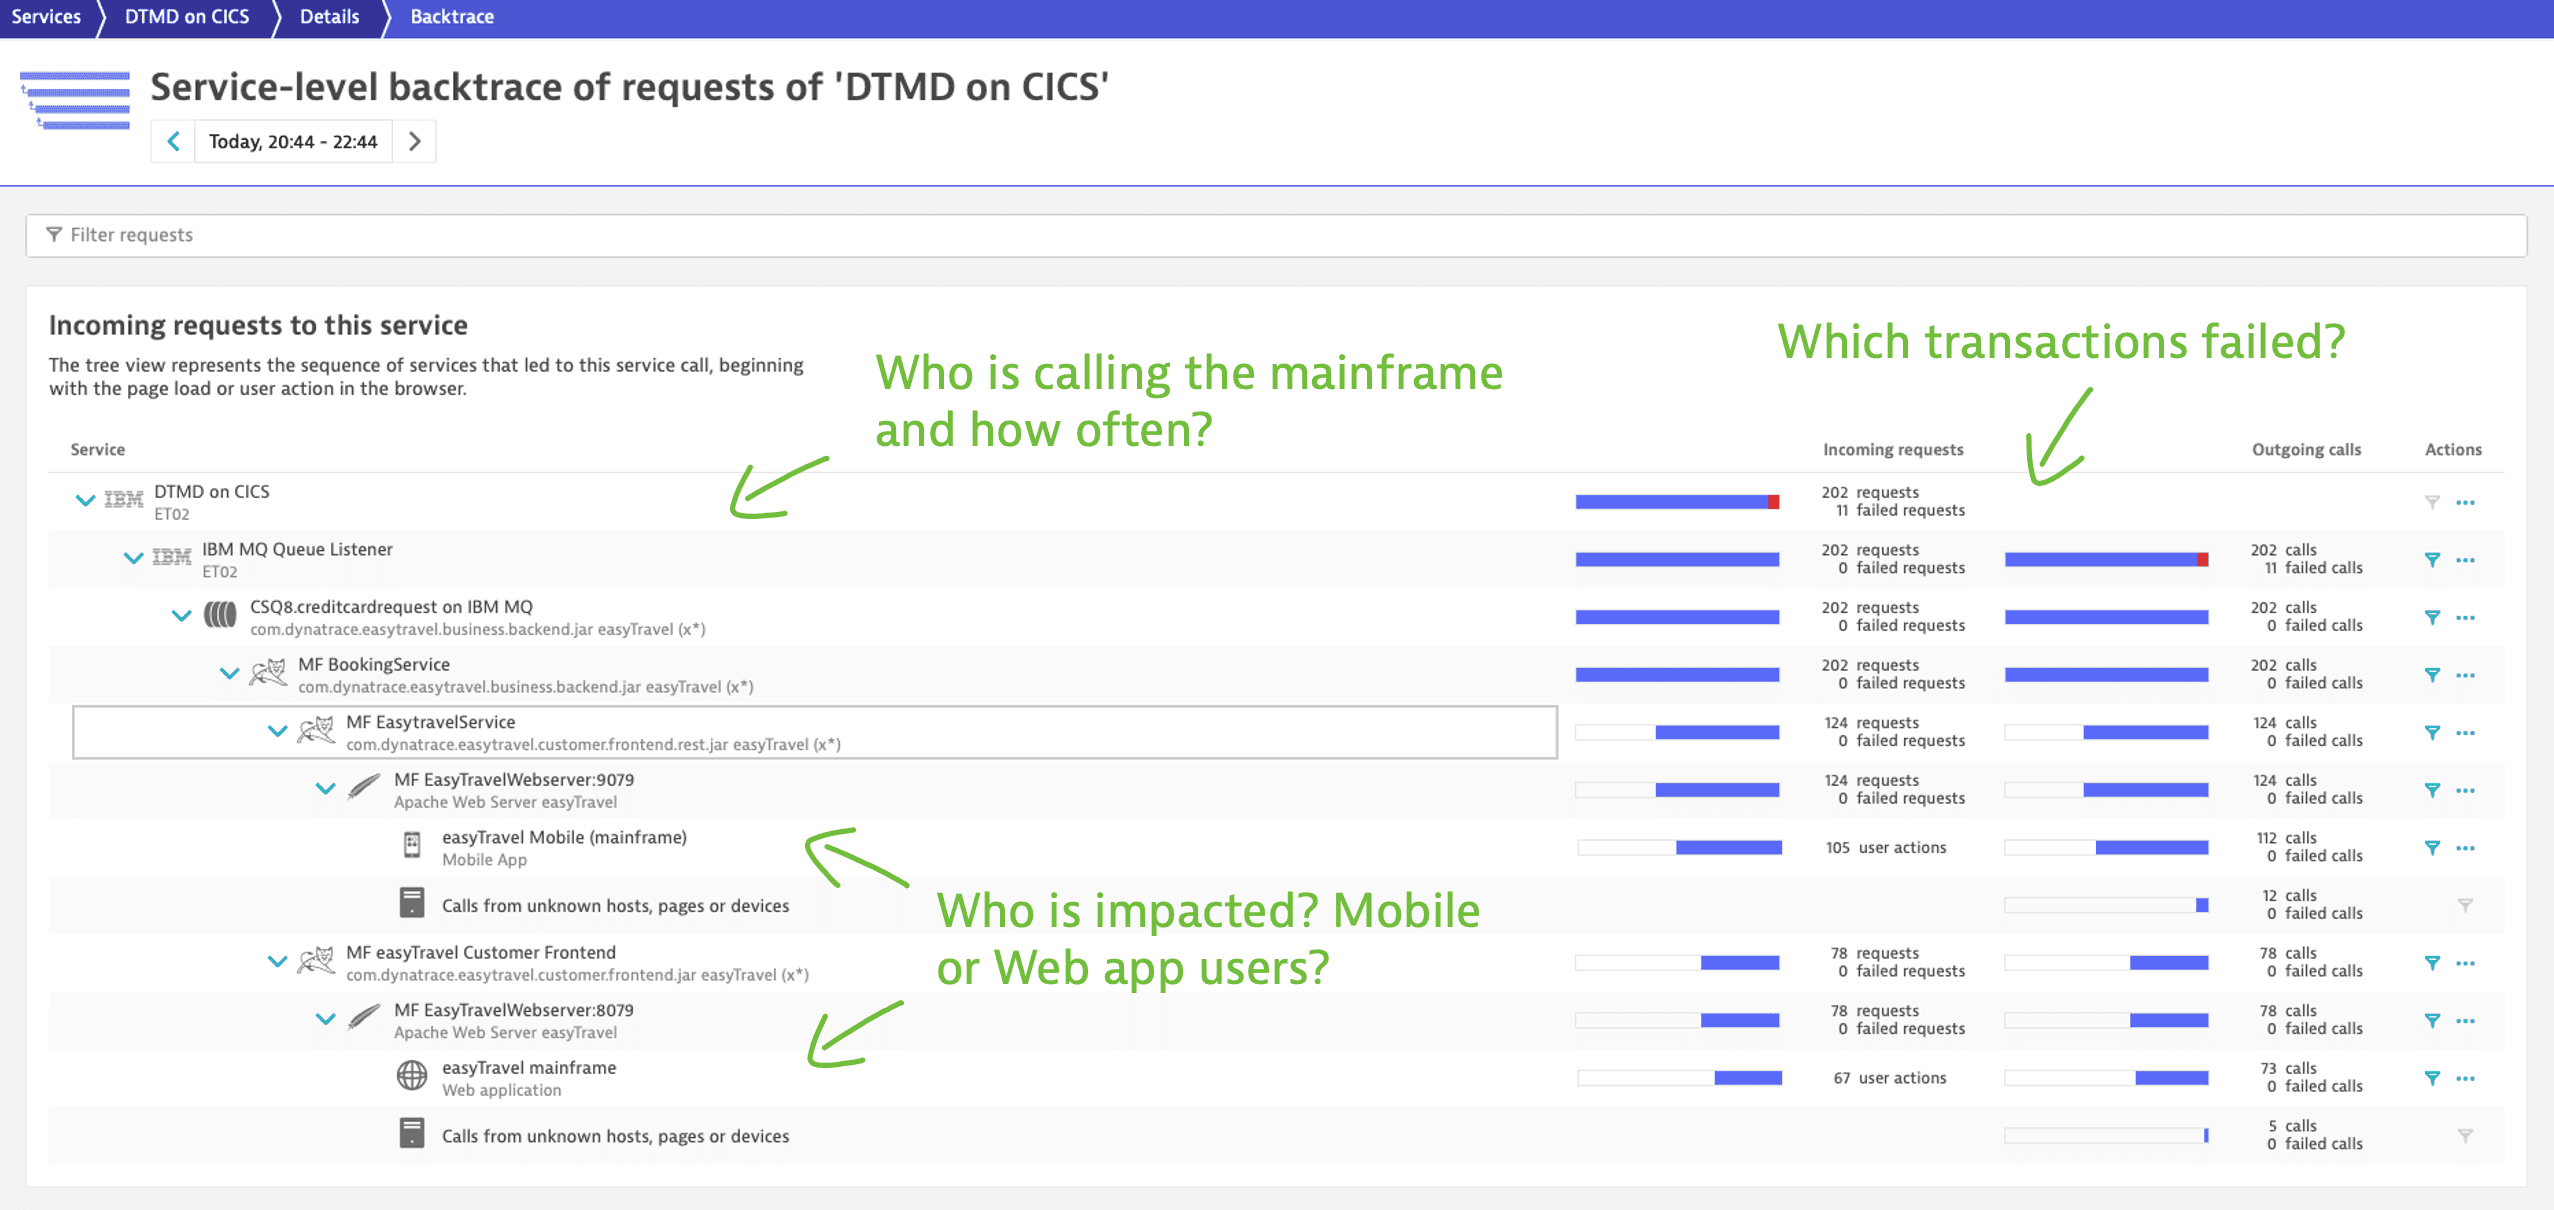
Backtrace transactions using the Service backtrace to understand your mainframe workloads and benefit from potential IBM discounts (see for example the IBM mobile and public cloud workload discounts to lower your monthly peak rolling 4-hour average MSU value).
The Service backtrace below shows how a CICS transaction interactions with both a mobile application and a web application. You can clearly see how often these applications call the CICS transaction, and also which of their requests failed.
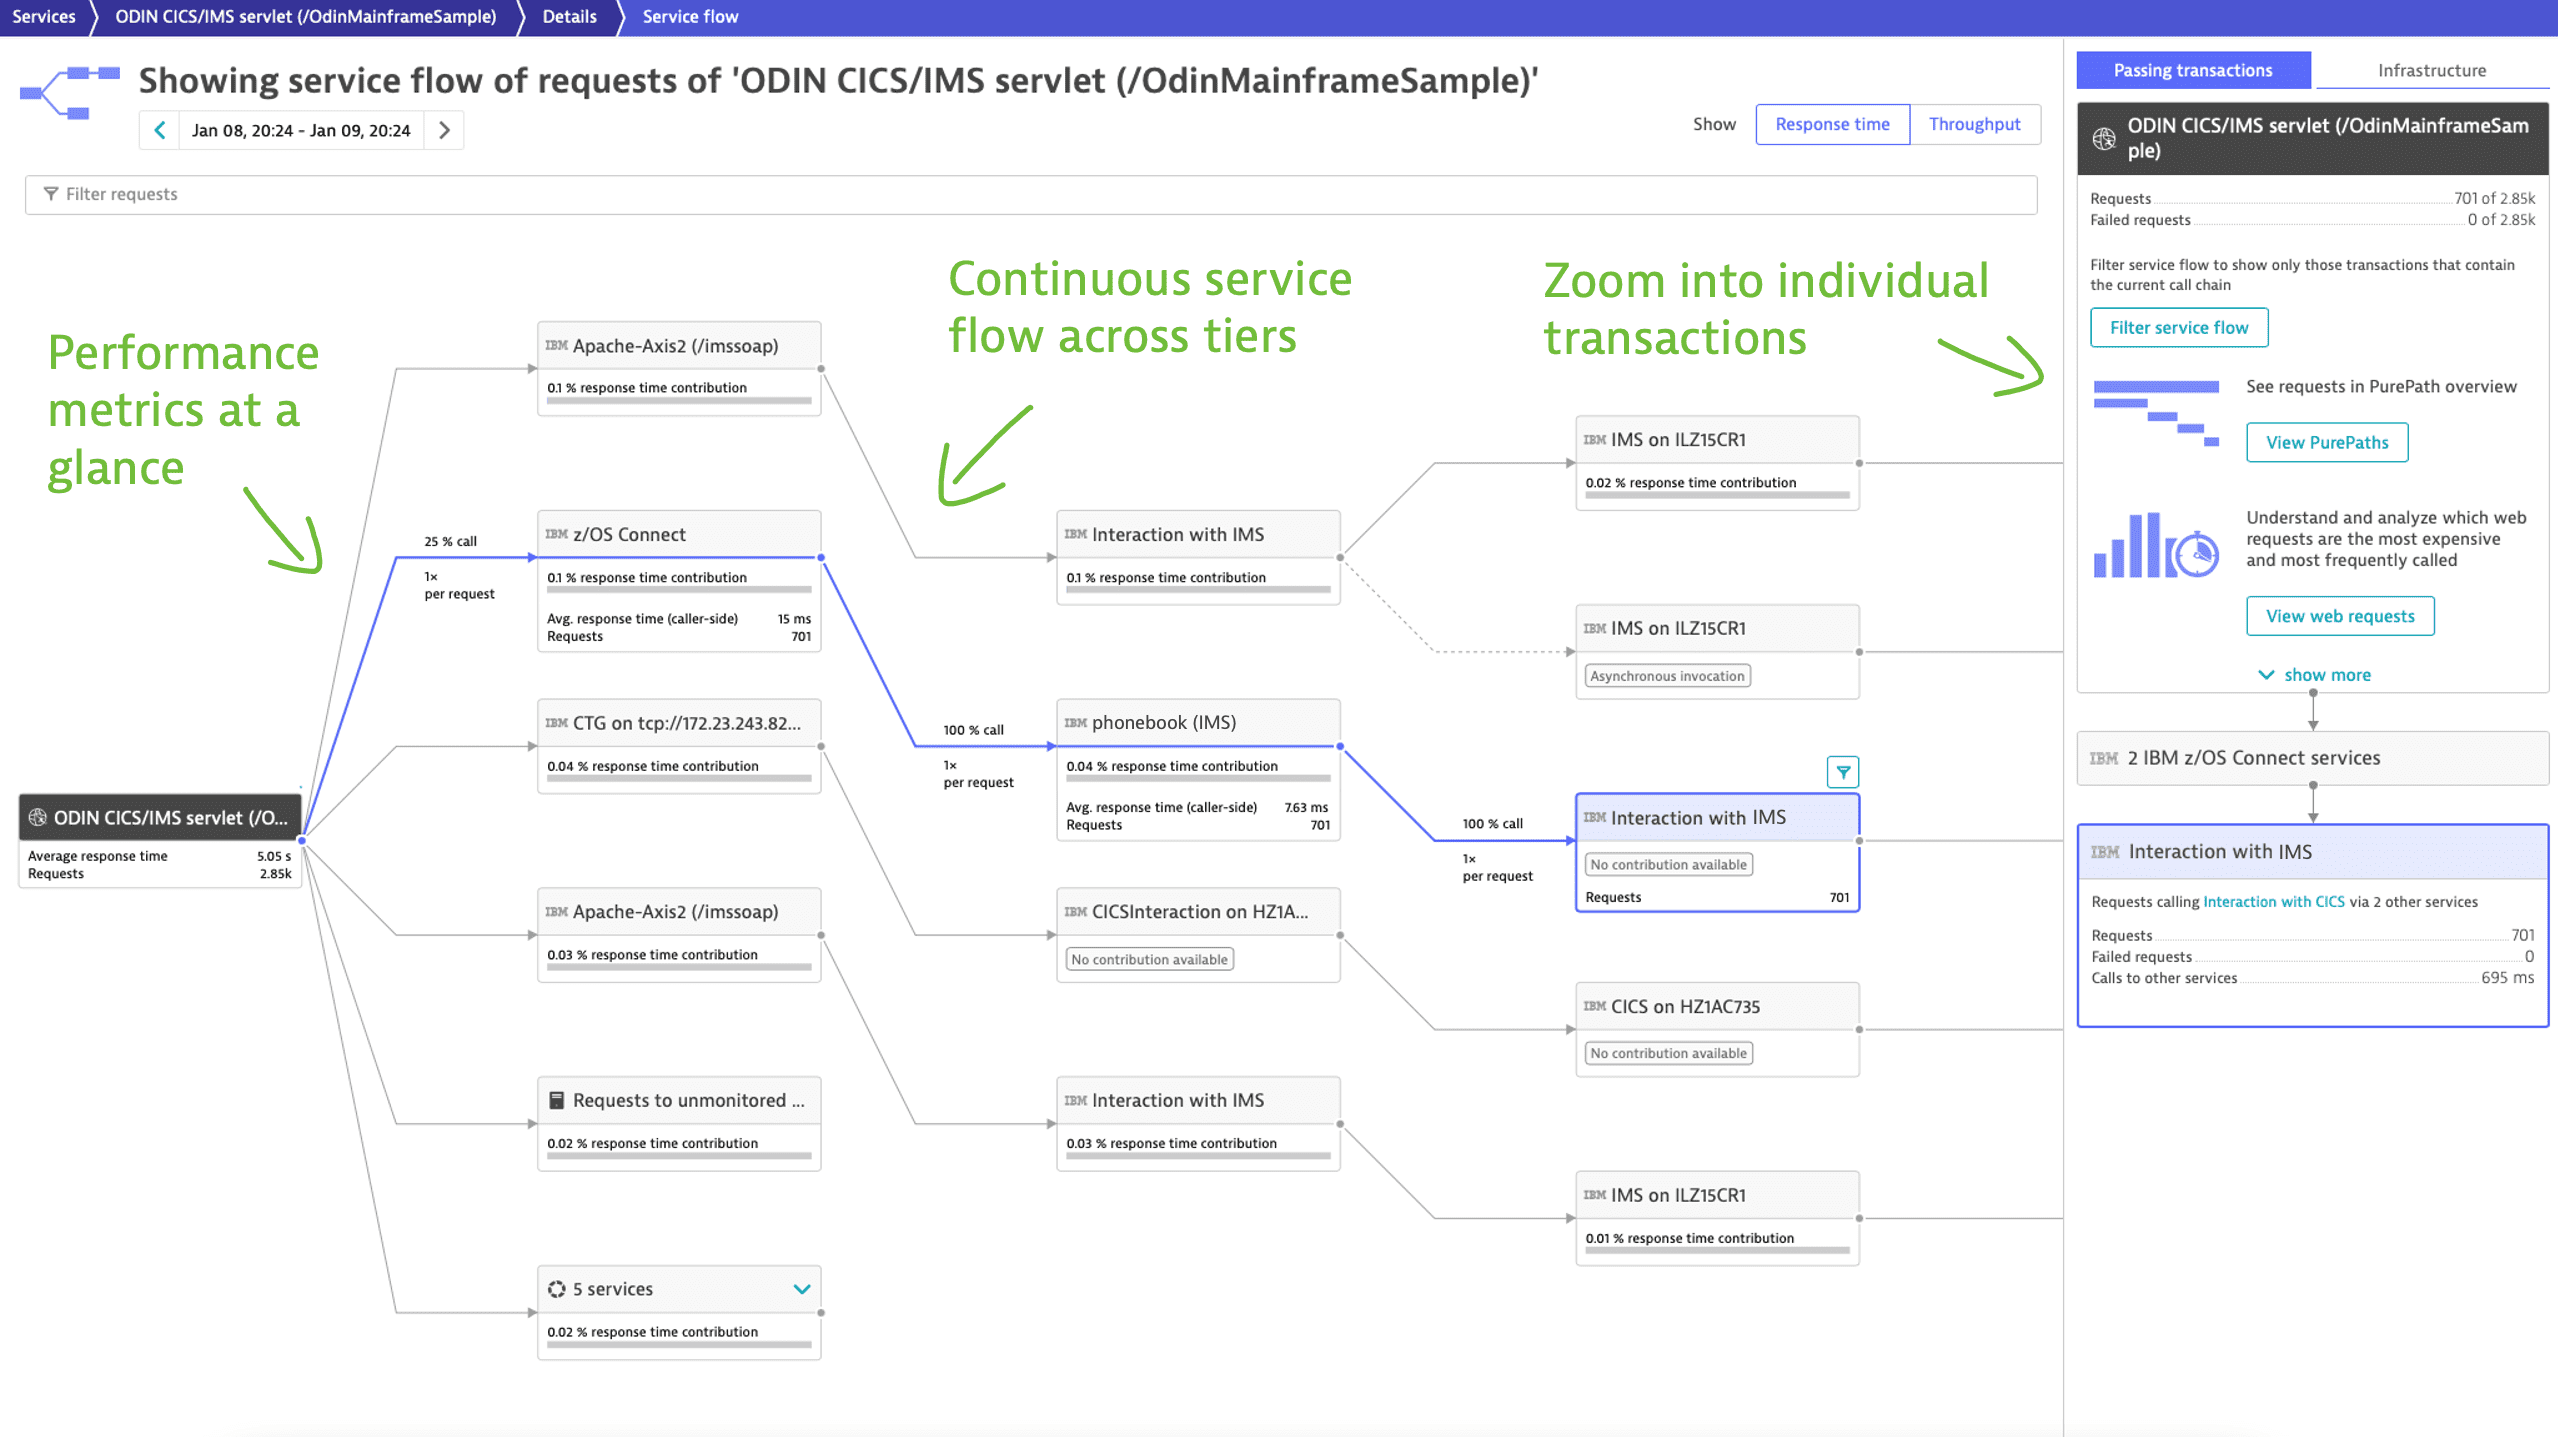
Analyze the performance of your transactions using the Service flow to verify if they fulfill the defined SLOs with service-level metrics. The request count for example can indicate when a transaction is called too often from an open-system, which could result in additional costs.
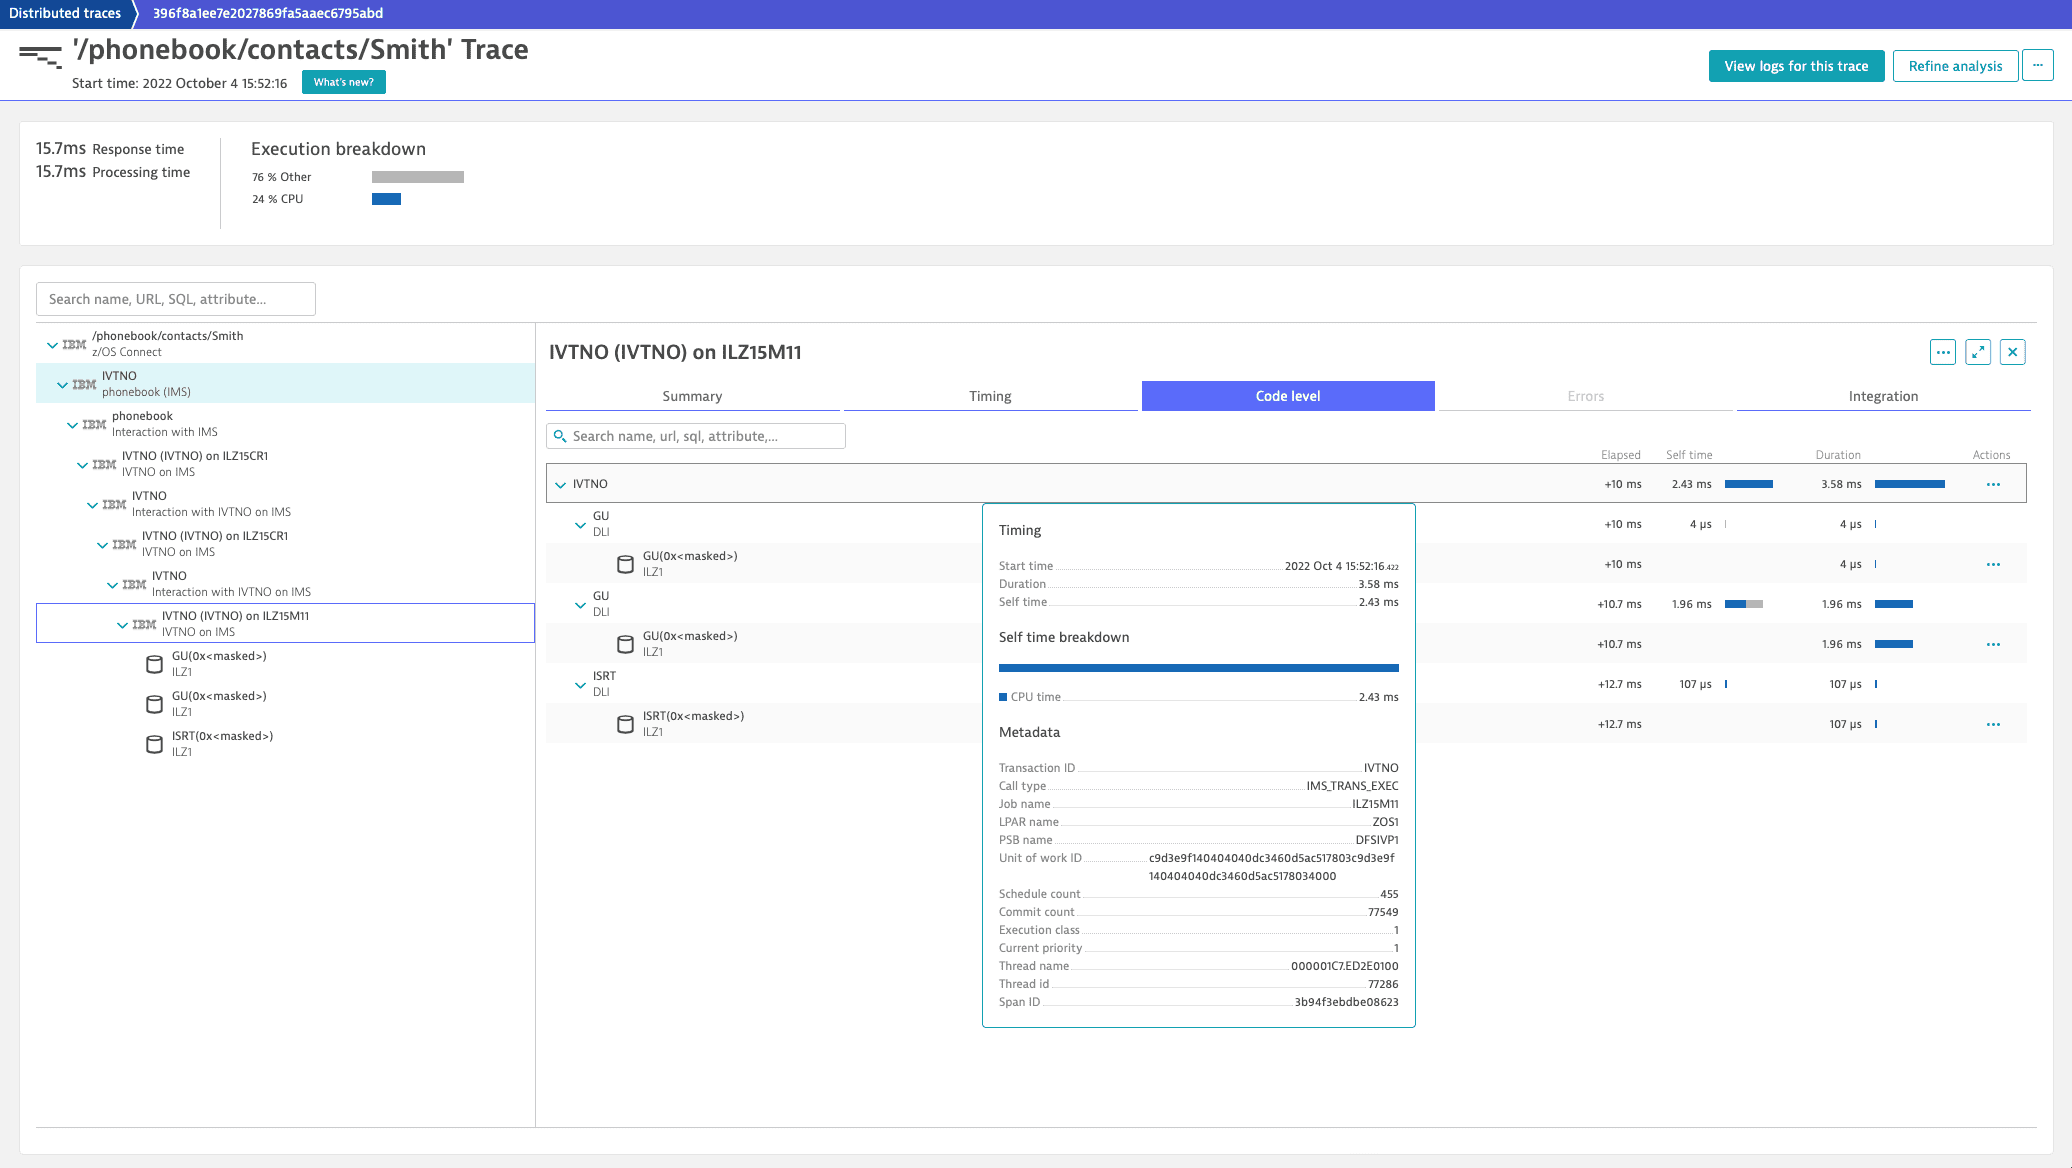
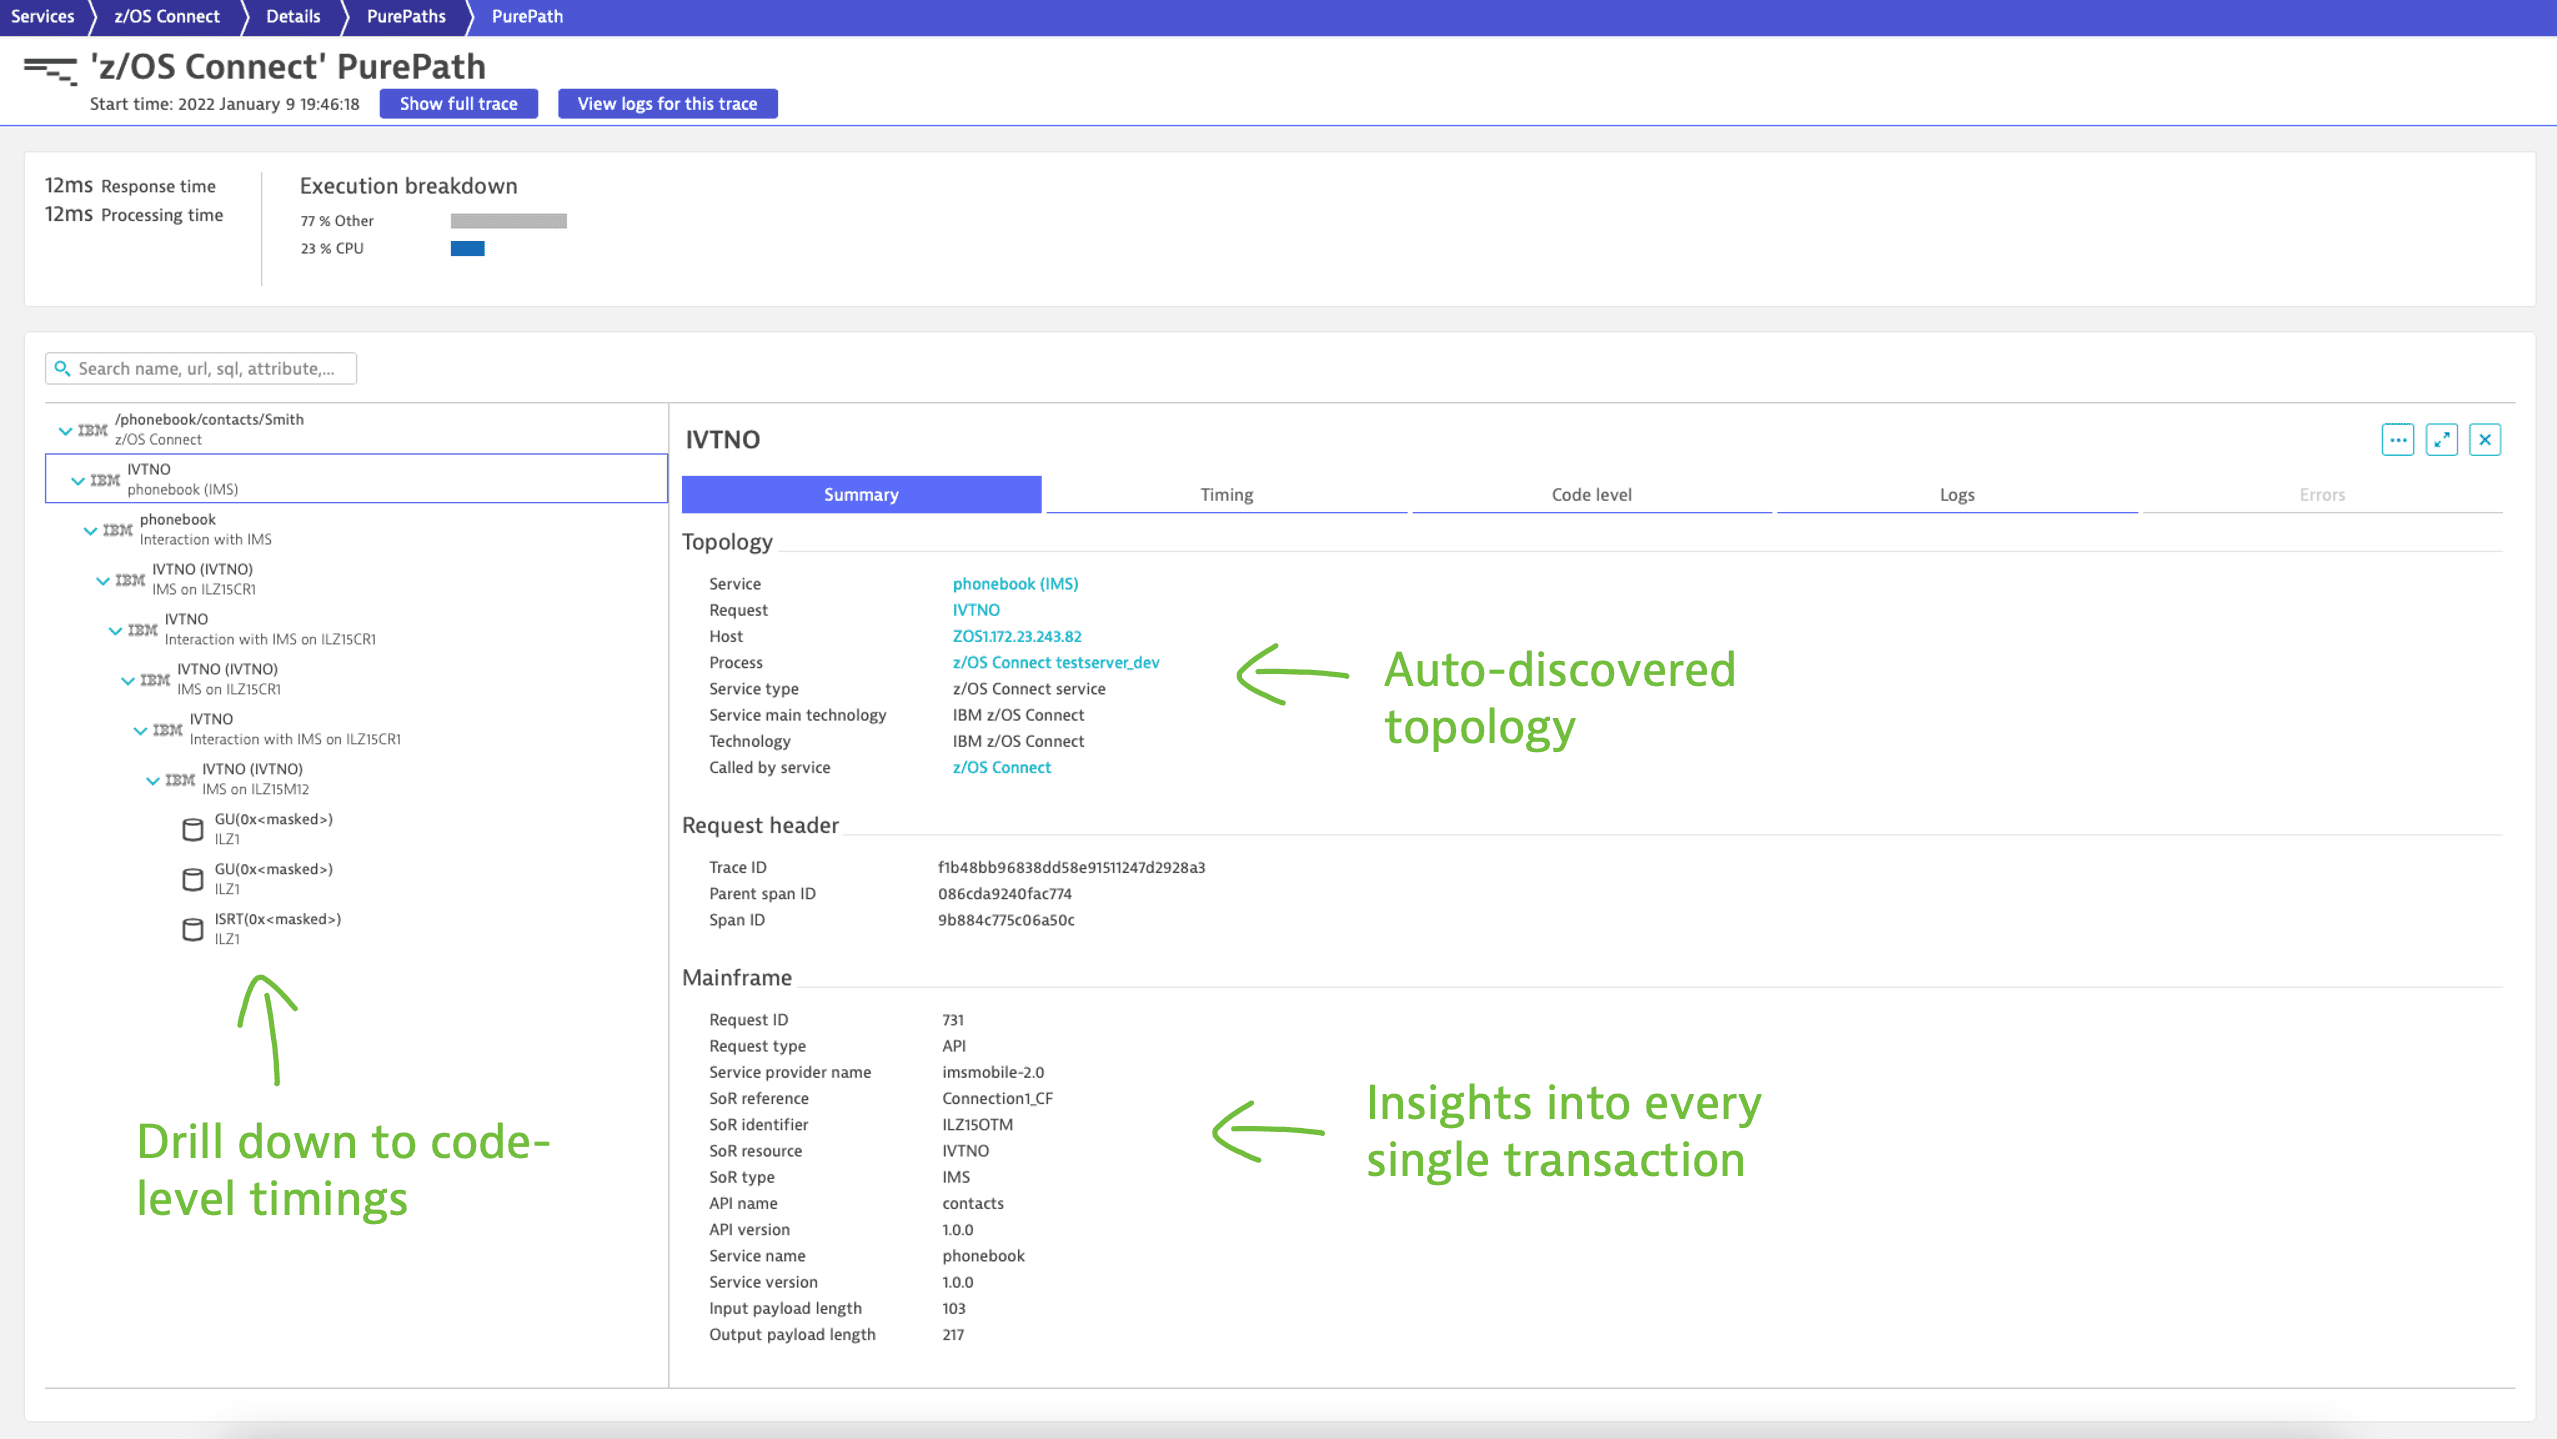
Use the PurePath distributed traces code-level insights to optimize your programs.
Use Dynatrace to ensure business continuity for traditional environments by monitoring middleware technologies like enterprise service buses or message queues. While transforming your mainframe programs to make them accessible for cloud functions with z/OS Connect EE, monitored by Dynatrace.
See the end-to-end trace from z/OS Connect EE down to an IMS DL/I database below.
Set up monitoring
Dynatrace provides code modules for CICS, IMS, and z/OS Java technologies so that you can achieve seamless observability with trace and metric insights. To learn more about the supported technologies, see Mainframe technology support.
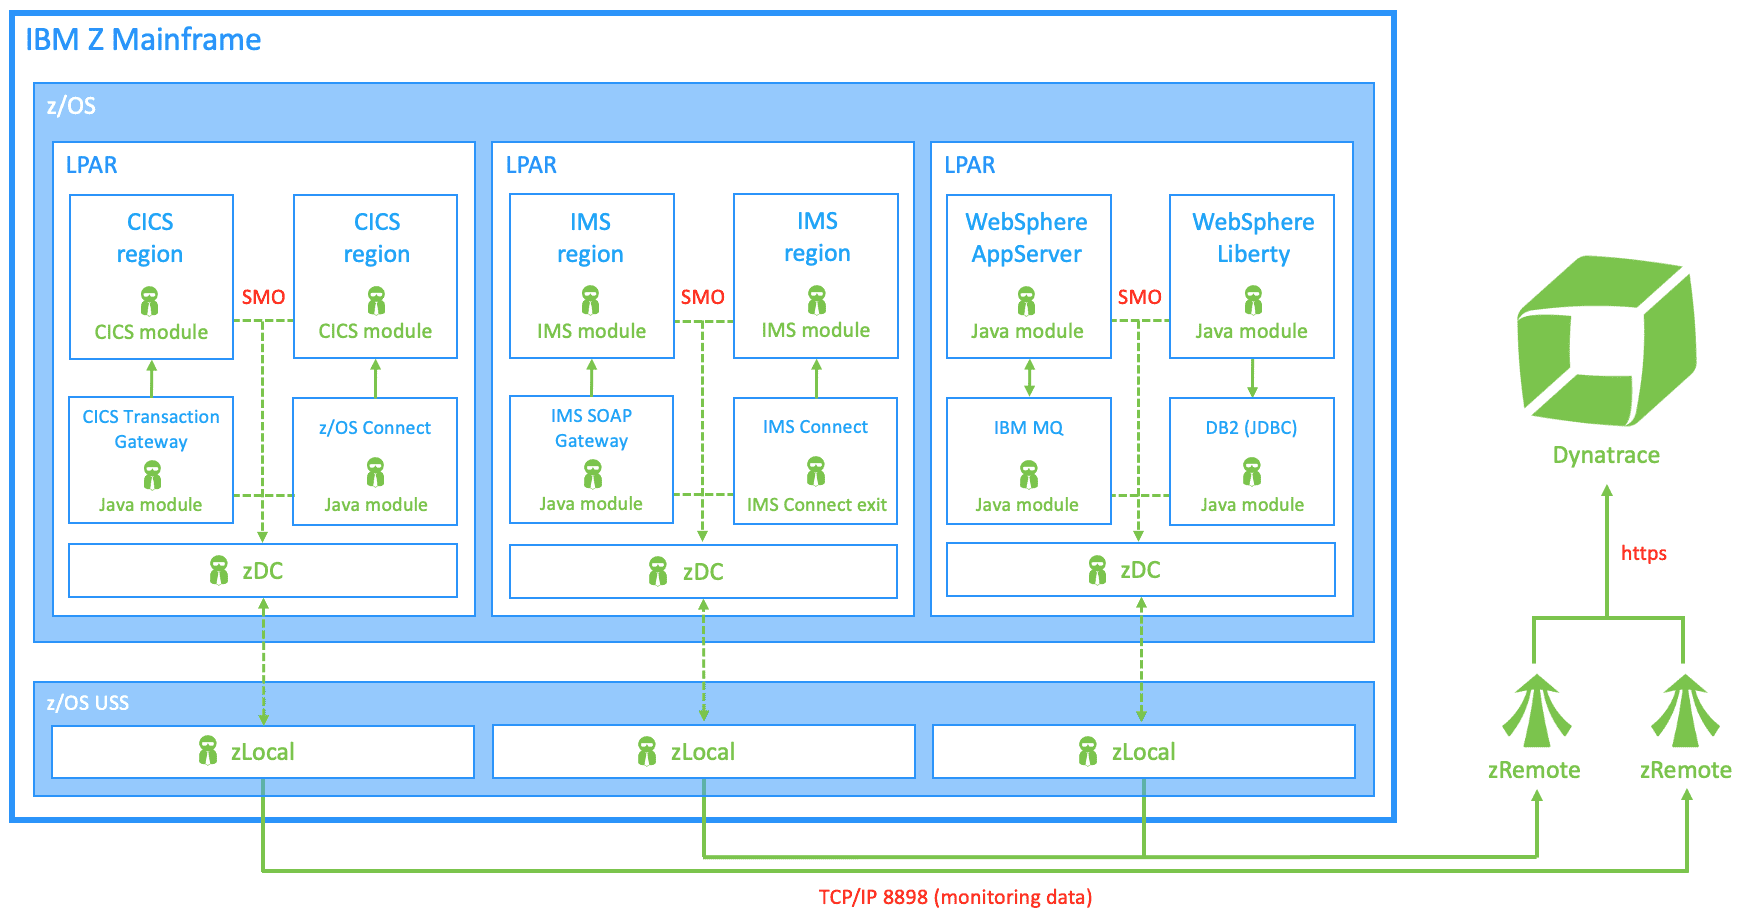
The CICS, IMS, and z/OS Java modules interact with the Dynatrace z/OS Data Collection (zDC) subsystem via a shared memory object (SMO) within an LPAR. The zDC subsystem manages this SMO, to which the modules write their monitoring data.
The zLocal, hosted in the z/OS Unix System Services (USS) environment, runs as part of the zDC. It manages the TCP/IP connection to the zRemote module, reads monitoring data from SMO, and transfers these data to the zRemote.
The zRemote module processes monitoring data received from the zLocal and routes that data, compressed and encrypted, via its local ActiveGate to Dynatrace. Hence, the zRemote module offloads much of the processing work from the modules incurred in instrumenting subsystems and applications to an open system.
To get started, see z/OS installation overview.
Licensing
Monitoring of the CICS, IMS, and z/OS Java modules are consumed based on million service units (MSUs). Therefore, z/OS monitoring doesn't contribute to the consumption of host units or host unit hours.
For more details about licensing, see Mainframe monitoring on IBM z/OS.
Frequently asked questions
To find the procedure and the people involved people, see z/OS installation overview.
The CICS, IMS, and z/OS modules consume some general-purpose central processor (GCP) time while instrumenting subsystems and applications on IBM Z, but this overhead is typically very low (in the range of 1%-2%, depending on the type of monitored transactions). See the examples below.
| Industry of customer | Country | Code module | Measured in year | Measurement method | CPU time overhead |
|---|---|---|---|---|---|
| Financial (Bank) | Italy | CICS | 2023 | HIS profiling1 | < 1.9 % |
| Financial (Bank) | Spain | CICS | 2020 | HIS profiling1 | < 1.0 % |
| Insurance | Germany | CICS | 2020 | ran their own tests | < 1.0 % |
| Insurance | Germany | IMS | 2020 | HIS profiling1 | < 1.0 % |
| Financial (Bank) | Germany | CICS | 2019 | ran their own tests | < 1.0 % |
| Insurance | Germany | IMS | 2017 | HIS profiling1 | < 1.61 % |
| Insurance | Germany | IMS | 2017 | HIS profiling1 | < 0.33 % |
| Financial (Bank) | Austria | CICS | 2015 | HIS profiling1 | < 2.04 % |
1 Using the Hardware Instrumentation Services from IBM. |
The GCP time overhead numbers are calculated relatively to the address spaces in which the modules are running. When you compare the GCP time overhead relatively to the LPAR, then these numbers are even lower.
For example, 2% GCP time overhead in CICS address spaces represents only 1% GCP time overhead per LPAR if the CICS workloads consume only 50% of the total GCP time on a given LPAR compared to other workloads (such as jobs and system tasks).
No, the CICS and IMS modules can only capture static SQL statements.
Dynatrace uses the following attributes to detect and create WebSphere Application Server process entities:
Server name
Node name
Cell name
Dynatrace groups all process entities belonging to the same WebSphere Application Server cluster name into a process group.
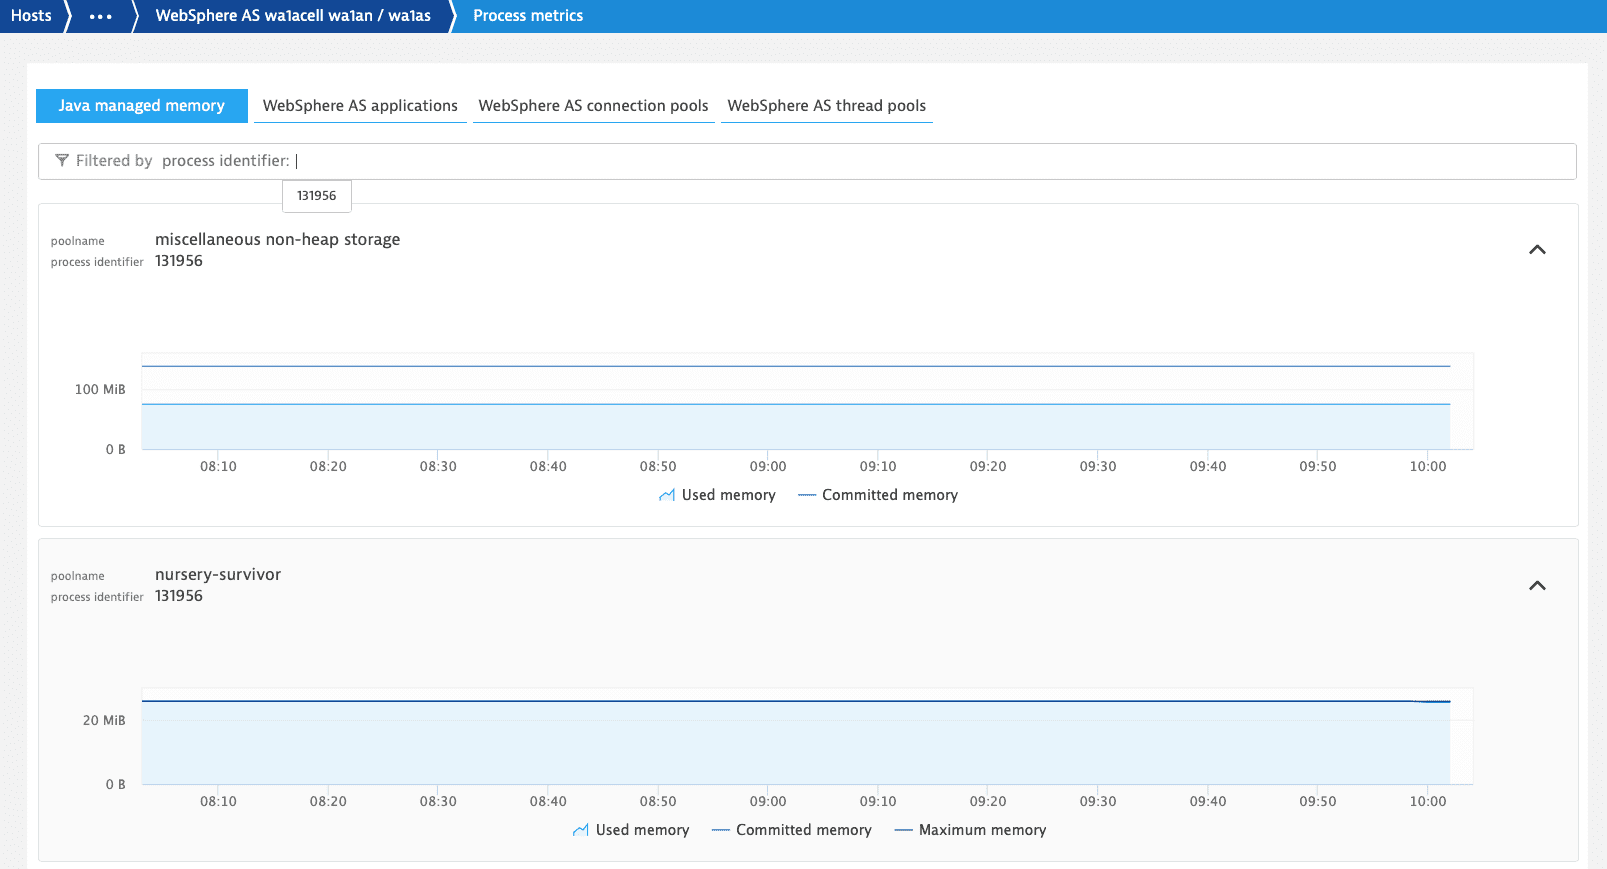
The WebSphere Application Server on z/OS allows you to spin up Servants dynamically depending on the workload.
In Dynatrace, you can use the process identifier on each metric to distinguish between different Servants, as shown in the image below.
However, Servants can't be incorporated into the WebSphere Application Server process group detection because whenever you spin up a new Servant, a new process entity is created, and the current monitoring context is lost.
No, process groups created by the z/OS Java module can't be modified or merged.
As an alternative you can organize your process groups by defining metadata or defining tags based on environmental variables. Both concepts apply to z/OS Java as well.
Note at you can define environment variables only on the process level, not on the host level.
Yes. To learn how to set up a request attribute for any captured span attribute, see Define a request attribute for span attributes.
Yes, you can organize multiple LPARs using host groups. For more information, see Define host groups to organize multiple LPARs.
The CICS module uses hooks to instrument CICS terminal and application owning regions, creating events of interest.
The IMS module uses the logging facility to instrument IMS control and message processing regions, creating events of interest from parsing binary logs.
Both modules use hooks to instrument IBM MQ, Db2, and DL/I.
No byte code instrumentation is used by the CICS and IMS modules.
Linux on IBM Z and LinuxONE
With Dynatrace, you can get observability for the Linux operating systems on IBM Z and LinuxONE mainframes using OneAgent on Linux. To learn more about the supported technologies on the s390 architecture, see Technology support.
Monitoring of OneAgent on Linux is based on host units consumption.