Root cause analysis
To identify the root cause of problems, Dynatrace doesn't depend solely on time correlation. It uses all the OneAgent-delivered context information—such as topology, transaction, and code-level information—to identify events that share the root cause. Using all available context information, Dynatrace can pinpoint the root cause of problems in your application delivery chain and dramatically reduce the alert spam for single incidences that originate from the same root cause.
Why time correlation alone isn't effective
Time correlation alone is ineffective in identifying the root cause of many performance problems. Consider, for example, a simple time correlation in which a Service A calls a Service B. The first event in this problem evolution sequence is a slowdown on Service B. The next event in the problem evolution sequence is a slowdown on Service A. In this case, time correlation would seem to work pretty well for indicating the root cause of the problem: the slowdown on Service B led sequentially to the slowdown on Service A. This is however a very simplistic problem.
What if the events in the problem evolution sequence are more nuanced and open to interpretation? What if, for example, Service A has a long history of performance problems? With such knowledge, it becomes impossible to say conclusively that the slowdown on Service A was caused by the slowdown on Service B. It may be that Service A is simply experiencing another in a history of performance issues. Such subtleties make time correlation alone ineffective in conclusively pinpointing the root cause of many performance problems.
A context-aware approach for the detection of interdependent events
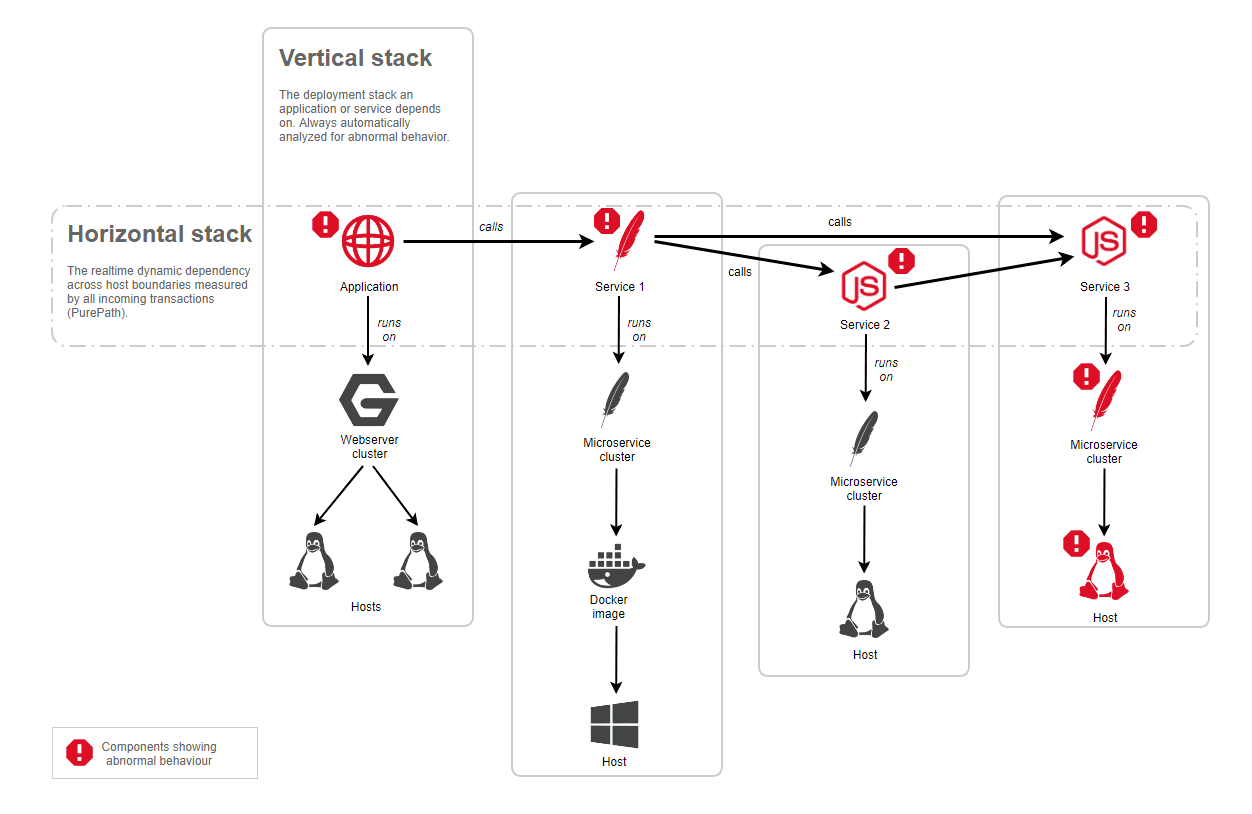
After Davis (the Dynatrace AI causation engine) identifies a problem in one of your application's components, it uses all monitored transactions (distributed traces) to identify interdependencies between the problem and other components that took place around the same time and within a dependent topology. Therefore, all vertical topological dependencies are automatically analyzed as well as the complete horizontal dependency tree.
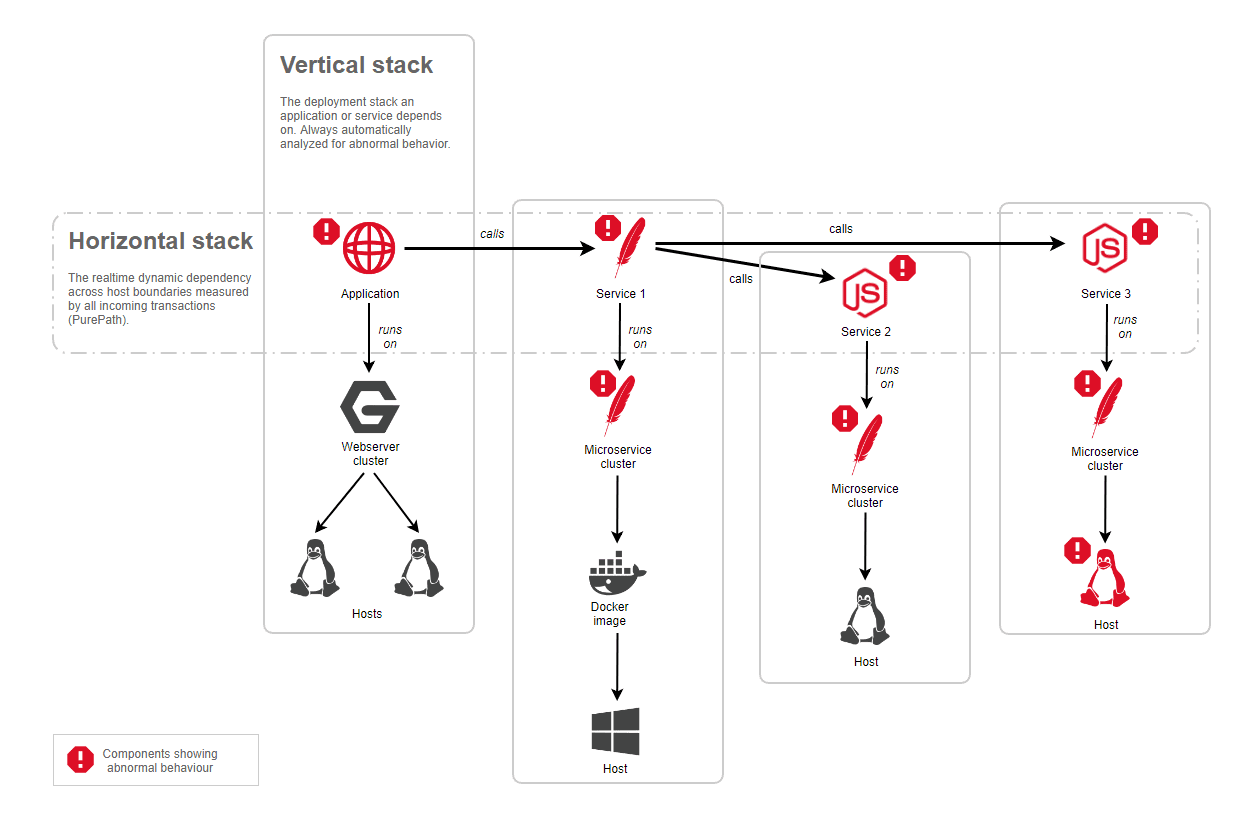
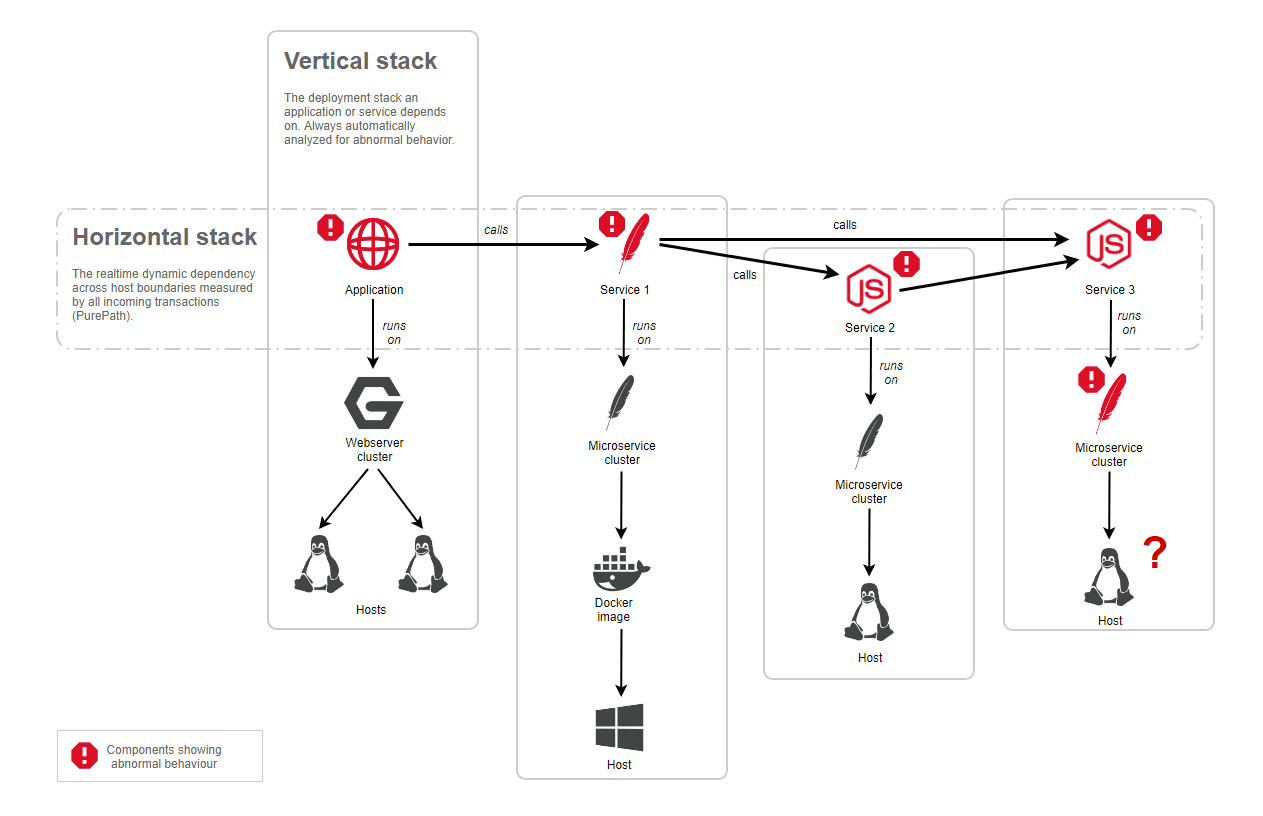
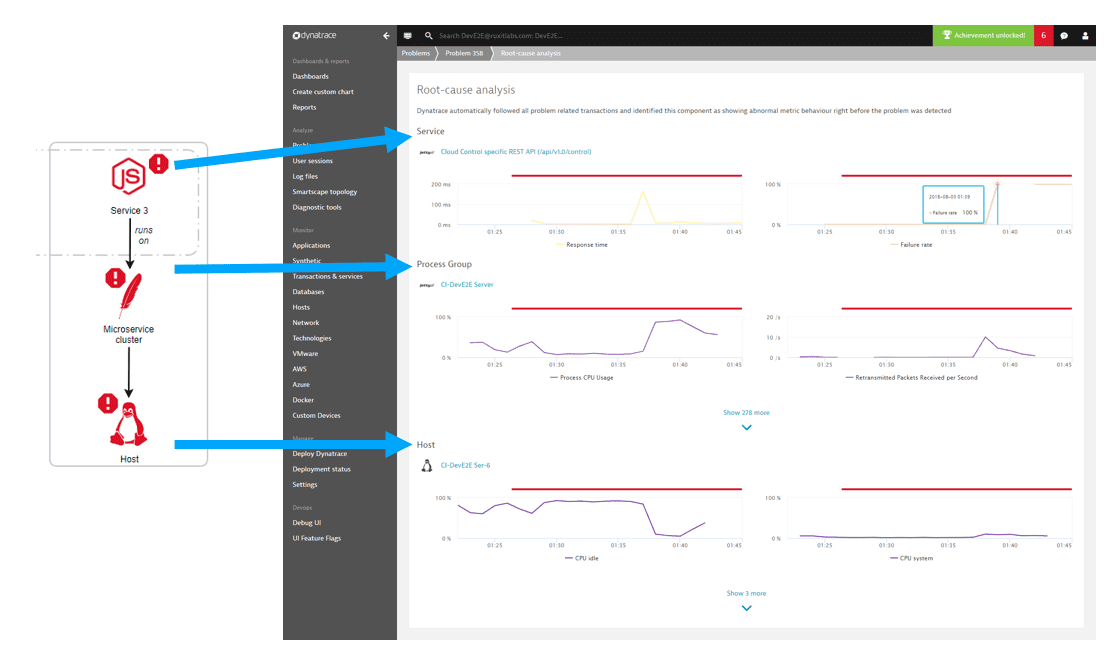
The image below shows how Davis automatically analyzes all the vertical and horizontal topological dependencies for a given problem. In this example, an application exhibits abnormal behavior, but the underlying vertical stack is not showing any incidents. The automatic analysis follows all the transactions that were monitored for that application and detects a dependency on Service 1, where Service 1 also exhibits abnormal behavior. In addition, all dependencies of Service 1 show abnormal behavior and are part of the root cause of the overall problem.
Automatic root-cause detection includes all the relevant vertical stacks as shown in the example and ranks all root-cause contributors to find out which one has the most negative impact. Dynatrace not only detects all the root-cause contributors but also offers drilldowns on a component level to analyze the root cause down to the code level, showing, for instance, failing methods within your service code or high GC activity on underlying Java processes.
Problems are seldom one-time events; they usually appear in regular patterns and are often shown to be symptoms of larger issues within your environment. If any other entities that depend on the same components also experienced problems around the same time, then those entities will also be part of the problem's root-cause analysis.
When Davis detects an interdependency between a service problem and other monitored events, it shows you the details of this interdependency and the related root-cause analysis.
Drill down to code-level details of a detected root-cause component
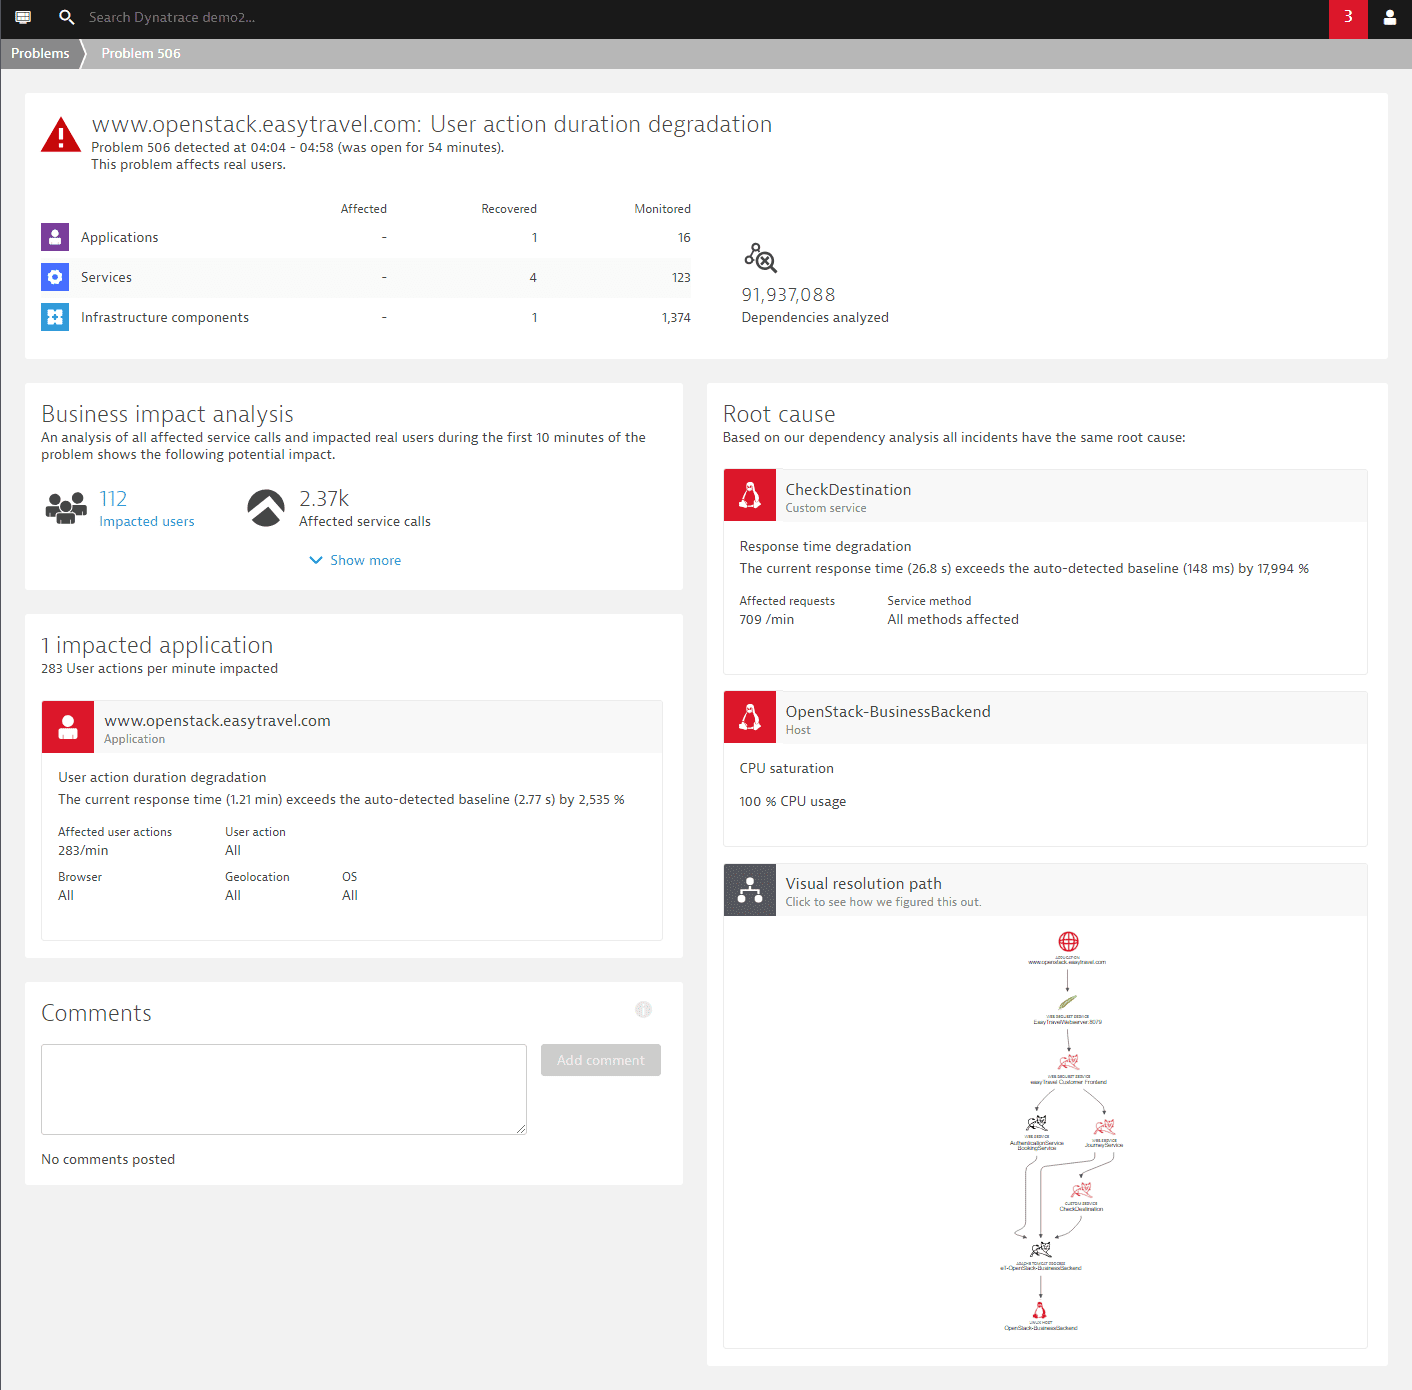
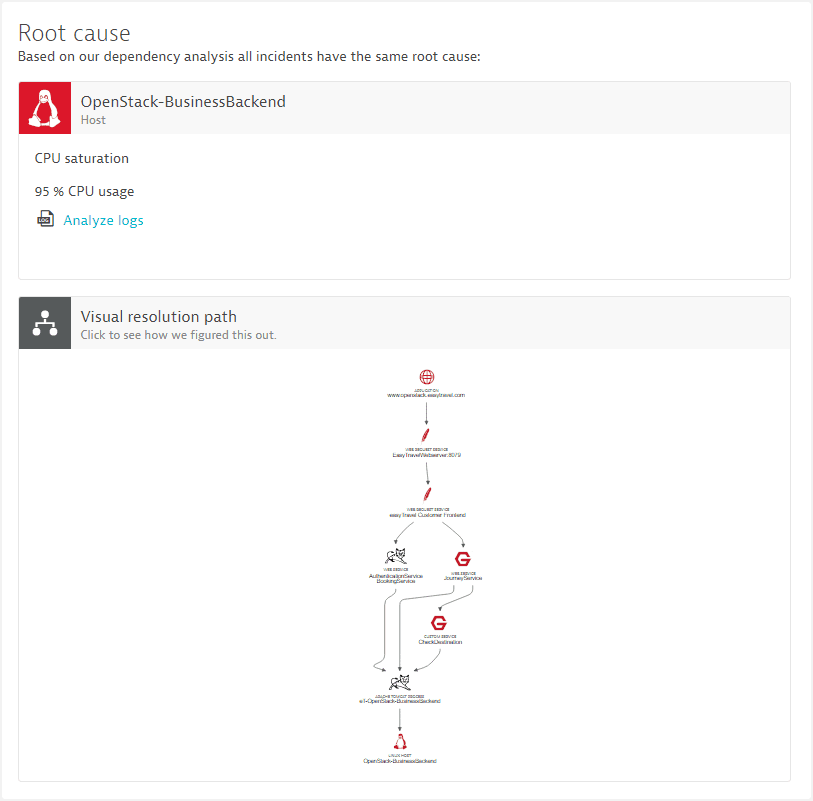
On the problem overview page, you can click the component tile appearing within the Root cause section to navigate to the components infographics page. It shows you the relevant service, host, or process overview page in the context of the actual problem you're analyzing.
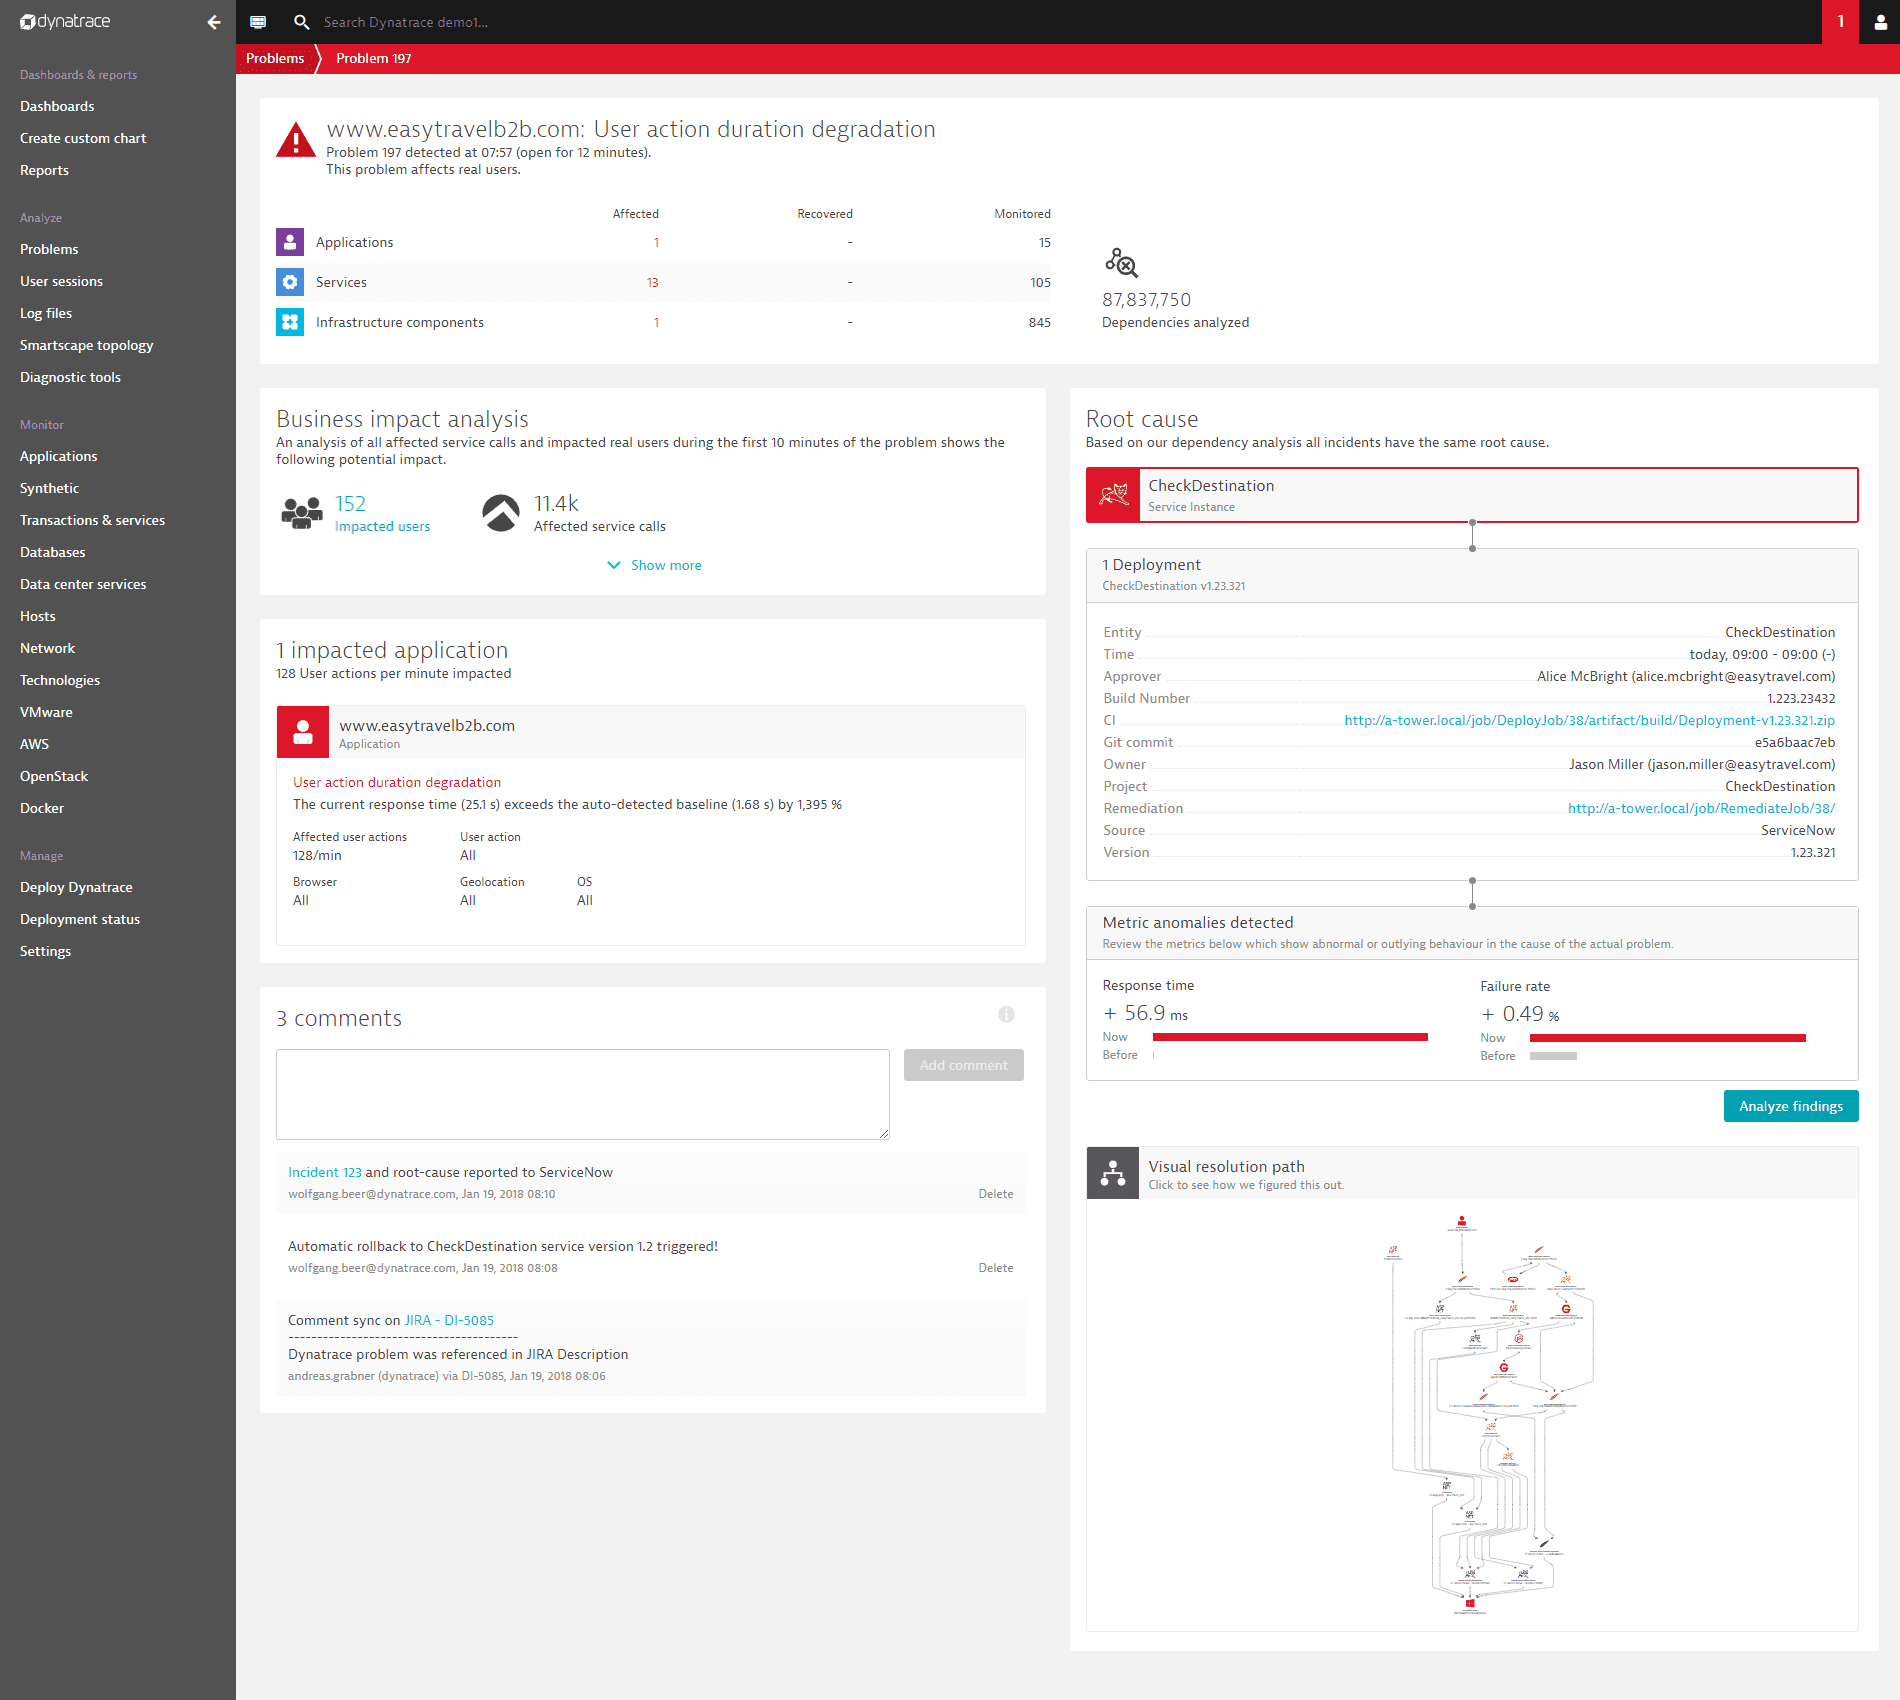
The example below presents a typical problem overview page that shows two root-cause contributors, one service called CheckDestination that degraded in response time and an underlying host that experiences a CPU saturation.
Opening a component overview page within the context of a problem will give you specific navigational hints about the violating metrics or about the detected issues on the focused component. The image below shows the host entity page with a navigational hint to review the CPU metric.
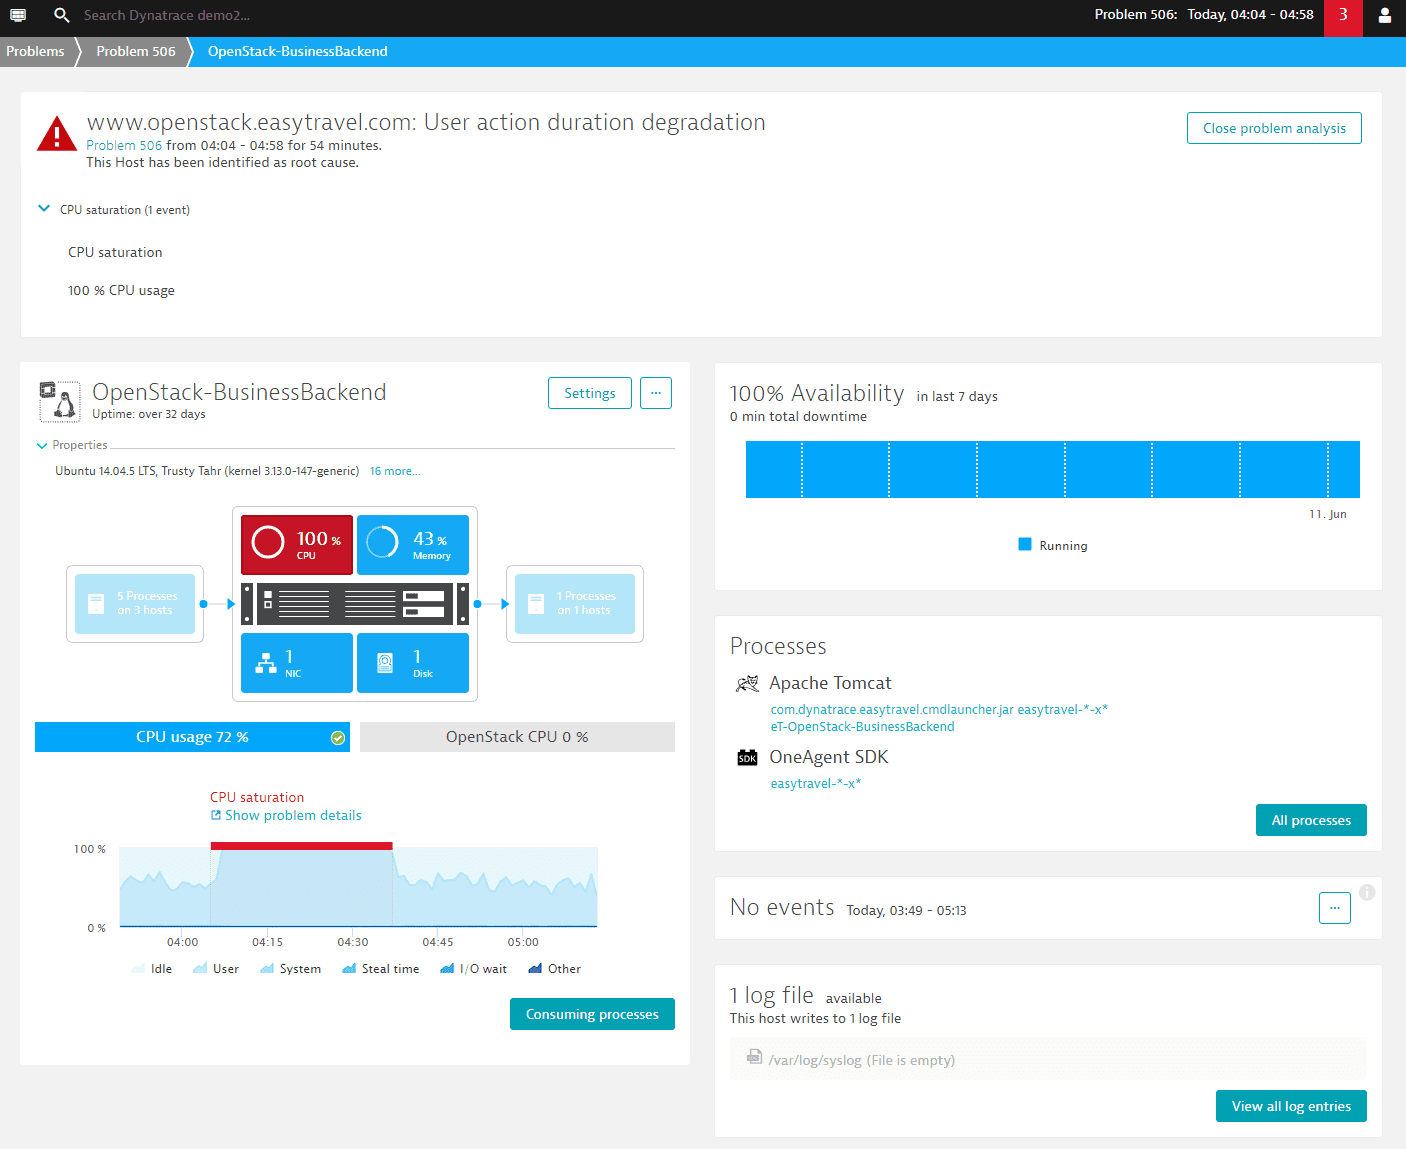
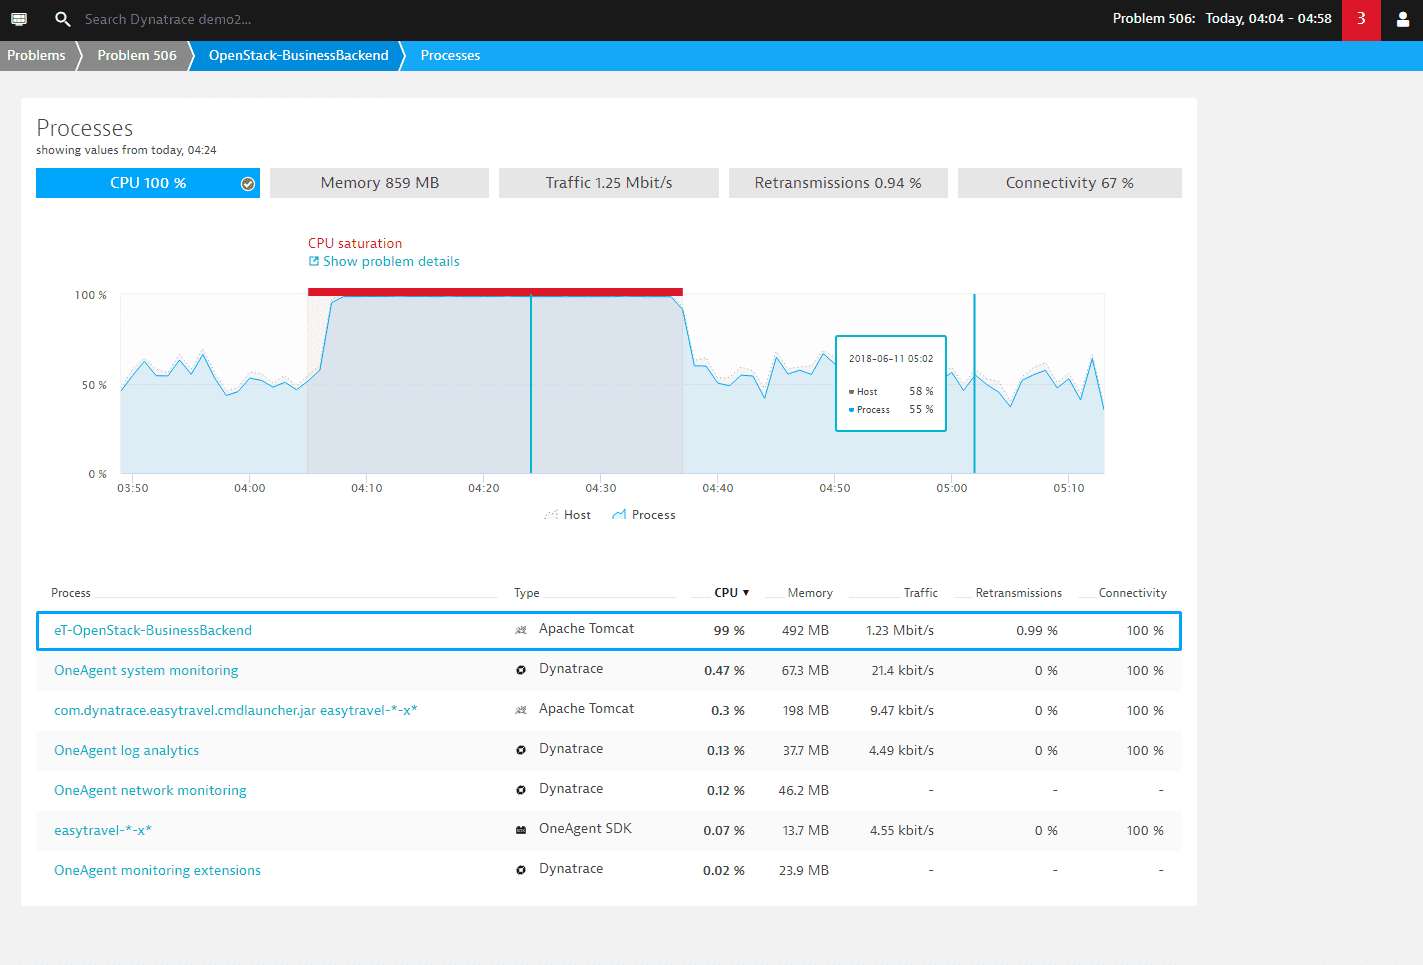
In case of a high CPU event on a host, you can further drill down to the list of consuming processes on that host to find out which processes are the main contributors.
Visual resolution path
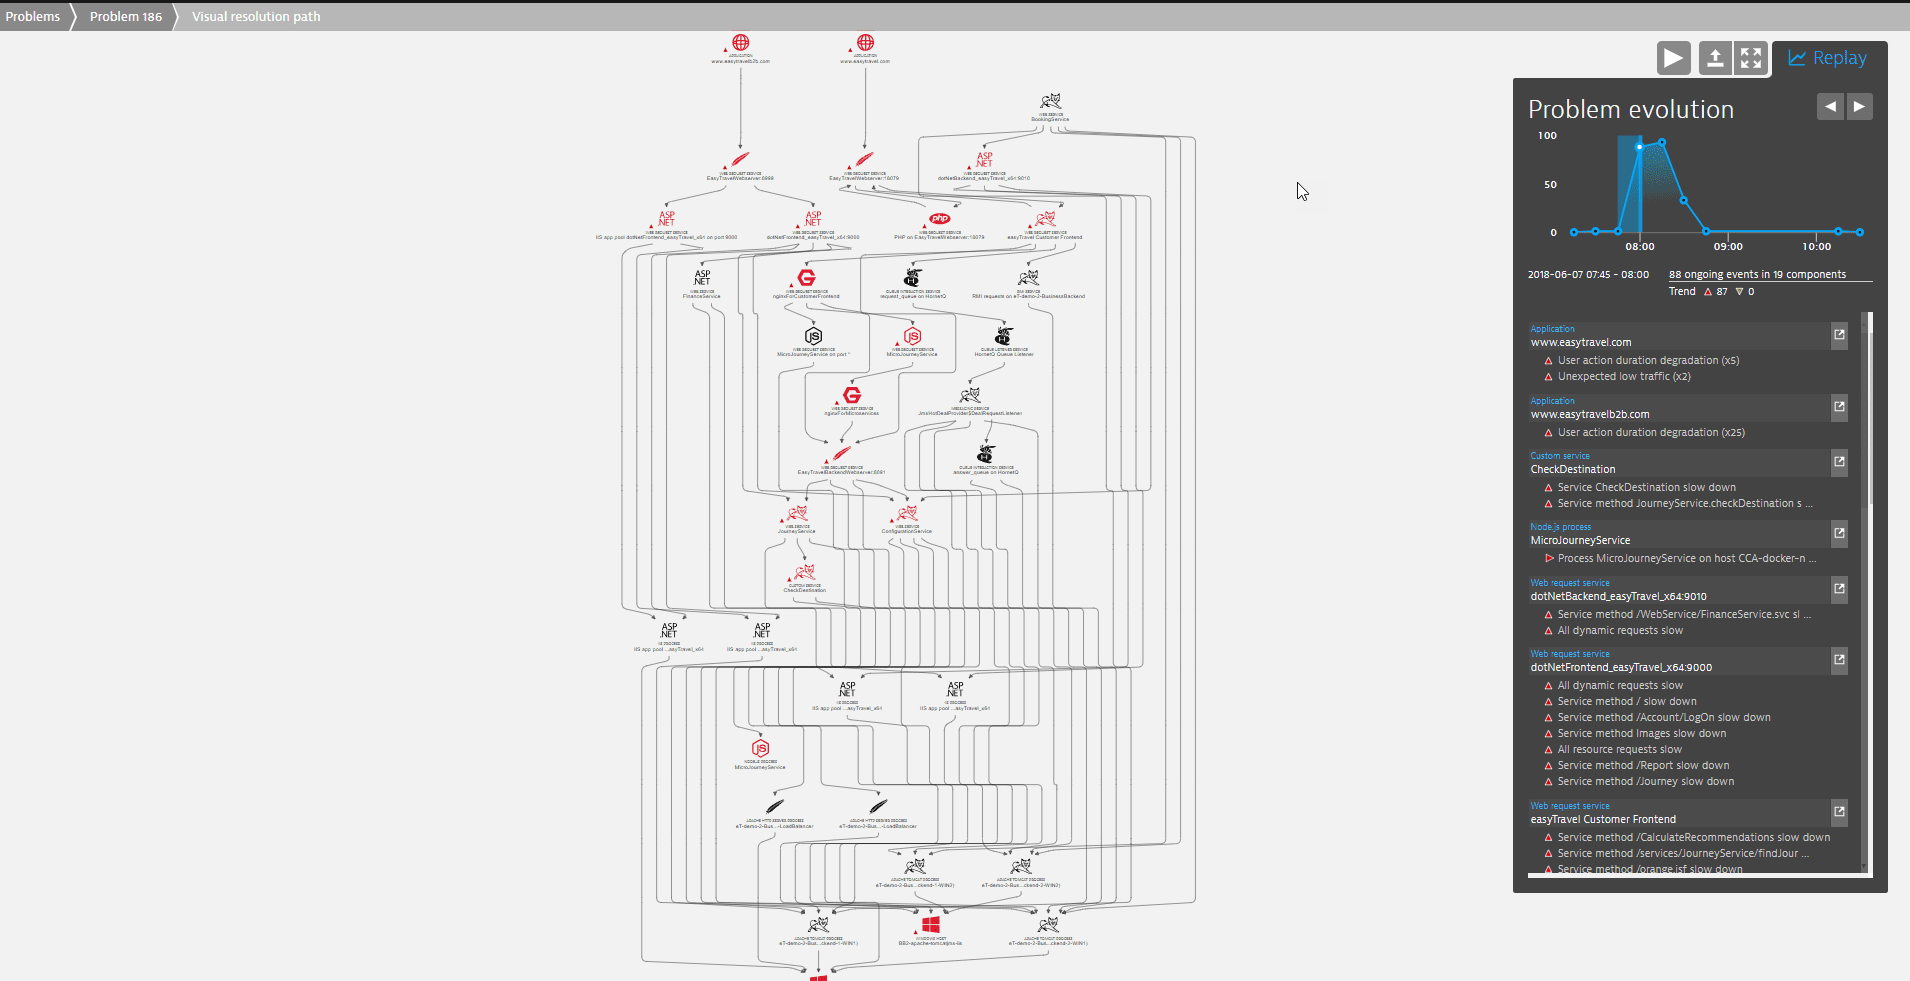
If several components of your infrastructure are affected, a Visual resolution path is included in the Root cause (see the example above). The visual resolution path is an overview of the part of your topology that has been affected by the problem. You can click the visual resolution path tile to see an enlarged view of the resolution path along with the Replay tab on the right (see image below).
The Replay tab enables you to follow the problem through its lifespan in detail by clicking the play arrow at the top. In the example below, you can see that the problem spiked between 8:00 and 9:00 o'clock.
- The list of events under the diagram includes all events that occurred within the highlighted interval (
2018-06-07 07:45 - 08:00). The events are grouped along the respective entities such as, in the example,www.easytravel.comandMicroJourneyService. - Click the arrow next to the name of an entity to display the entity overview page, where you can follow the navigational hints for further analysis.
Highlights of Davis root-cause detection
Powerful features make Davis root-cause detection fast, smart, and precise, with an increased awareness of external data and events.
Fault-tree analysis
Other products use general-purpose machine learning to build a context model. This takes time for collection and learning. Also, general-purpose machine learning does not provide information about causal direction. You may get a correlation between two metrics, for example, but you have no idea how they are related and whether one causes the other.
Davis has no such delay in learning dependencies, because the Davis context model is built on known dependency information from Smartscape, OneAgent, and cloud integration. Using this information, Davis quickly conducts a fault-tree analysis to analyze millions of dependencies and arrive at the most probable root cause of your problem.
Metric- and event-based detection of abnormal component state
Davis automatically checks all component metrics for suspicious behavior. This involves a near-real-time analysis of thousands of topologically related metrics per component and even your own custom metrics. More than this, however, Davis root-cause analysis can detect the root cause of an abnormal component state even when there is no open event on the component.
If an event is present or a user defines a custom threshold, that information is of course included in the root-cause process. Dynatrace detects more than 100 event types on various topological components that are raised either by automatic baselining or by thresholds. An example here is a baseline-triggered slowdown event on a web service or a simple CPU saturation event on a host.
Whenever an event is triggered on a component, the AI root-cause analysis automatically collects all the transactions (distributed traces) along the horizontal stack. The analysis automatically continues when the horizontal stack shows that a called service is also marked unhealthy. With each hop on the horizontal stack, the vertical technology stack is also collected and analyzed for unhealthy states.
Such an automatic event-based analysis is highly superior to any manual analysis, but this approach alone would be highly dependent on single events. Dynatrace AI goes beyond simple event-based analysis by automatically checking all the available metrics on all the affected components. Suspicious metric behavior is detected by analyzing the metric value distribution in the past and comparing it with the actual metric values.
Why this is so important
Consider what could happen in a root-cause analysis based solely on events. In the following image, an event is open on all unhealthy components and Dynatrace successfully detects the Linux host as the root cause:
There is an event (in this case, CPU saturation), so the root-cause analysis correctly detects the Linux host as the root cause:
Experience has shown, however, that a baseline or threshold does not always trigger an event within an abnormal situation. Let's modify the above example to remove one of the critical events within the affected topology. Assume that the Linux host CPU spikes but misses the critical threshold:
Because there is no event on the Linux host, an analysis based solely on events would show the host as healthy, not as part of the root cause. In the following vertical stack diagram, note that the Linux host no longer shows an open CPU event:
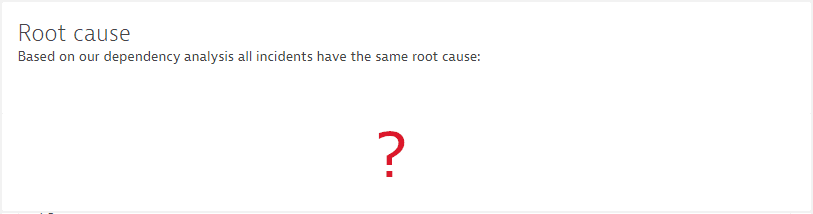
We would detect the root cause on the backend service but we wouldn't identify a root cause on the process or host level. The root-cause section in such cases would be empty:
The wrong solution
To avoid this, you might consider additional or more aggressive thresholds or baselines, but look at the numbers:
Every host comes with around 400 different metric types and timeseries, depending on the number of processes and technologies running. That means that 10K hosts result in 4,000,000 metrics in total.
Every threshold you set on a metric or even the best automatic baseline observed over a period of time means ~1% false positive alerts. Just 1 false positive alert on a host does not sound like much, but it means 10,000 false positive alerts on 10K hosts! With the growing number of metrics per component, we must expect a proportionally higher number of false positive alerts, which leads to alert spam.
That's obviously not the way to go.
The right solution
To get to the root cause more reliably, Davis root-cause analysis is not dependent solely on events and thresholds. Davis also analyzes all problem-related metrics proactively within the root-cause detection process, and detects suspicious metric behavior by analyzing the metric value distribution in the past and comparing it with the actual metric values. In the example below, metric anomalies now successfully point to the Linux host we might have missed in an analysis based solely on events.
Seamless integration of custom metrics within the Dynatrace AI process
You can integrate all kinds of metrics by writing custom plugins, JMX, or by using the Dynatrace REST API. Davis seamlessly analyzes your custom metrics along with all affected transactions. There's no need to define a threshold or to trigger an event for your custom metrics, as Davis automatically picks up metrics that display abnormal behavior.
The Dynatrace platform can ingest customer-defined metrics and events through plugins and the REST API. Plugins for third-party integrations can be a great resource for additional root-cause information. For example, close integration with your continuous integration and deployment toolchain can provide information about recent rollouts, responsible product owners, and possible remediation actions.
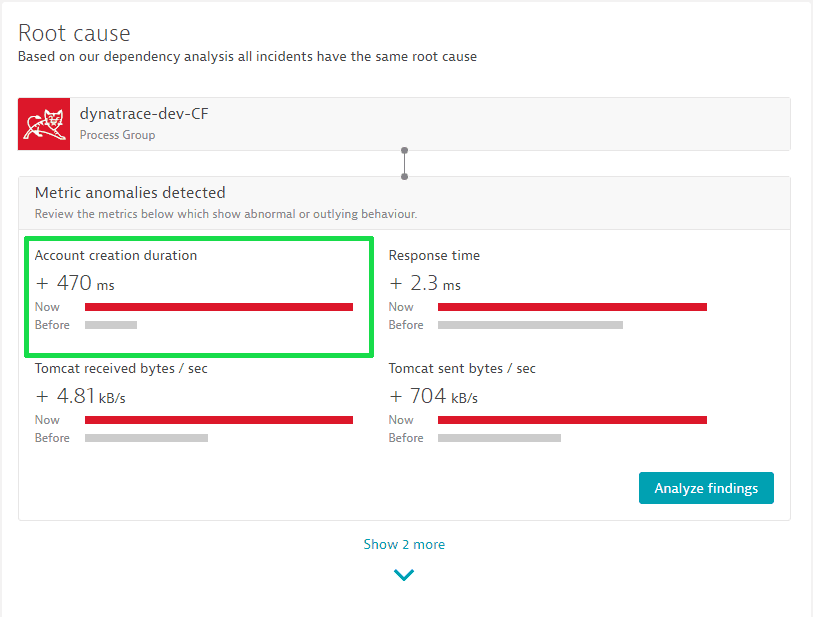
Davis root-cause analysis can ingest custom metrics and custom events sent from third-party integrations. Let’s focus on the analysis of custom metrics first.
In this example, we have a JMX metric called "Account creation duration" that represents the time needed to create a new account. Once the JMX metric is registered and monitored, it becomes a first-class citizen within the Davis root-causation engine. If there is a problem affecting real users, the JMX metric is automatically analyzed. If it shows an abnormal distribution compared to the past, it is identified within the root cause.
Third-party event ingests
Davis seamlessly picks up any third-party event along the affected Smartscape topology.
External events are another information source that Davis analyzes in the root-cause detection process. Such events could fall under one of the following categories:
Semantically predefined events, such as deployment, configuration change, or annotation
Generic events on each severity level, such as availability, error, slowdown, or resource
Informational events
External events can also contain key-value pairs to add additional context information about the event. In the following example, a third-party deployment event was sent through the REST event API and collected in the root-cause process:
Availability root cause
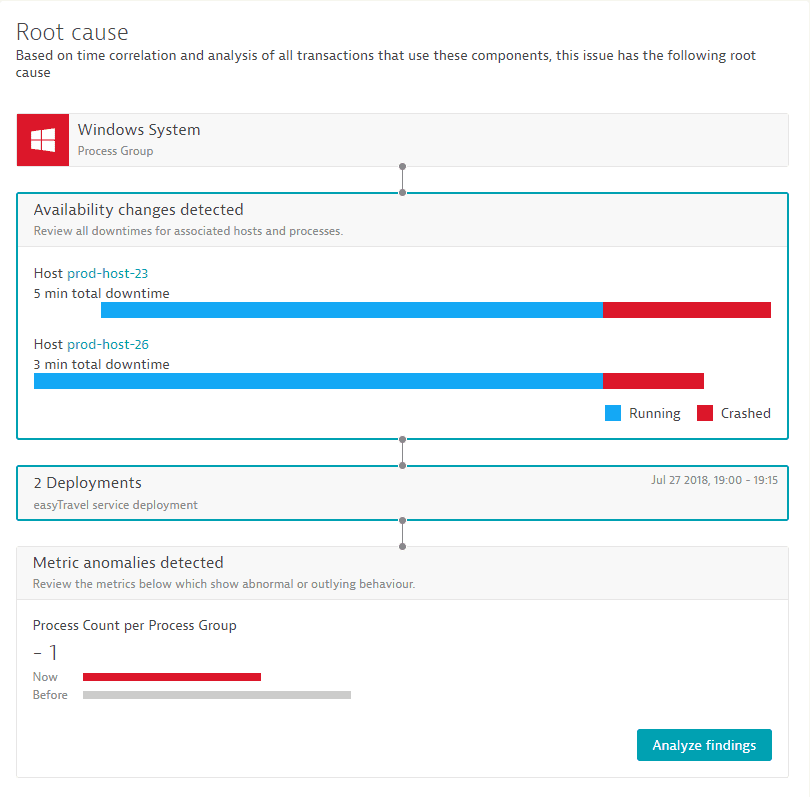
In many cases, the shutdown or restart of hosts or individual processes is the root cause of a detected problem. The availability root-cause section summarizes all relevant changes in availability within the grouped vertical stack.
Changes in availability on the host or process level often represent the root cause of large-scale issues within a technology stack. Different reasons lead to changes in availability, such as explicit restart of application servers after software updates, restart of hosts or virtual machines, and crashes of individual processes or servers.
While each Dynatrace-monitored host and process shows an availability chart within its component dashboard, it can be hard to quickly check the availability state of all the relevant components on the vertical stack of a service.
This is where the availability section within the problem root-cause section is so valuable. It immediately collects and summarizes all relevant downtimes of the relevant infrastructure and shows all the changes in availability of all the relevant processes and hosts that are running your services on top of the vertical stack.
Grouped root cause
The root-cause section of the problem details page displays up to three root-cause candidates, with candidates aggregated into groups of vertical topologies. This enables you to quickly review outliers within affected service instances or process clusters.
An analysis that detected root-cause candidates on individual components rather than on group level could lead to an information explosion in the case of highly clustered environments. For example, imagine you run 25 processes within a cluster to serve a microservice. If some of the processes are identified as root causes, the Dynatrace root-cause section would display individual instances rather than explaining the overall problem.
That's what makes the detection of grouped root causes another highlight of Davis root-cause analysis. It identifies root-cause candidates on a group level to explain the overall situation, such as a set of outliers within a large cluster of service instances.
The problem details screen shows just a quick summary of the top contributors, but a click on the Analyze findings button opens a detailed analysis view. The root-cause analysis view can chart all affected service instances in a combined chart along with all the identified abnormal metrics. This drilldown view is organized to show an identified root cause as a grouped vertical stack, which means that the top layer always shows service findings, followed by process group findings, and then all host and infrastructure findings.
As shown in the following screen, each vertical stack layer is shown as a tile containing all the metrics where abnormal behavior is detected. When more than one service instance, process group instance, or docker image is affected, the metric chart automatically groups those instances into a combined chart that shows all metric findings on the vertical stack.
Use case
To learn more, walk through this root-cause analysis.
When a network link or segment is overloaded or underperforming, it drops data packets. This is because overloaded network equipment queues are purged during periods of excessive traffic or limited hardware resources. In response, TCP protocol mechanisms attempt to fix the situation by re-transmitting the dropped packets.
Ideally, retransmission rates should not exceed 0.5% on local area networks and 2% in Internet- or cloud-based networks. Retransmission rates above 3% will negatively affect user experience in most modern applications. Retransmission issues are especially noticeable by customers using mobile devices in poor network coverage areas.
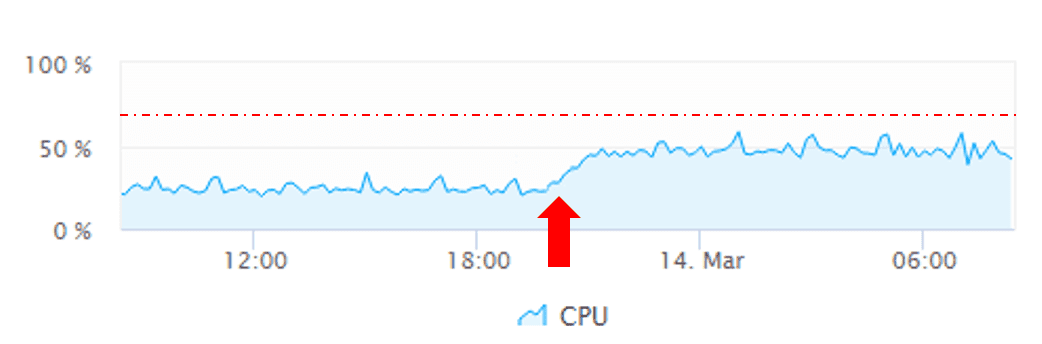
The problem occurs
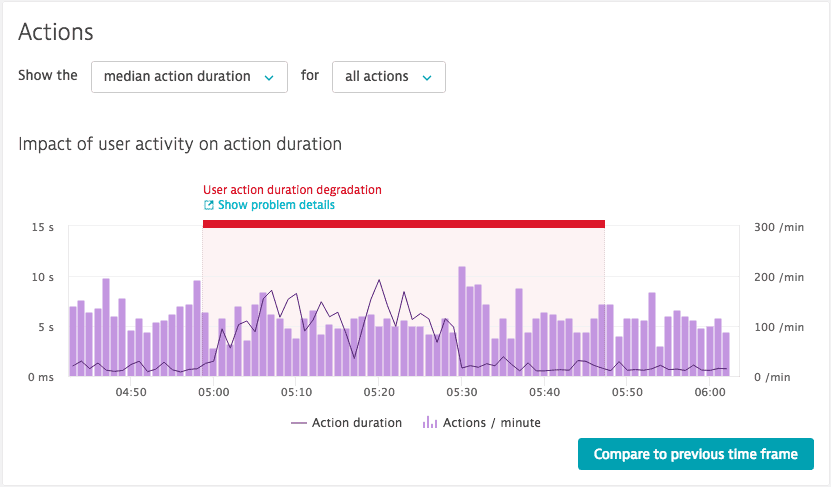
In the example below, at 05:00 on the timeline, a period of high retransmission has dramatically increased the duration of each user action and reduced the number of user actions per minute. Although different applications have varying sensitivity to poor network connection quality, such a condition will likely not only be detectable on the infrastructure level. It will also affect the response time of your application's services and ultimately degrade user experience in the form of increased load times.
The problem is detected
Davis detects this problem and monitors its severity across the infrastructure, service, and Real User Monitoring layers, showing you how this infrastructure issue translates into user experience problems for your customers.
Below is an example of packet loss causing high TCP retransmission rates on an Apache web server. This high TCP retransmission rate causes service response time to increase (the server stack needs more time to retransmit the missing data packets). This ultimately has an impact on end user experience because users now have to wait longer for their web pages to load.
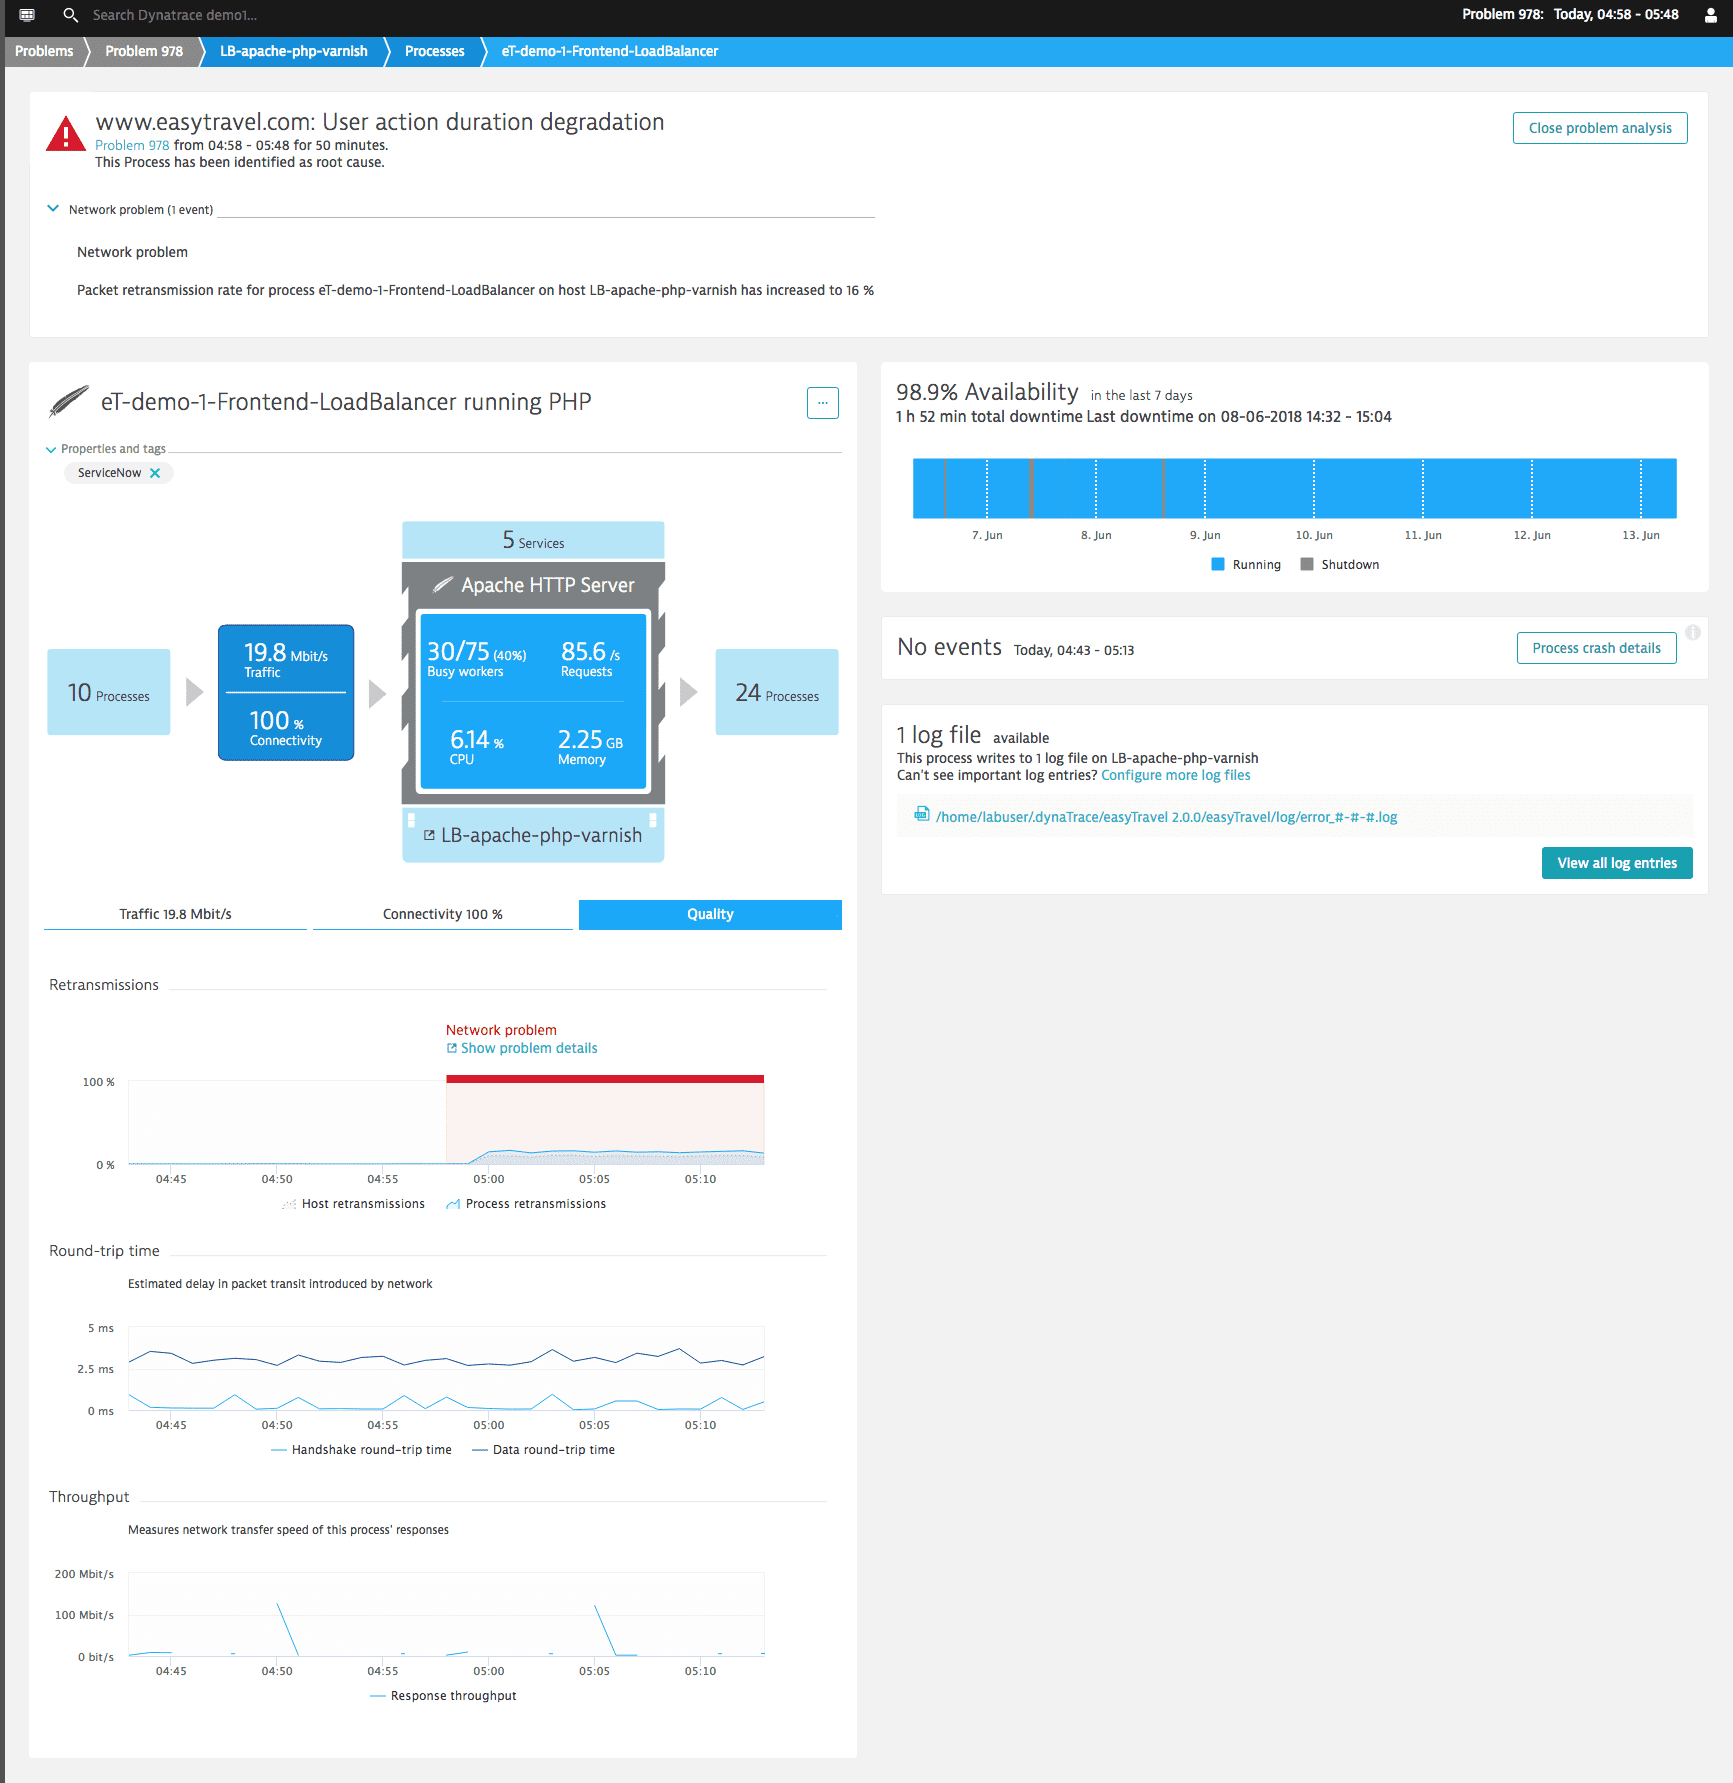
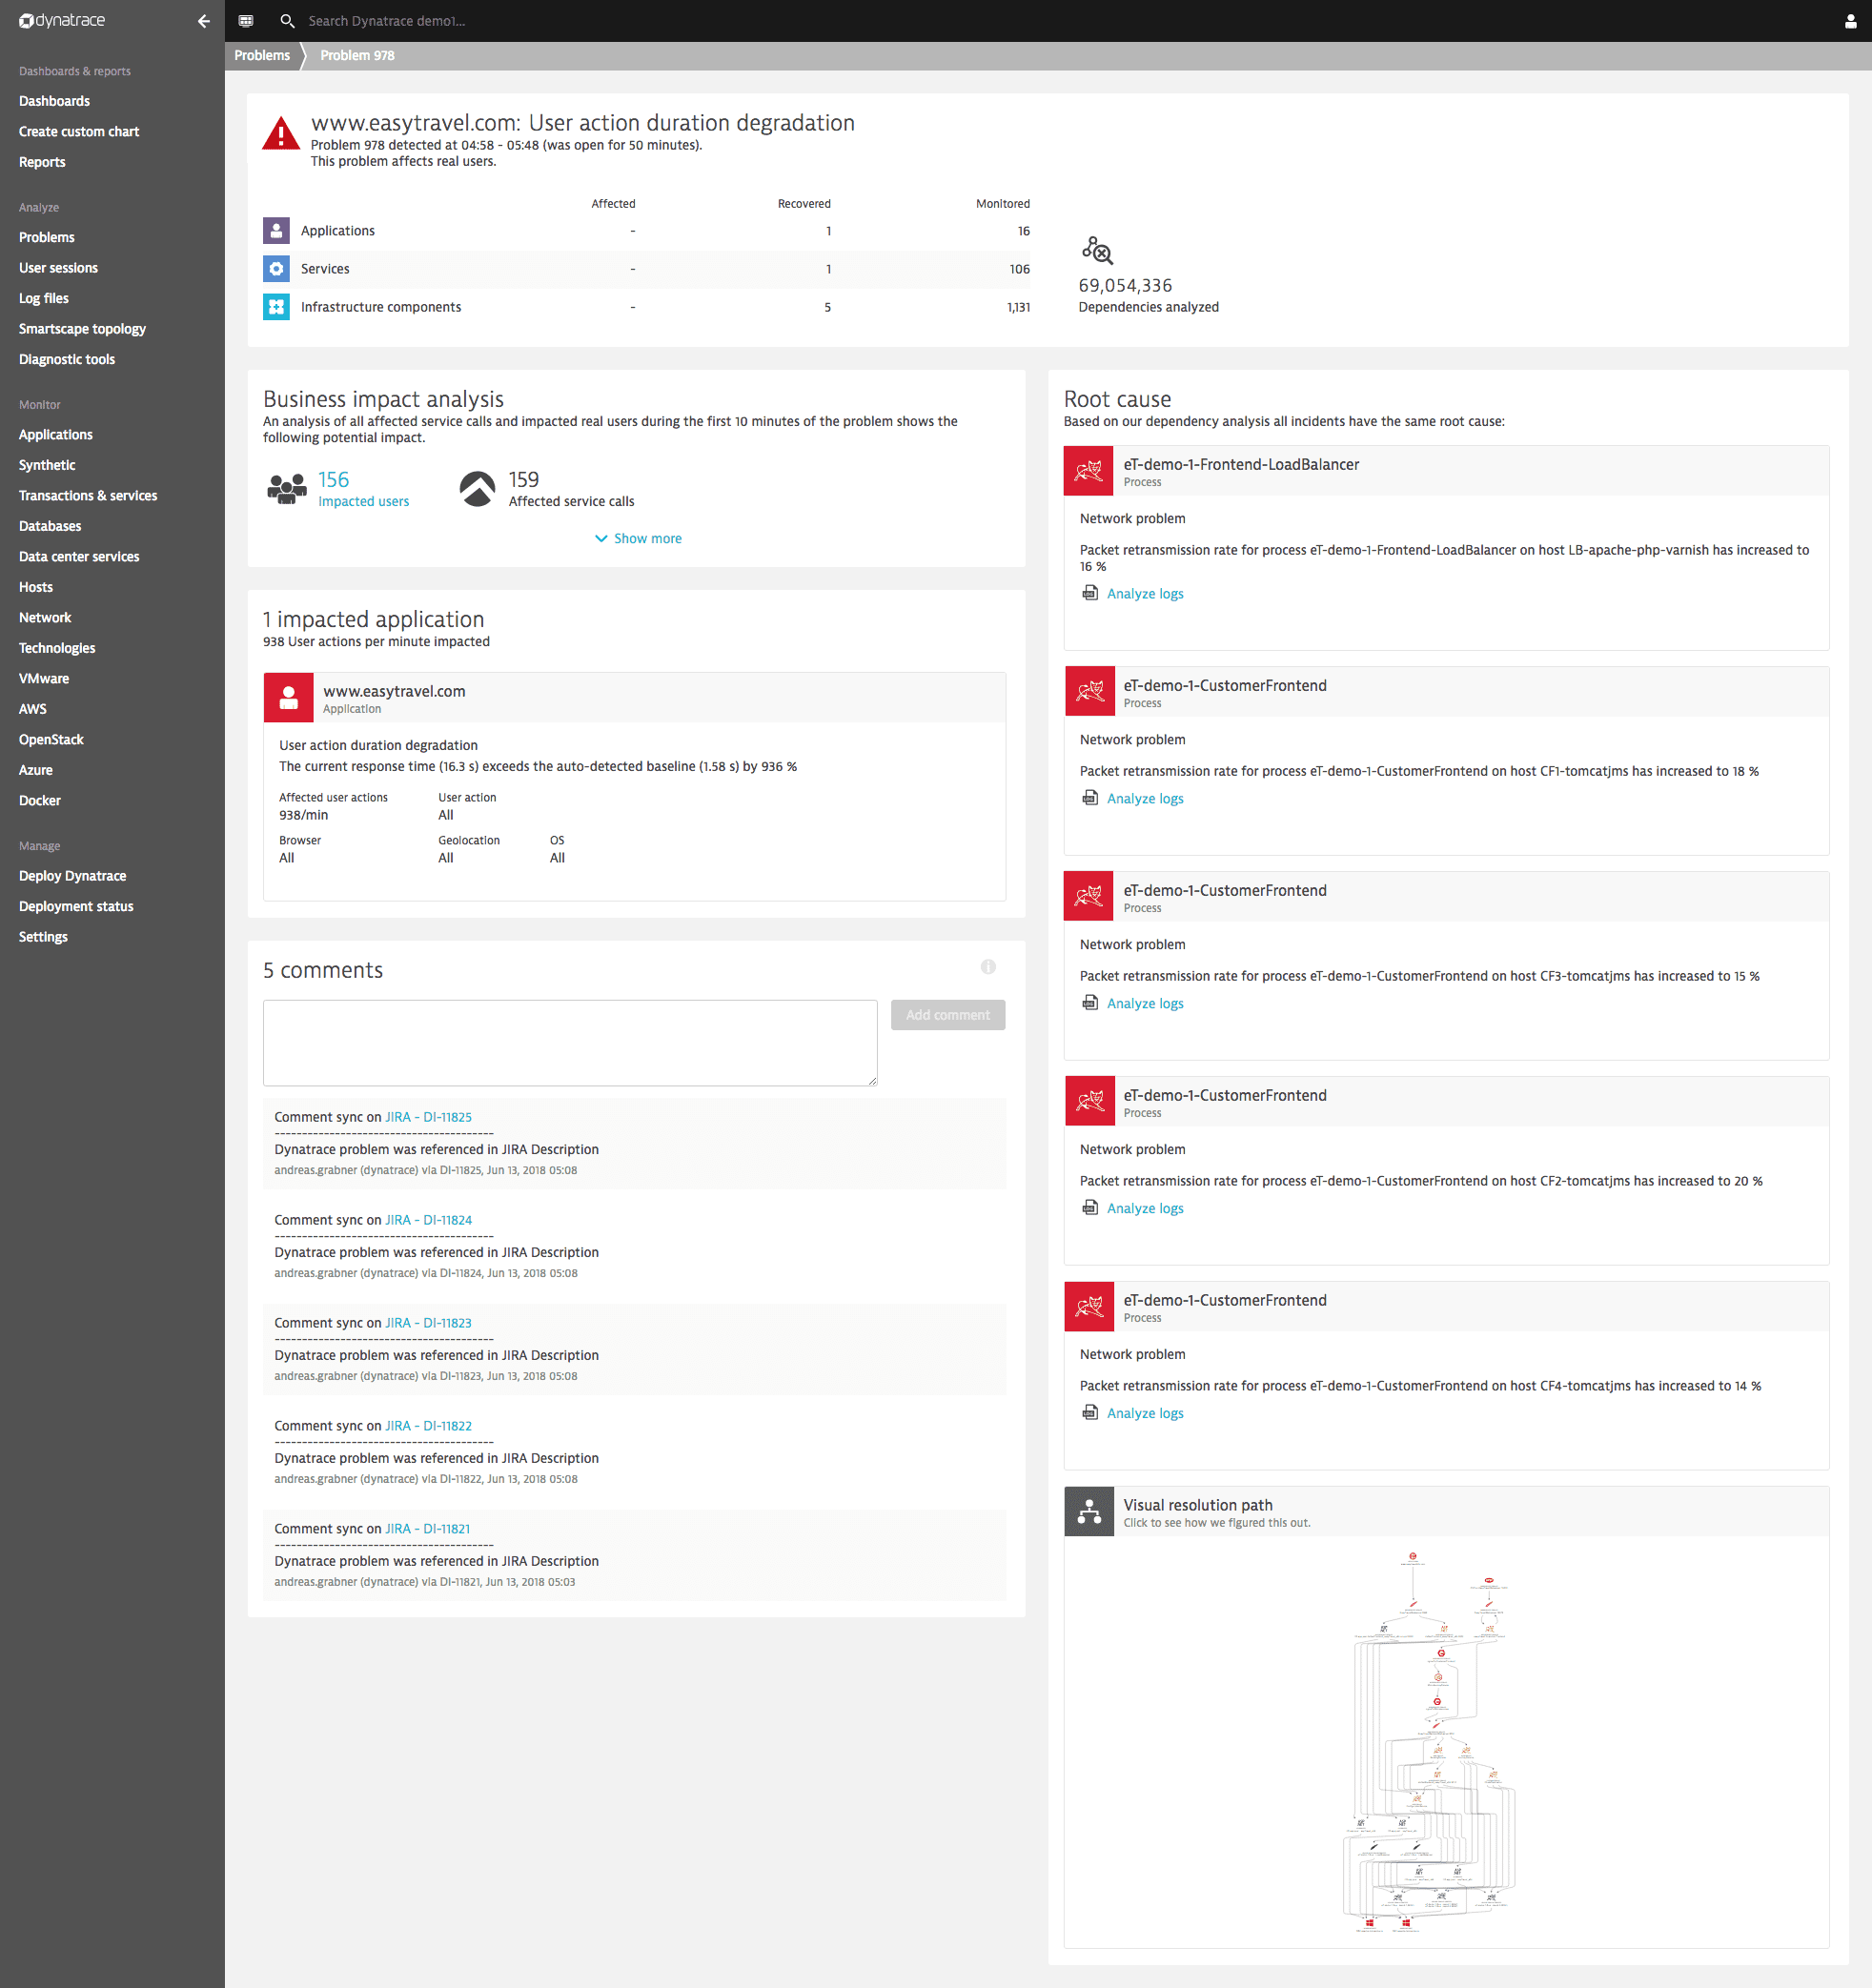
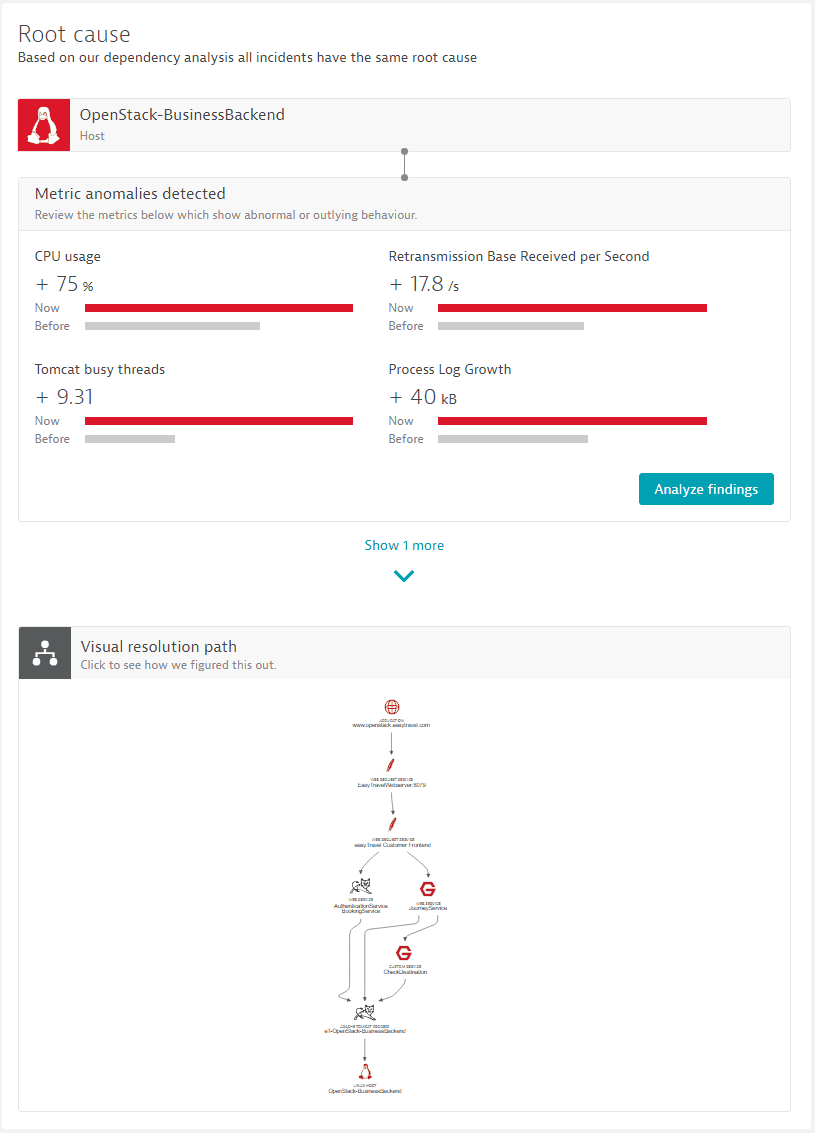
Root cause analysis of the problem
Davis detects the common context of these events across the infrastructure, service, and user experience layers and presents the root-cause analysis. See the Root cause section of the Problem page below: Retransmission rate is shown to be the root cause of this problem.