Salesforce Insights
Latest Dynatrace
Salesforce Insights enables Salesforce administrators and IT operations teams to monitor their Salesforce environment.
Salesforce Insights capabilities
In Salesforce Insights, out-of-the-box dashboard charts highlight performance, feature adoption, logins, user actions, and threats to your Salesforce environment. Salesforce Insights can also examine and report on the activity of a single user.
Salesforce administrators use the app to ensure optimal performance of the Salesforce solution.
Salesforce Insights is intended for you if you:
Are responsible for supporting Salesforce users and Salesforce security standards.
Need to collaborate with IT teams to understand and resolve your issues.
Supported event and object types
Dynatrace supports the subset of Salesforce event and object types listed below.
-
Real-time events
- URI events (
salesforce.UriEvent) - Lightning URI events (
salesforce.LightningUriEvent) - Login events (
salesforce.LoginEvent) - Report events (
salesforce.ReportEvent) - List view events (
salesforce.ListViewEvent) - Session hijacking event store (
SessionHijackingEventStore) - Report anomaly event store (
ReportAnomalyEventStore) - API anomaly event store (
ApiAnomalyEventStore)
- URI events (
-
Standard objects
- Opportunity field history events (
salesforce.OpportunityFieldHistory)
- Opportunity field history events (
Prerequisites
The following prerequisites for using Salesforce Insights are required in Salesforce and Dynatrace.
Salesforce prerequisites
-
Salesforce account
Salesforce events are derived from the Salesforce streaming API. To use Salesforce Insights, you need to have a Salesforce account with a Salesforce Shield or a Salesforce Event Monitoring add-on subscription.
-
Enable event storage
To enable storage for all required real-time events, log in to your Salesforce account and search for Event Manager, where you can find an overview of all available real-time events. For all events you want to ingest into Dynatrace, select the Enable Storage option.
-
Credentials/permissions
In Salesforce, create a connected app and/or an API user for Salesforce Insights. Ensure that you grant the required Salesforce permissions to access their API and event monitoring data. Ensure that Salesforce IP restrictions are not applied to the related user profile.
Dynatrace prerequisites
-
Allow Salesforce for outbound connections
- In Dynatrace, go to Settings > Preferences > Limit Outbound Connections.
- Select Add item and add
*.salesforce.comso that Salesforce Insights can connect to the Salesforce streaming API. - Select Save changes.
-
Check user permissions
The user who installs and sets up the app needs to have privileges to install apps, set up automation, and read or write business events. Check the required policies below.
-
Grant permissions to Workflows
Check if Workflows has the required permissions to run automations. Open Workflows
 and select Settings > Authorization settings in the upper-right corner. Enable the settings below.
app-engine:apps:runapp-engine:functions:runapp-settings:objects:readautomation:workflows:readautomation:workflows:writestate:app-states:readstorage:bizevents:readstorage:buckets:readstorage:events:write
Policy statements for Salesforce Insights
Administration user
ALLOW app-engine:functions:run, app-engine:apps:run, app-engine:apps:install, app-engine:apps:delete;ALLOW automation:workflows:read, automation:rules:read, automation:calendars:read;ALLOW state:app-states:read, state:app-states:write, state:app-states:delete, state:user-app-states:read, state:user-app-states:write, state:user-app-states:delete, app-settings:objects:read, app-settings:objects:write;ALLOW settings:objects:read, settings:objects:write, settings:schemas:read where settings:schemaId startsWith "app:";ALLOW storage:buckets:read WHERE storage:table-name = "bizevents";ALLOW storage:bizevents:read;ALLOW storage:events:write;
Application user
ALLOW storage:bizevents:read;ALLOW storage:buckets:read where storage:table-name = "bizevents";ALLOW app-engine:apps:run where shared:app-id = "dynatrace.biz.salesforce.insights";ALLOW app-settings:objects:read where settings:schemaId = "app:dynatrace.biz.salesforce.insights:biz-salesforce-insights-settings";ALLOW settings:objects:read where settings:schemaId = "app:dynatrace.biz.salesforce.insights:biz-salesforce-insights-settings";
Set up Salesforce Insights
To set up Salesforce Insights and ingest your events
- Ensure that Dynatrace can connect to Salesforce.
- From your Dynatrace environment, go to Dynatrace Hub
 and install Salesforce Insights
  .
. - In Salesforce Insights, go to Settings to create a new configuration.
Choose a name for your configuration.
- Specify your Salesforce URL, for example,
https://{environment}.my.salesforce.com. - Specify the Client id (consumer key) and Client secret (consumer secret) provided by your Salesforce administrator.
- Select a Login type.
- If you've selected the Credentials login type, enter your login credentials (Username and Password).
- Test the connection. If the test is successful, select the event types you want ingested into Dynatrace.
- Select Save Changes.
- Select Start Ingest.
At this point, Salesforce Insights begins ingesting the selected data from your Salesforce environment into Grail at one-minute intervals.
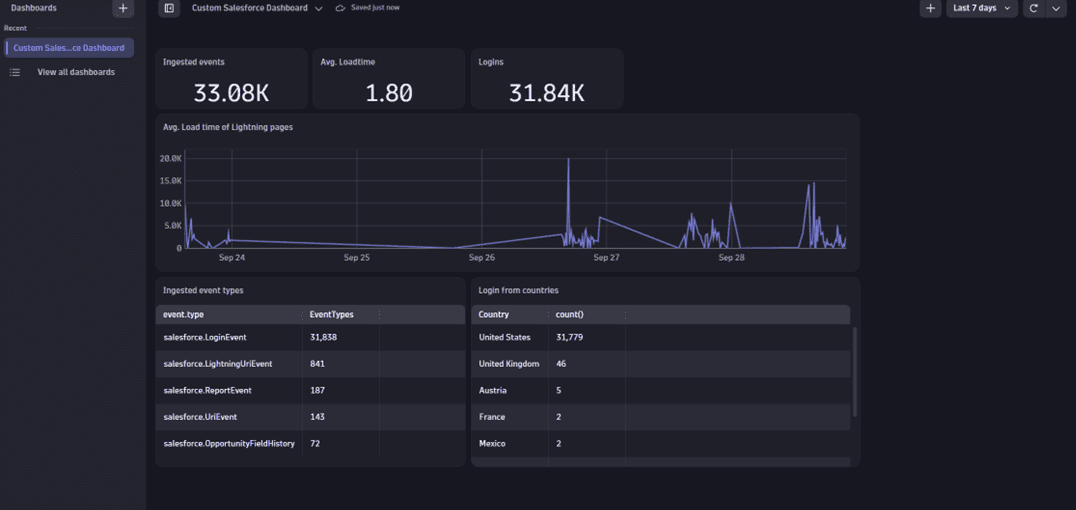
Salesforce Insights Dashboard
The Dashboard displays important Salesforce status and user activity, including:
System health, performance summaries, login failures, and threats.
Login analysis to show successful and failed logins.
Origin, indicating where users are located.
Performance analysis to show load times and timeouts for Lightning pages.
Slowest Lightning pages.
Threat and anomaly analysis.
Dashboard tiles include View Details links to view aggregated chart data or unaggregated raw data. You can also open the associated query in Notebooks for further exploratory analytics.
Timed out pages KPI: This metric calculates the number of Lightning pages with a load time that is greater than 60 seconds. This doesn’t mean that all these pages were never loaded; it only indicates that the load time was greater than 60 seconds.
The Investigate User Actions page
The user action analysis page allows you to analyze the activities of an individual user, including geolocated logins, Lightning operations split by type, and report events split by reports run and reports exported. Notebooks delivers additional exploratory analytics.
Advanced analytics with Notebooks
You can use Notebooks  to query, analyze, visualize, and share your Salesforce data.
Example 1
Get all ingested Salesforce event types.
fetch bizevents| filter contains (event.provider, "salesforce")| summarize count(), by:{event.type}
Results
event.type | count() |
|---|---|
| 108 |
| 1556 |
| 25 |
| 182 |
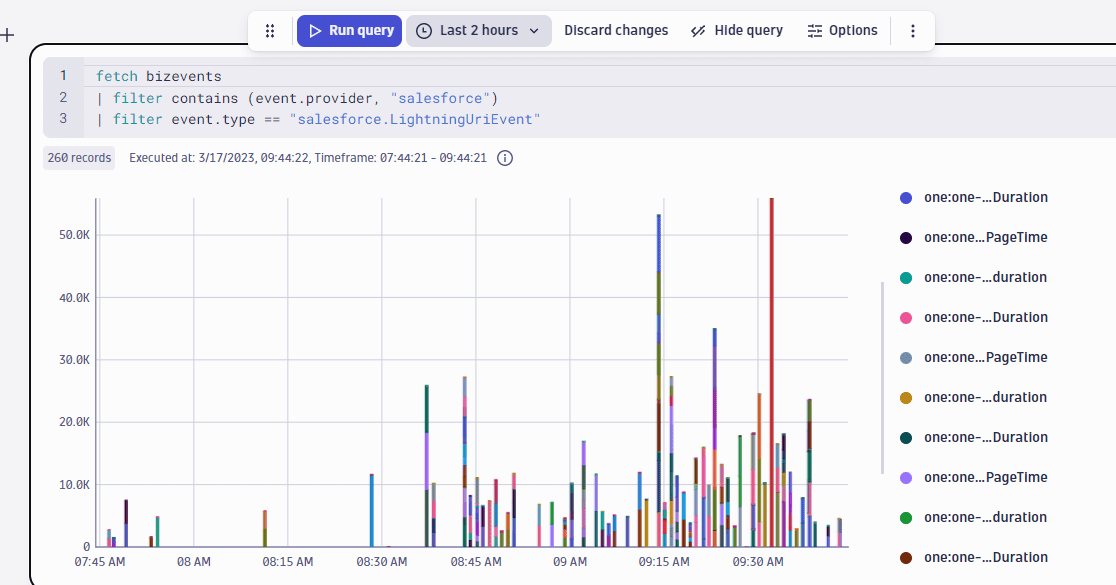
Example 2
Get all events for a certain event type.
fetch bizevents| filter contains (event.provider, "salesforce")| filter event.type == “salesforce.LightningUriEvent”
In the results table, you get a list of all Lightning URI events.
Custom dashboards
You can use the Dashboards app to create custom visualizations of your Salesforce data.
Extend the retention period for Salesforce Insights data
By default, your ingested data is stored for 30 days. You can adjust the retention time by creating a custom bucket.
To create a custom bucket for a Salesforce event
-
In Dynatrace, go to Settings > Business Analytics > Bucket assignment.
-
On the Business event bucket assignment page, select Add rule and name your rule.
-
In the Bucket field, choose your retention period.
-
Add a Matcher to your rule by typing or pasting your matcher-specific DQL query. Events that match your rule will be assigned to your selected bucket. If no rules match, events will be assigned to the default bucket. To assign all your Salesforce events to your bucket, you need to use the matcher containing the
matchesValuefunction and your Salesforce URL, as in the example below.matchesValue(event.provider, "https://environment.my.salesforce.com") -
Select Save changes.