How to use DQL queries
The Dynatrace Query Language (DQL) introduces important concepts you should understand as you get started.
A DQL query is a read-only request to process data and return results. The request is stated in plain text, using a pipeline-based data-flow model that is easy to read, author, and automate.
Chaining commands with the pipe operator
A DQL query contains at least one or more commands, each of which returns tabular output containing records (lines or rows) and fields (columns). All commands are sequenced by a | (pipe). The data flows or is funneled from one command to the next. The data is filtered or manipulated at each step and then streamed into the following step.
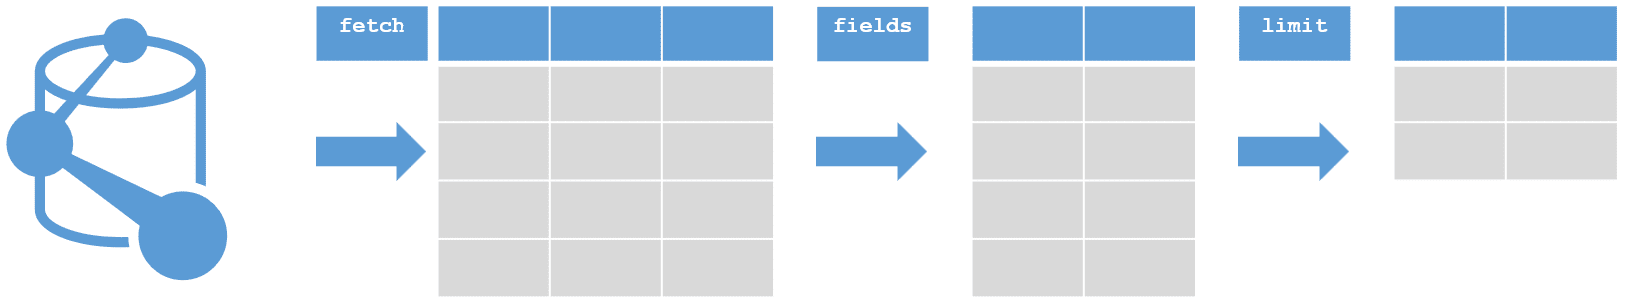
After each operation, DQL returns a table or collection of tables containing data. The pipe operator funnels those tables into the next operation, where they're further processed or manipulated. This makes it easy to incrementally chain operations until the final, intended result is achieved.
Because the channeling of information from one operator to another is sequential, the query operator order is important and can affect both results and performance.
The best way to learn DQL is to start with some basic queries.
Load data
The DQL fetch command defines which data to load from Dynatrace and optionally process in the following processing pipeline steps.
The fetch command requires a reference to the kind of data that should be retrieved by the initial processing pipeline. The following example uses logs.
fetch logs| filter loglevel == "ERROR"| summarize numErr = count()
The statement begins with loading (fetch) all ingested logs. Since no query timeframe was specified in the first stage, the time range specified in the Dynatrace user interface is applied. It contains three commands—fetch, filter, and summarize—each separated by a pipe.
The log records are fed into the filter command, which reduces the number of output records based on the specified filter expression. The last line returns a table with one field and one record containing the count of remaining rows.
| numErr |
|---|
34 |
You can also change the data type to events by using the fetch command and following it with events. The example query shows the sum value for the amount field in the events data set.
fetch events| summarize Total_amount = sum(amount)
| Total_amount |
|---|
|
Specify timeframe
We suggest using the controls offered by the user interface to select your query time frame.
However, the DQL statement allows you to override the UI selection by using the from or to parameter to specify your intended time range.
Unless specified in the application or in the API, the default timeframe is 2 hours.
This example with relative time ranges queries logs from the last two hours:
fetch logs, from:now() - 2h
This example queries logs from the last 24 hours, excluding the last two hours:
fetch logs, from:now() - 24h, to:now() - 2h
You can also use absolute time ranges with the timeframe parameter:
fetch logs, timeframe:"2021-10-20T00:00:00Z/2021-10-28T12:00:00Z"
Filter by Boolean expression
Narrow down the requested records with filter. Use operators like == or != to include or exclude fields with specific values. Functions like endsWith or contains let you include fields that end with or contain a specific string.
fetch logs, from:now() - 2h| filter loglevel == "SEVERE" or loglevel == "ERROR" and not endsWith(log.source,"audit.log")
Select a subset of fields
fetch logs| fields timestamp, loglevel, log.source, content
Order results with sort
By default, the sort command sorts records in ascending order. In the following example, we sort results in descending order.
fetch logs| filter loglevel == "SEVERE" or loglevel == "ERROR"| fields timestamp, loglevel, dt.process.name, host.name, content| limit 5| sort timestamp desc
Aggregations
This example calculates the number of booking.process.started events. Intentionally only business days and hours (Mon-Fri, 8:00 AM to 5:00 PM) are accepteded by the aggregation.
fetch bizevents| filter event.type=="booking.process.started"| fieldsAdd hour=formatTimestamp(timestamp,format:"hh"), day_of_week=formatTimestamp(timestamp,format:"EE")| filterOut (day_of_week == "Sat" or day_of_week == "Sun") or (toLong(hour) <= 08 or toLong(hour) >= 17)| summarize numStarts = count(), by:{product}
Aggregations over time
DQL provides dedicated commands such as makeTimeseries to aggregate a list of raw event records into a chartable timeseries. Let's observe the logs grouped by the log level and a 5-minute aggregation interval:
fetch logs| filter loglevel == "SEVERE" or loglevel == "ERROR"| makeTimeseries count = count(), by:loglevel, interval:5m
Learn DQL App
You can learn DQL through hands-on experience with interactive tutorials in the Learn DQL App. You can use the app, if you are a customer with access to Dynatrace SaaS environment or if you are a registered member of the Dynatrace Community. You can also sign up for a 15 day free trial to try out the app. To find out more about the Learn DQL app see the Dynatrace Hub. To access the app visit Discover Dynatrace.