Distributed traces overview
A core feature of Dynatrace, PurePath® technology combines distributed tracing with code-level visibility, topology information, and metadata to provide the highest level of data granularity and fidelity.
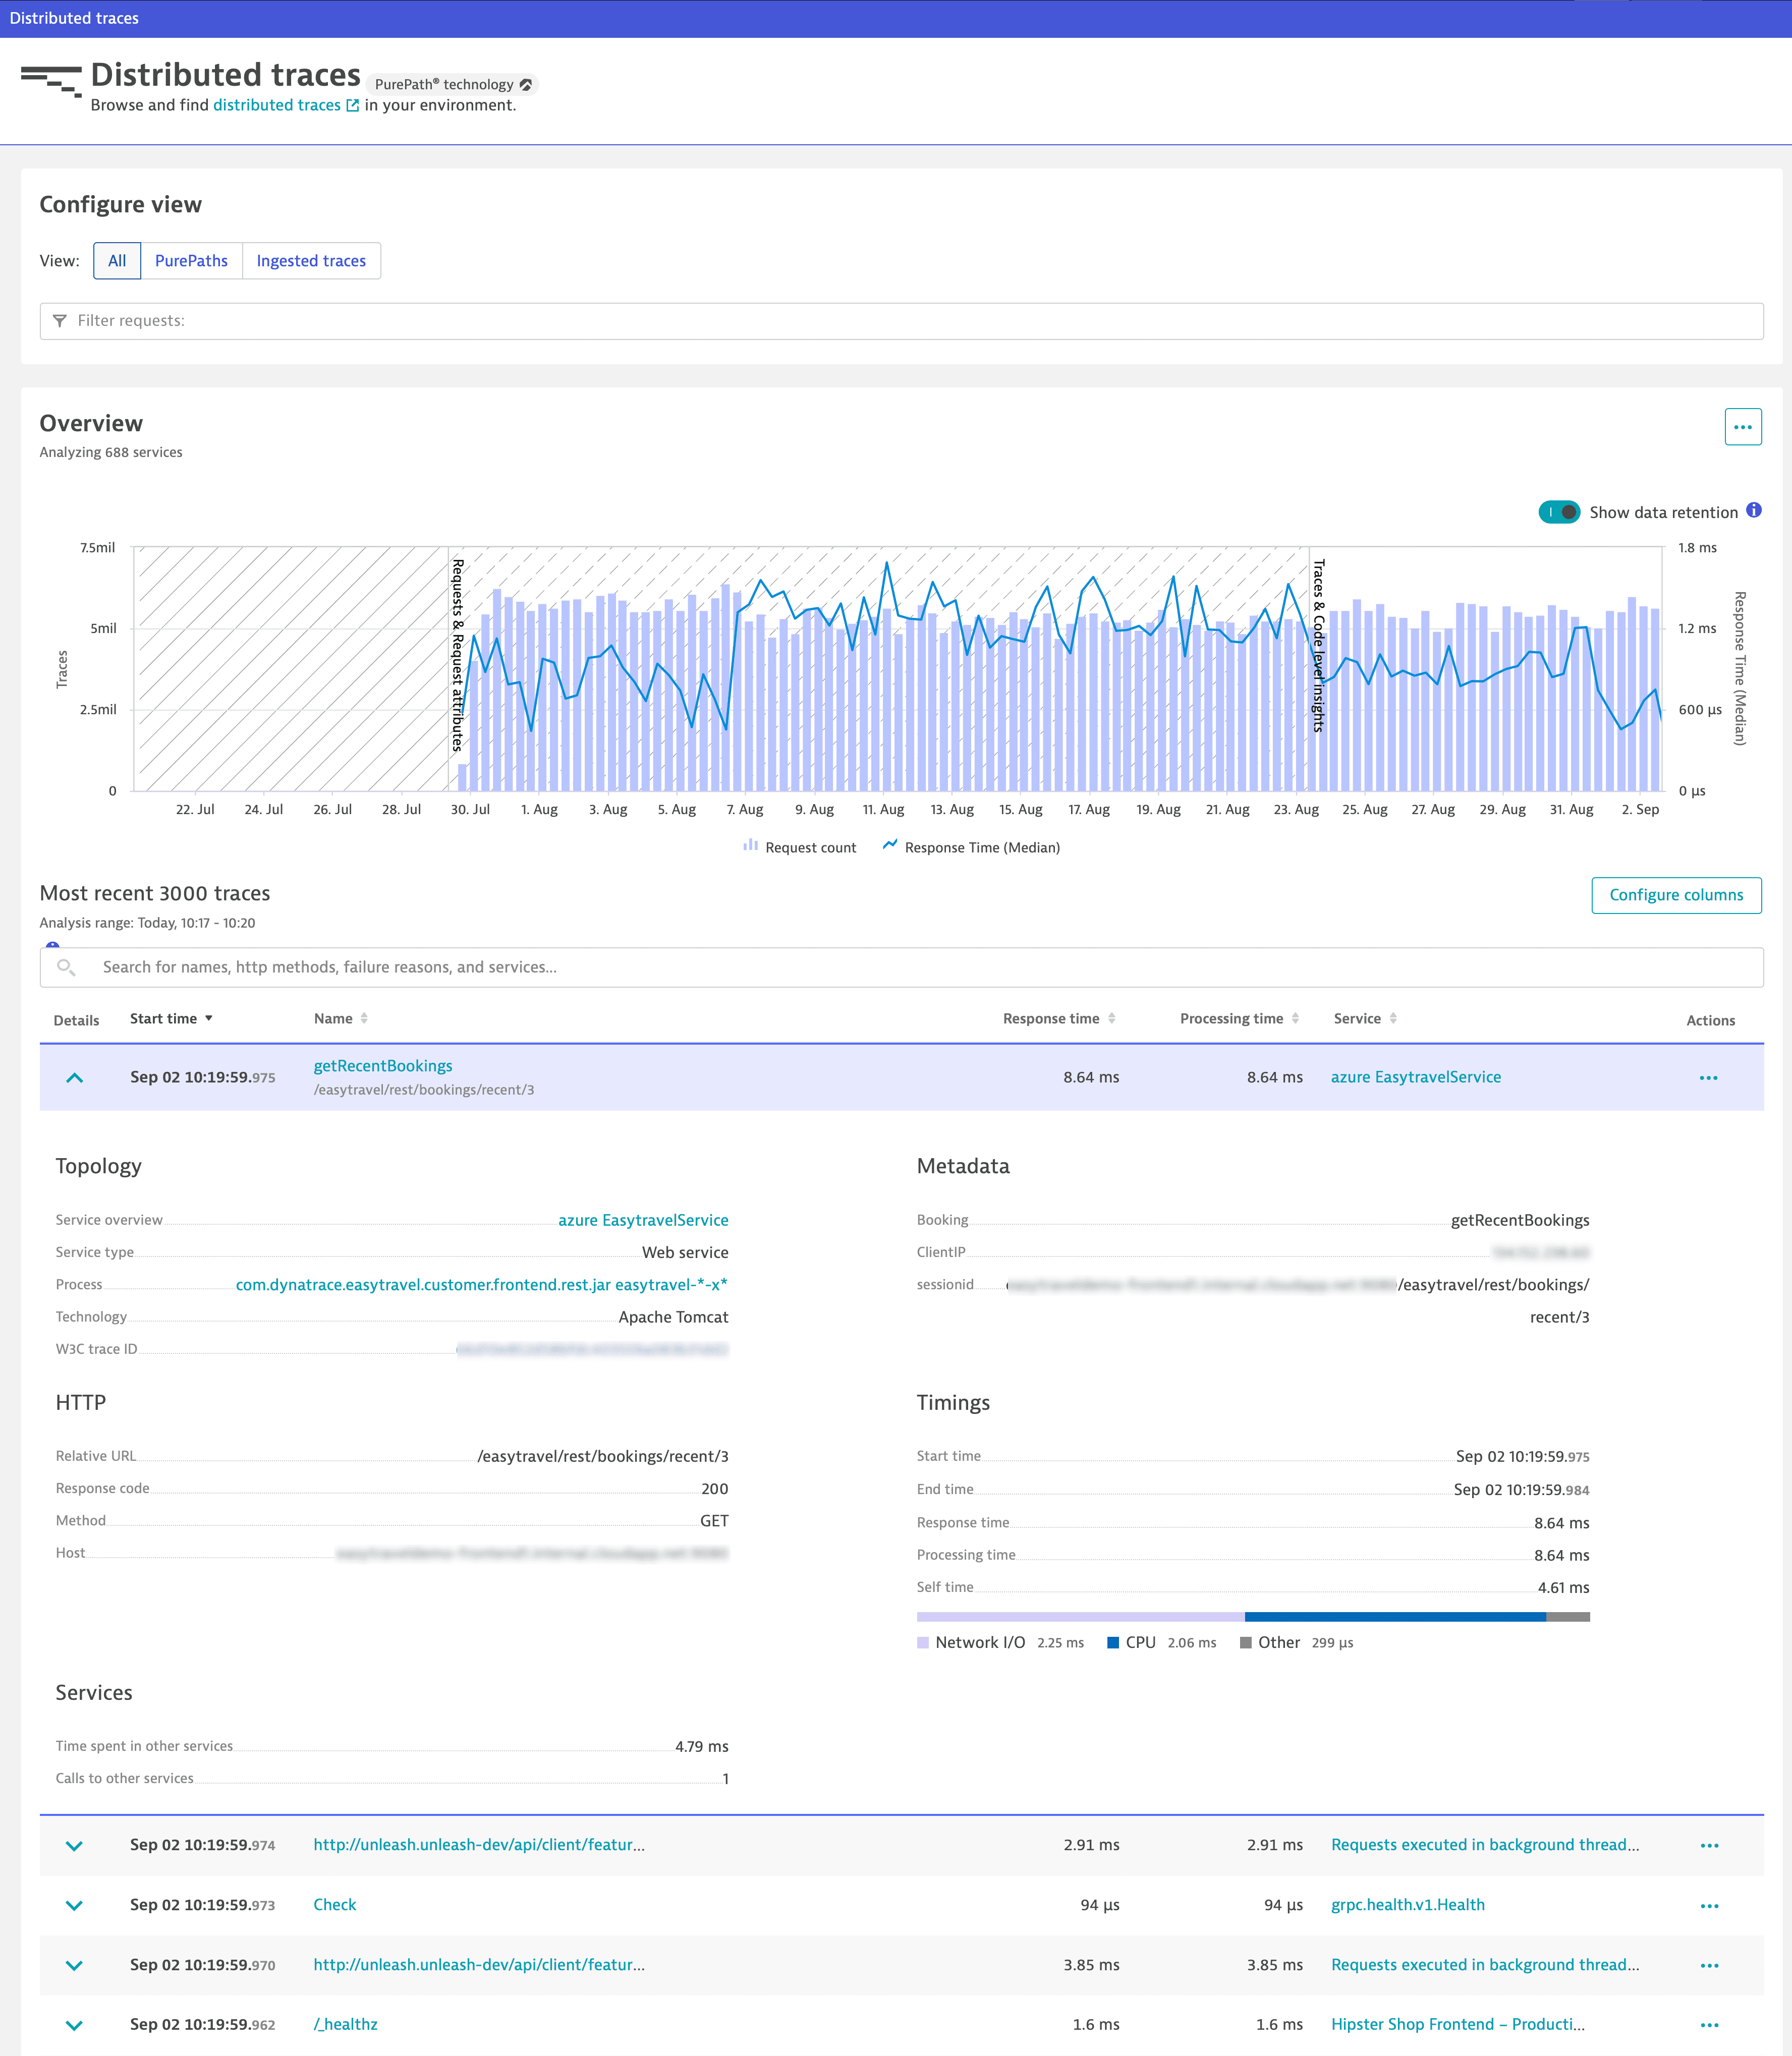
The Distributed traces page provides you with an overview of all distributed traces:
-
Of your environment, across all services
Go to Distributed Traces. Depending on the timeframe, the global distributed traces list highlights the most important node for the trace. -
Of a specific service
To access the service-specific distributed trace list, go to Services. In the Actions column for the service you want to analyze, open the menu and select Distributed traces.
The Distributed traces page displays PurePath® distributed traces captured by OneAgent and ingested OpenTelemetry traces. To focus the page, set filters in the Configure view section.
The table view lists up to 3,000 traces that are captured during the selected timeframe and within the selected management zone. If your environment generates more than 3,000 traces, you can apply filters.
- Select the Filter request field to list the available filtering options.
Select one or more filters. The view updates automatically as you apply filter criteria.
Chart
The chart shows the request count and response time over the selected timeframe.
The blue bar above the chart shows you which timeframe is actually covered by the displayed distributed traces.
- For quick access to multidimensional analysis views, select More (…) in the top-right corner.
- The chart uses trace and request data, which has different data retention periods. For timeframes containing data older than 10 days, you can turn on the Show data retention toggle to better understand which data is available for which period directly from the chart.
Table
The table lists the 3,000 most recent distributed traces.
-
To filter the table, use the search input field above the table to search for names and services. The table updates automatically as you type your search string.
When searching for a specific node, you can filter the table for the trace ID and find the desired node in the call tree of the entire trace.
-
To display an overview of a distributed trace, select the expand button in the Details column.
-
To switch to a detailed analysis, select the specific distributed trace in the Name column.
-
To list all distributed traces of a service, select the service in the Service column.
-
For quick access to further analysis options, select More (…) in the Actions column.
Export data
To export the data in a comma-separated values (CSV) file
-
In the lower-right corner of the page, select Show export menu
.
-
Select Export visible data or Export table data.
| Option | Exported data | Fields | Number of entries |
|---|---|---|---|
Export visible data | The currently displayed area of the table, taking into account applied filters | Only visible data | Up to 50 traces |
Export table data | All table data, including traces that are not displayed on the current table page | All the available data related to distributed traces | All 3,000 most recent entries |