Timestamp configuration
Dynatrace version 1.252+ OneAgent version 1.247+
Dynatrace allows you to define rules that control log data timestamps.
Timestamp detection
By default, log monitoring automatically detects only the most common and unambiguous subset of date formats supported. For details, see Supported timestamp formats.
No timestamp detected
When Log Monitoring is unable to determine the time format, it treats each log line as a separate log entry with an automatically assigned timestamp (observation timestamp) using a one-minute time resolution, except for lines starting with whitespaces (space, tab), which are treated as a continuation of an entry.
Timestamp search limit
Regardless of format, the timestamp typically occurs within the first 64 characters of a log entry. However, the timestamp can occur elsewhere, in which case you can raise this limit on the OneAgent configuration page: Log Monitoring > Timestamp/Splitting patterns.
Timestamp rules
Regardless of where it occurs in a log entry, a timestamp may be written in multiple formats. Dynatrace supports some timestamp formats by default, but sometimes multiple formats may fit the incoming log data and match the timestamp to an incorrect timestamp pattern.
Because of this, Log Monitoring also enables you to define a specific date format using timestamp rules that specify what should be considered a timestamp in a log record. These rules contain a timestamp pattern, time zone, and matchers.
- Pattern—Defines what should be considered a timestamp in your logline.
- Timestamp search limit—specifies the count of characters in each log line, measured from the beginning of the line, where the timestamp is searched.
- Time zone—Defines the timestamp time zone. Optional if your timestamp pattern includes the timezone indicator (
%z). - Matcher—Narrows down the range for the rule and applies the timestamp pattern only to matched log entries. Because you can't use the
log.contentattribute in the timestamp pattern matchers, the highest granularity is a log source. Granularity is at this level because the timestamp pattern is used to split the contents of a log source into separate log records, so it is used before thelog.contentattribute's value (or any other attributes set on an individual log record's level) is determined.If you create multiple rules matching the same log data, all defined time formats are searched for.
If you have at least one rule matching a given log, predefined formats are not applied to it.
Supported scopes
Three hierarchy scopes are supported: host, host group, and environment.
The hierarchy scopes are merged into one list in the following order:
Host rules
Host group rules
Environment rules
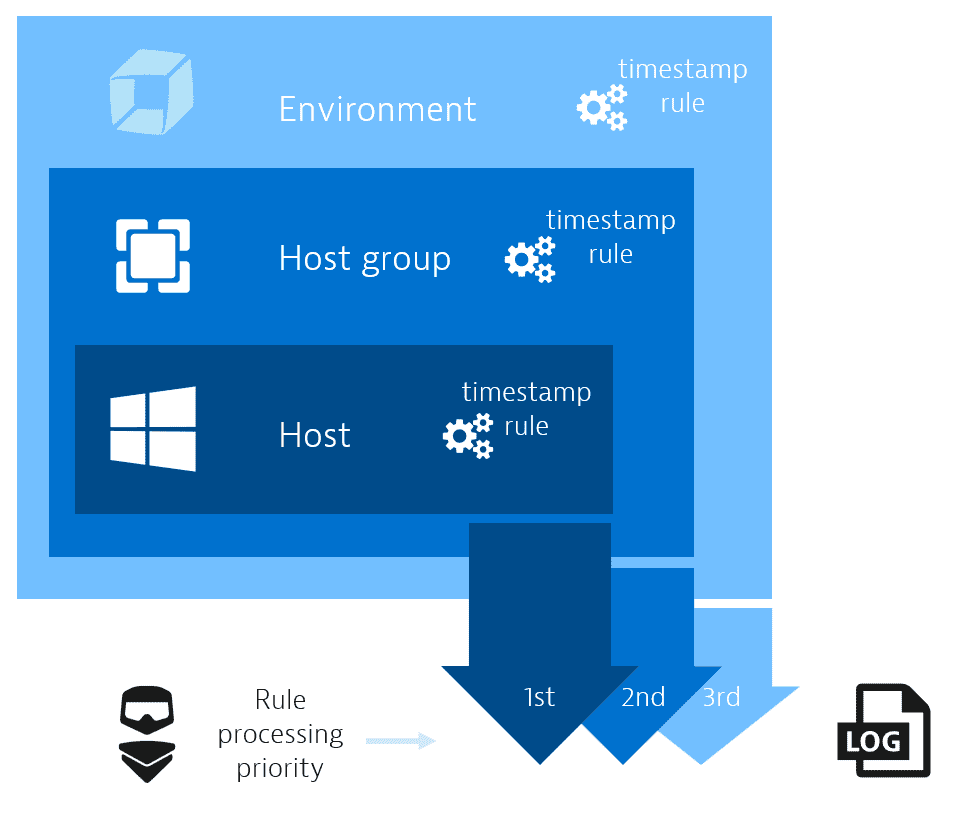
The OneAgent receives the merged list (merged lists from its respective hosts, host groups, and environments) with no indication of which scopes are defined.
Host scope
The host scope can be accessed through the Host settings for a specific host.
- Go to Hosts or Hosts Classic (latest Dynatrace).
Find and select your host to display the host overview page.
- In the upper-right corner of the host overview page, select More (…) > Settings.
- In the host settings, select Log Monitoring > Timestamp/Splitting patterns.
Configure data masking by adding rules with a set of matchers that specify what should be considered a timestamp in the log record.
Host group scope
The host group scope can be accessed via the Host page.
- Go to Hosts or Hosts Classic (latest Dynatrace) and select the host that interests you.
- On the host overview page, select Properties and tags.
- On the Properties and tags panel, find the Host group property to see the name of the host group to which the selected host belongs.
The Host group property is not displayed when the selected host doesn't belong to any host group.
- Select the host group name to list all hosts in that host group. This displays the OneAgent deployment page filtered by the selected host group. Each listed host has a Host group:
<group name>link, where<group name>is the name of the host group that you want to configure. Select the host group name in any row.
- In the host group settings, select Log Monitoring > Timestamp/Splitting patterns.
Configure data masking by adding rules with a set of matchers that specify what should be considered a timestamp in the log record.
Environment scope
The environment scope is available in the settings menu.
- Go to Settings and select Log Monitoring > Timestamp/Splitting patterns.
Configure data masking by adding rules with a set of matchers that identify your sensitive data.
Create rule
To add a rule (on the host, host group, or environment level) that interprets the incoming log data timestamps
-
Select Add rule to start configuring your rule.
-
Rule name
The name to display for your configuration. -
Pattern
Enter the pattern to be read as a date from the logs. For details on timestamp formats, see Supported timestamp formats and the following list of format specifiers.Pattern Description %!Matches the word boundary. It is any character that is not [0-9A-Za-z_] next to the characters from this group.
%%Matches
%character.%^Matches the beginning of the line.
%AEquivalent to
%a.%aThe locale's full or abbreviated case-insensitive weekday name.
%BEquivalent to
%b.%bThe locale's full or abbreviated case-insensitive month name.
%CThe century as a decimal number. The modified command
%NC, whereNis a positive decimal integer, specifies the maximum number of characters to read. If not specified, the default is 2. Leading zeroes are permitted but not required.%DEquivalent to
%m/%d/%y.%dThe day of the month as a decimal number. The modified command
%Nd, whereNis a positive decimal integer, specifies the maximum number of characters to read. If not specified, the default is 2. Leading zeroes are permitted but not required.%eEquivalent to
%dand can be modified like%d.%FEquivalent to
%Y-%m-%d. If modified with width, the width is applied only to%Y.%GThe ISO week-based year as a decimal number. The modified command
%NG, whereNis a positive decimal integer, specifies the maximum number of characters to read. If not specified, the default is 4. Leading zeroes are permitted but not required.%gThe last two decimal digits of the ISO week-based year. The modified command
%Ng, whereNis a positive decimal integer, specifies the maximum number of characters to read. If not specified, the default is 2. Leading zeroes are permitted but not required.%hEquivalent to
%b.%HThe hour (24-hour clock) as a decimal number. The modified command
%NH, whereNis a positive decimal integer, specifies the maximum number of characters to read. If not specified, the default is 2. Leading zeroes are permitted but not required.%IThe hour (12-hour clock) as a decimal number. The modified command
%NI, whereNis a positive decimal integer, specifies the maximum number of characters to read. If not specified, the default is 2. Leading zeroes are permitted but not required.%jThe day of the year as a decimal number. January 1st is 1. The modified command
%Nj, whereNis a positive decimal integer, specifies the maximum number of characters to read. If not specified, the default is 3. Leading zeroes are permitted but not required.%MThe minutes as a decimal number. The modified command
%NM, whereNis a positive decimal integer, specifies the maximum number of characters to read. If not specified, the default is 2. Leading zeroes are permitted but not required.%mThe month as a decimal number. Jan is 1. The modified command
%Nm, whereNis a positive decimal integer, specifies the maximum number of characters to read. If not specified, the default is 2. Leading zeroes are permitted but not required.%nMatches one ' ' or '\t' white space character.
%oThe 13-digit Unix timestamp in milliseconds.
%pThe locale's equivalent of the AM/PM designations associated with a 12-hour clock. The command
%Imust precede%pin the format string.%REquivalent to
%H:%M.%SThe seconds as a decimal number. The modified command
%NS, whereNis a positive decimal integer, specifies the maximum number of characters to read. If not specified, the default is 2 if the input time has a precision convertible to seconds. Otherwise, the default width is determined by the decimal precision of the input, and the field is interpreted as a long double in a fixed format. The decimal point character should be one of the following:,,., or:. Leading zeroes are permitted but not required.%sThe 10-digit Unix timestamp in seconds.
%TEquivalent to
%H:%M:%S.%tMatches zero or more white space characters.
%uThe ISO weekday as a decimal number (1-7), where Monday is 1. The modified command
%Nu, whereNis a positive decimal integer, specifies the maximum number of characters to read. If not specified, the default is 1. Leading zeroes are permitted but not required.%UThe week number of the year as a decimal number. The first Sunday of the year is the first day of week 01. Days of the same year prior to that are in week 00. The modified command
%NU, whereNis a positive decimal integer, specifies the maximum number of characters to read. If not specified, the default is 2. Leading zeroes are permitted but not required.%VThe ISO week-based week number as a decimal number. The modified command
%NV, whereNis a positive decimal integer, specifies the maximum number of characters to read. If not specified, the default is 2. Leading zeroes are permitted but not required.%WThe week number of the year as a decimal number. The first Monday of the year is the first day of week 01. Days of the same year prior to that are in week 00. The modified command
%NW, whereNis a positive decimal integer, specifies the maximum number of characters to read. If not specified, the default is 2. Leading zeroes are permitted but not required.%wThe weekday as a decimal number (0-6), where Sunday is 0. The modified command
%Nw, whereNis a positive decimal integer, specifies the maximum number of characters to read. If not specified, the default is 1. Leading zeroes are permitted but not required.%yThe last two decimal digits of the year. If the century is not otherwise specified (for example, with
%C), values in the range [69 - 99] are presumed to refer to the years [1969 - 1999], and values in the range [00 - 68] are presumed to refer to the years [2000 - 2068]. The modified command%Ny, whereNis a positive decimal integer, specifies the maximum number of characters to read. If not specified, the default is 2. Leading zeroes are permitted but not required.%YThe year as a decimal number. The modified command
%NY, whereNis a positive decimal integer, specifies the maximum number of characters to read. If not specified, the default is 4. Leading zeroes are permitted but not required.%zThe offset from UTC in the format [+|-]h[h][mm|:mm]. For example, -0430 refers to 4 hours and 30 minutes behind UTC, +4:30 refers to 4 hours and 30 minutes ahead of UTC, and 04 refers to 4 hours ahead of UTC.
%ZThe time zone abbreviation or name. A single word is parsed. This word can only contain characters that are alphanumeric or one of
_,/,-,+.You need to specify at least the month, day, hours, minutes, and seconds, although you can use alternative formats for them. You can include the time zone indicator (
%z) or specify the time zone separately in the rule definition. -
Timestamp search limit
Use this field to define the number of characters in every log line where timestamp is searched. If you want to ignore timestamps and split logs using the default rules, set this value to
0. Use this field to overwrite the global timestamp search limit (default 64 bytes). -
Time zone
Select the time zone to apply to this pattern.
This setting is not enabled if you have already specified the timezone in the timestamp pattern (%z).You can select
Local time zoneto use the time zone of the host on which the OneAgent is running. -
Select Add matcher to create a specific match for this rule and narrow down the scope for that rule.
You can include multiple matchers in one rule. For example, the timestamp configuration rule can be applied to logs from a specific container, namespace, or log source. Multiple matchers with the same attribute use AND logic between matchers, while matchers with multiple values assigned to them use OR logic.
Matcher attribute Matching is based on Process group
The process group ID.
Log source
A log path; wildcards are supported in form of an asterisk.
K8s container name
The name of the Kubernetes container.
K8s namespace name
The name of the Kubernetes namespace.
K8s deployment name
The name of the Kubernetes deployment.
Container name
The name of the container.
DT entity container group ID
The DT entity container group ID.
Process technology
The technology name.
-
Select the matching attribute.
-
Select Value and, from the Value list, select the detected log data items.
You can add multiple values to the selected attribute. You can have one matcher that indicates the
Log sourceand matches values/var/log/syslogandWindows Application Log. Use asterisks (*) as wildcards to get a partial match. -
Select Save changes.
Rules are executed in the order in which they appear on the Timestamp/Splitting patterns page.
When you change the rule order (to change the order in which they are executed), allow for two or three minutes of propagation time between when you save the change and when the change takes effect.
Starting with OneAgent version 1.249, you can activate/inactivate your rules by turning on/off the Active toggle. To manage your rules effectively, we recommend that you upgrade your OneAgent to version 1.249. If you have any rules set on the host with OneAgent version earlier than 249, you will not be able to inactivate them, in which case you need to remove such rules by selecting Delete on the rule level or via the REST API.
Rules are executed in the order in which they appear on the Timestamp/Splitting patterns page.
REST API
You can use the Settings API to manage your timestamp configuration:
View schema
List stored configuration objects
View single configuration object
Create new, edit, or remove existing configuration object
To check the current schema version for timestamp configuration, list all available schemas and look for the builtin:logmonitoring.timestamp-configuration schema identifier.
Timestamp configuration objects are available for configuration on the following scopes:
environment—configuration object affects all hosts in a given environment.host_group—configuration object affects all hosts assigned to a given host group.host—configuration object affects only the given host.
To create a timestamp configuration using the API
-
Create an access token with the Write settings (
settings.write) and Read settings (settings.read) permissions. -
Use the GET a schema endpoint to learn the JSON format required to post your configuration. The timestamp configuration schema identifier (
schemaId) isbuiltin:logmonitoring.timestamp-configuration. Here is an example JSON payload with the timestamp configuration:[{"insertAfter":"uAAZ0ZW5hbnQABnRlbmFudAAkMGUzYmY2ZmYtMDc2ZC0zNzFmLhXaq0","schemaId": "builtin:logmonitoring.timestamp-configuration","schemaVersion": "0.1.0","scope": "tenant","value": {"config-item-title": "Added from REST API","date-time-pattern": "%Y-%m-%d %H:%M:%S","timezone": "CET","matchers": [{"attribute": "dt.entity.process_group","operator": "MATCHES","values": ["PROCESS_GROUP-05F00CBACF39EBD1"]},{"attribute": "log.source","operator": "MATCHES","values": ["Windows System Log","Windows Security Log"]}]}}] -
Use the POST an object endpoint to send your configuration.