Impact analysis
Each problem overview page contains impact analysis of all direct consequences of the problem (for example, the slowdown of a service) that are revealed based on automated and multidimensional performance baselining.
While baseline violations serve as great trigger events for initiating deeper problem analysis, not all real user impact can be detected based solely on statistical alerts. This is why many (but not all) problems discovered by the Davis® AI causation engine provide an Impact analysis and a Business impact analysis section that show you the impact that the problem has had on your customers and service calls.
Impact analysis
Impact analysis lists your applications, services, and other entities affected by the problem.
These entities appear in the Impact analysis section even if your applications and entry-point services handled these issues gracefully, highlighting the problem and bringing it to your attention.
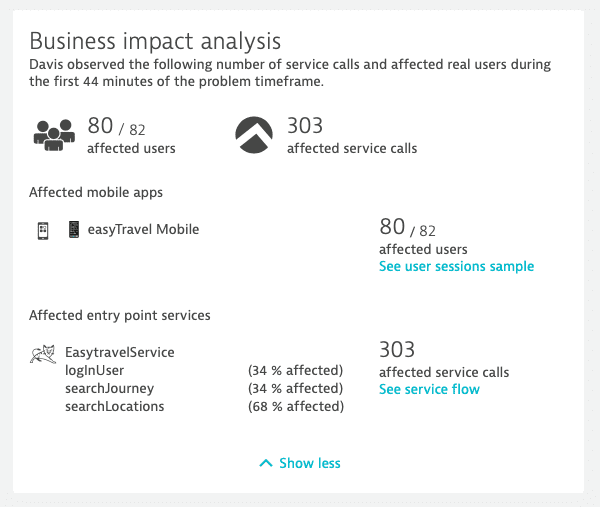
Business impact analysis
Business impact analysis is only relevant for customer-facing applications (for example, a website or mobile app) or entry-point services (for example, a stock price widget in a news outlet). Therefore, the Business impact analysis pane is only displayed when relevant transactions are available.
Business impact analysis isn’t triggered for all detected problems. For example, it isn’t included for problems that are detected with synthetic tests, as the result would be only a single transaction. It is also not included for infrastructure-only events, such as CPU spikes, because no relevant transactions exist for analysis.
Business impact analysis provides you a quick insight into the scale of the problem, allowing you, for example, to distinguish problems that only affect a small number of users from those that affect hundreds or thousands. It also helps in uncovering problems that would otherwise be impossible to detect based on statistical evidence alone (for example, customers being unable to sign in to your application).
Example of an impact analysis
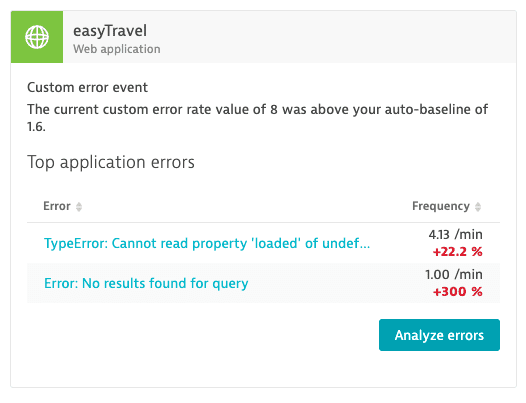
The example below shows a problem caused by response time degradation and failure rate increase.
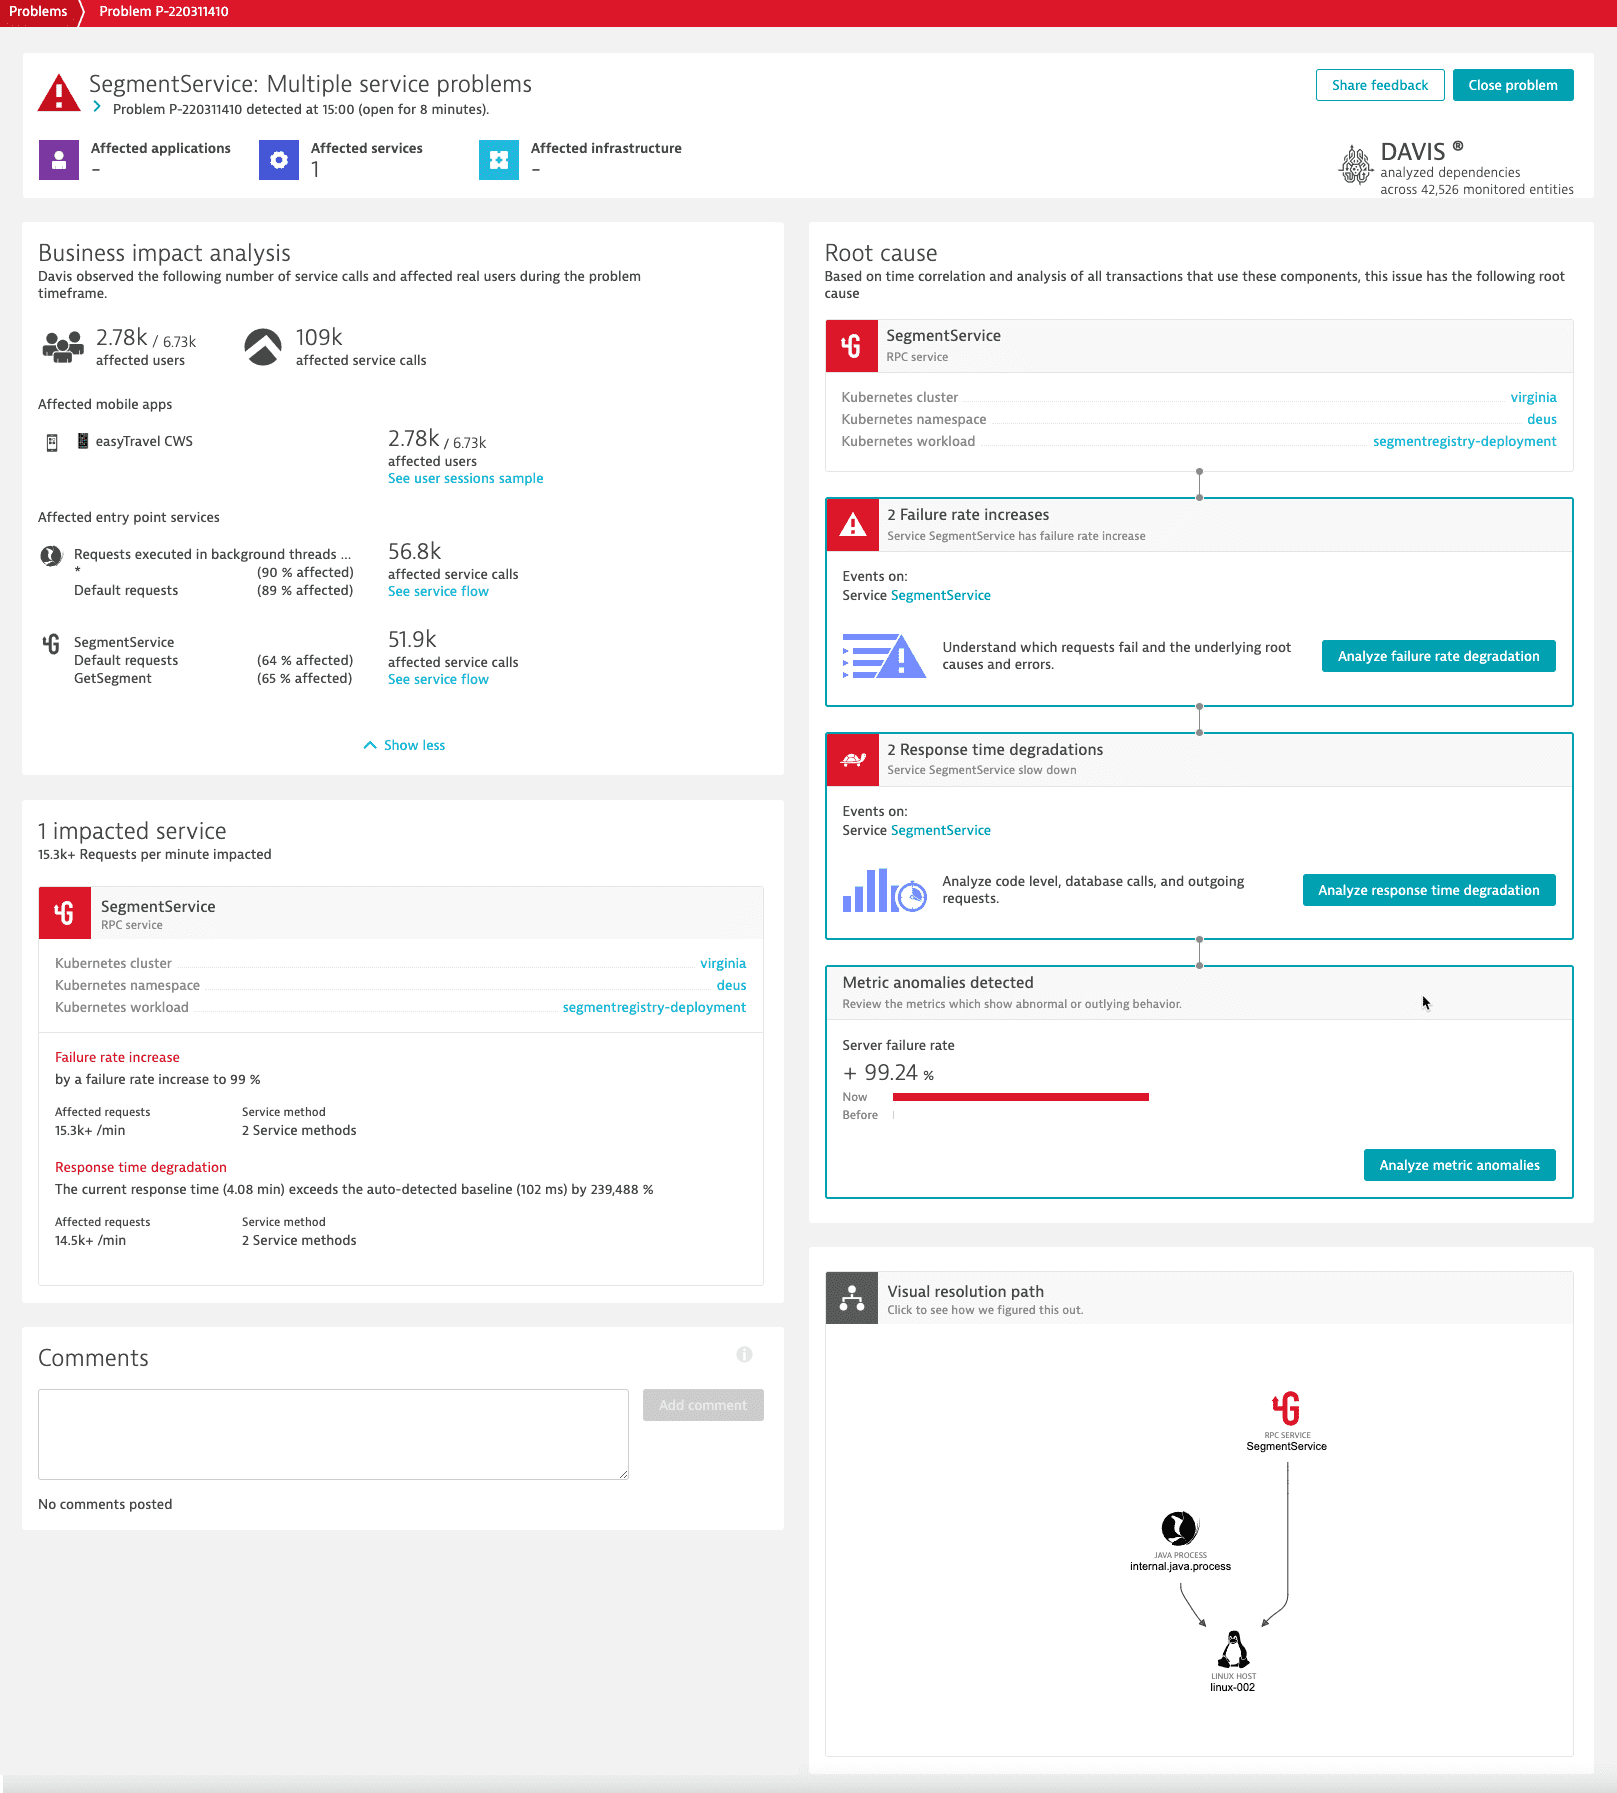
The Business impact analysis tile shows that there's one affected mobile app (easyTravel CWS) and there are real users who have faced the problem. The example above shows a business impact on 2,780 out of 6,730 users who are affected—more than 40%. To analyze affected user sessions, select See user sessions sample. To learn more about this analysis, see User session analysis.
Moving on from the business impact, the 1 impact service tile shows that the problem also affects a service—SegmentService, resulting in a 99% failure rate increase as well as a massive response time degradation of 239,444%. From here, you can proceed to further analysis of the root cause by selecting the appropriate tiles in the Root cause section.