Metrics browser
Early Adopter
Go to Metrics to open the Metrics browser, which is a cool tool for browsing all metrics available in your monitoring environment and making a quick metric-specific visualization.
- Dashboards Classic: You can pin the visualization to a classic dashboard.
Filter and sort the table
- By default, the table of metrics is filtered to show only those metrics that were last reported after the start of the selected timeframe (for example,
Last 2 hours). Turn off Only show metrics reported after the start of the selected timeframe to see all metrics regardless of when they were last reported. - Set Favorites to
Any,Yes, orNoto filter the table by metrics that you have favorited.- To favorite a metric, select the star in the Favorite column of the table. Favorited metrics sort to the top of the table by default.
To unfavorite a metric, select the star again.
- The filter bar (Filtered by) has the following options.
-
Text—SelectText, enter a filter string, and then press Enter to list metrics that include the string in Metric name, Metric key, or Description. -
Tag—SelectTag, enter a filter string, and then select a matching tag to list metrics that include the tag in Tags. -
Unit—SelectUnit, enter a filter string, and then select a matching metric unit (for example,Percent) to list metrics that have the selected Unit. -
Favorites—SelectFavoritesand then selectYes(to list only favorited metrics) orNo(to list only metrics that are not favorited). -
Dimension—SelectDimension, enter a filter string, and then select a matching metric dimension (for example,Host) to list metrics that have the selected dimension.If you combine filters, they are ANDed together. For example, if you set
DimensiontoHostand setTexttousage, the metrics browser lists all metrics with theHostdimension that also include the stringusagein the Metric name, Metric key, or Description field.
-
- Select column header Favorite, Name, or Key to sort by the selected column.
- Select
 in the Details column to display metric details.
Review metric details
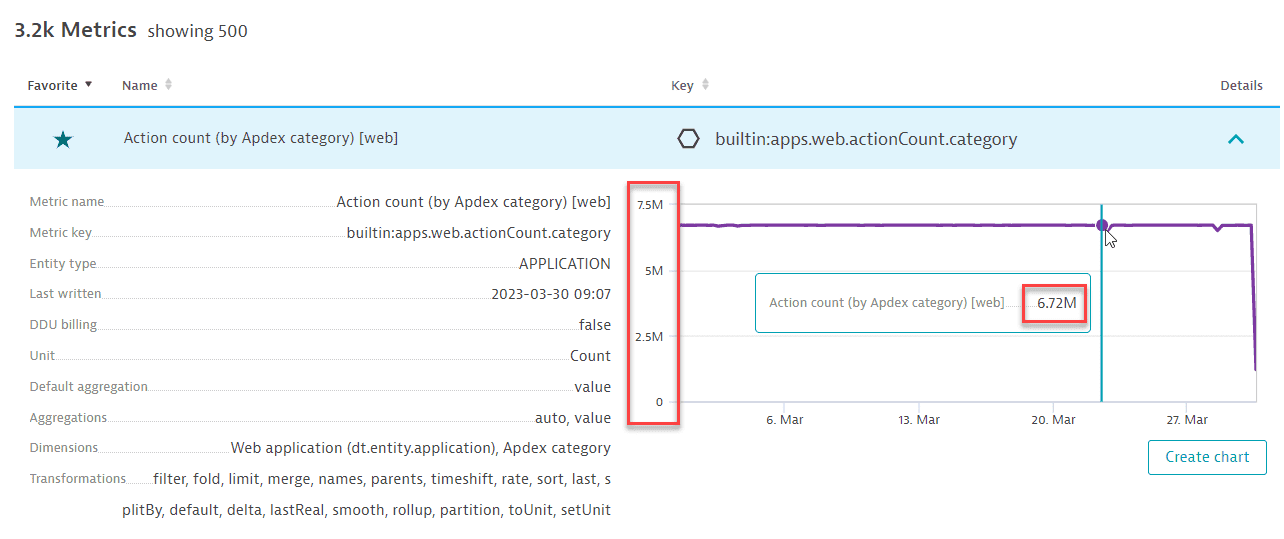
Expand Details for any metric (row) in the table to see metric details and a visualization of the metric over the selected timeframe.
| Field | Description |
|---|---|
Metric name | The name of the metric in the user interface. |
Metric key | The fully qualified key of the metric. If a transformation has been used, it is reflected in the metric key. |
Entity type | Entity type for this metric. |
Description | A short description of the metric. |
Tags | Tags allow further grouping of metrics. |
Created | The timestamp when the metric was created. |
Last written | The timestamp when the metric was last written. |
DDU billing | Whether the metric is subject to Davis data unit (DDU) consumption. |
Unit | The unit of the metric. |
Minimum value | The known lower boundary value for the metric. |
Maximum value | The known upper boundary value for the metric. |
Default aggregation | The default aggregation for this metric. |
Aggregations | The list of allowed aggregations for this metric. |
Dimensions | The fine metric division (for example, process group and process ID for a process-related metric). |
Transformations | Possible transform operators. |
Order-of-magnitude notation
In this example, you can see values displayed in millions. This is order-of-magnitude notation (7.5M means "about 7.5 million" and not "exactly 7.5 million").
The order of magnitude here is selected automatically based on the size of the values. For example, the same metric measured over a shorter timeframe might be displayed in k values instead of M.
Examples of order-of-magnitude notation in Dynatrace:
| Notation | Factor | Meaning |
|---|---|---|
k | 10^3 | kilo, thousand |
M | 10^6 | mega, million |
G | 10^9 | giga, billion |
T | 10^12 | tera, trillion |
For details, see Order-of-magnitude notation.
Add metric to dashboard
To add a metric to a classic dashboard
- Select in the Details column to display metric details.
- Select Create chart to open the metric in Data Explorer.
- Adjust the query and visualization settings as needed. For details, see Data Explorer or Data Explorer quick start.
- Select Pin to dashboard.
Specify the target dashboard and metric title.
- Select Pin.
Metadata for custom metrics
To provide contextual information for custom metrics (for example, to define the unit of measurement, or to provide display names or descriptions or even information such as lower and upper value ranges or Davis-relevant information), you can create metric metadata per metric key.
Once this information is provided, it becomes part of the metrics descriptor and can be queried via the API and used in the Metrics Browser and Data Explorer.
Providing metadata via Settings 2.0 is available only for custom/schemaless metrics, not for built-in/code-registered metrics.
The metadata provided for a specific metric key exists side-by-side with the metric time series itself. You can even create the metric metadata before you ingest datapoints for the first time.
Configuration via API
Metric metadata is fully configurable via API. For details, see Custom metric metadata.
Configuration via web UI
To configure metric metadata for custom metrics via the web UI
- Go to Metrics.
- Select in the Details column to display metric details.
- Select Edit metadata.
If you don't see an Edit metadata button in the expanded row, you haven't selected a custom metric. - On the Metric metadata page, edit the metadata for the selected metric.
If the page displays a lock, you don't have the necessary write permissions to edit the selected metric's metadata.- Display name—Enter a human-friendly name for the metric.
- Description—Enter a free-form description of the metric: how it is measured, etc.
- Unit—Select a unit from the list.
- Metric properties
- Minimum value—The lower boundary of the metric.
- Maximum value—The upper boundary of the metric.
- Root cause relevant—A root-cause relevant metric represents a strong indicator for a faulty component.
- Impact relevant—An impact-relevant metric is highly dependent on other metrics and changes because an underlying root-cause metric has changed.
- Value type—The type of the metric's value. You have these options:
score: A score metric is a metric where high values indicate a good situation, while low values indicate trouble. An example of such a metric is a success rate.error: An error metric is a metric where high values indicate trouble, while low values indicate a good situation. An example of such a metric is an error count.
- Latency—The latency of the metric, in minutes. It indicates how long it takes before an ingested new metric data point is available in Dynatrace.
- Metric dimensions—To add a dimension, select Add dimension and enter the Dimension key and Display name for the dimension.
- Tags—To add a tag, select Add tag and enter the tag.
- Source entity type—To configure the entity type of the metric. Only editable if the metric is ingested via an API endpoint.
- Select Save changes to save your edits.