Create remote/multi-environment Dynatrace dashboards
The dashboards discussed here are classic dashboards created using the dashboarding functionality integrated with previous Dynatrace.
- For more about classic dashboards, see Dashboards Classic.
- For more about dashboards created with the Dashboards app in the latest Dynatrace, see Dashboards.
- To improve your dashboard experience, you can upgrade existing dashboards from Dashboards Classic to the Dashboards app in the latest Dynatrace.
A Dynatrace dashboard can include monitoring artifacts (such as metrics, logs, events, user sessions, and server-side traces) from multiple Dynatrace environments and can even support remote management zones (for tiles that support custom management zones).
Overview
Advantages
Dynatrace dashboards serve as a single pane of glass for monitoring artifacts such as metrics, logs, events, and user sessions. With multi-environment dashboards, your dashboards can combine these monitoring artifacts from separate Dynatrace environments.
After you configure the remote connection in your local Dynatrace environment, you can quickly point dashboard tiles to the remote environment.
For tiles that allow a custom management zone (look for the Custom management zone setting in the configuration panel for the tile), you can specify another management zone.
Because the remote-environment capabilities of dashboard tiles allow you to build a common overview of problems and other data, dashboards can essentially serve as a hub for deeper analysis. A single click on any given dashboard tile displaying remote information takes you straight into a dedicated view of the remote environment where you can continue your analysis.
Limitations
-
A remote environment tile is backward compatible for up to five versions.
-
A remote environment tile running in a Dynatrace version x environment will work correctly with Dynatrace version x-5 or later deployed in the remote environment.
When there's a difference of more than five versions between the local and remote versions, the tile may still work but that configuration is not supported.
-
A remote environment tile displays data based on the features included in the remote environment's cluster version.
For example, if a remote environment tile depends on a feature that was added in Dynatrace version x, and that version is deployed locally, but the remote environment is still running Dynatrace version x-1, the feature won't be displayed in the local dashboard because the remote environment doesn't support it.
If a remote environment tile depends on a feature that is not supported in the remote environment, the tile displays an error message explaining the discrepancy between the local and remote environments.
-
To maintain maximum compatibility between local and remote environments, keep your Dynatrace environments on the same version.
-
-
Remote-environment connections don’t pass user context and permissions over environment boundaries.
For this reason, the best practice is to use management zones to segment/limit dashboard tiles when viewing remote information.
Because of the above consideration, remote-environment dashboards can be configured only by environment administrators. Regular users can still view and interact with remote-environment dashboards without limitation.
-
The world map dashboard tile isn’t suited for (and therefore doesn’t support) remote-environment scenarios.
Configuration
To create a dashboard tile that queries data from a remote environment:
- In the remote Dynatrace environment, create an access token that permits you to query data from that environment
- In the local Dynatrace environment, add the remote environment to the table of remote environments
- In the local Dynatrace environment, create one or more tiles that display remote data queried from the remote environment
The procedures that follow use the Dynatrace web UI. To carry out the equivalent tasks via API, see:
- Access tokens API—to create a token in the remote environment
- Remote environments API—to create a link to the remote environment from the local environment
- Dashboards API—to configure a dashboard with tiles that query the remote environment
Create an access token
With this procedure, you get two items that you need in the other steps:
An access token that gives you permission to pull data from a remote Dynatrace environment
The URI of the remote Dynatrace environment
To create an access token for the remote Dynatrace environment
- Sign in to the remote environment.
This is the environment from which you pull data.
If you can't sign in to the remote environment, someone with access to the remote environment can do this procedure for you.
- Go to Access Tokens.
- Select Generate new token.
Enter a token name.
- Find the Fetch data from a remote environment scope (
RestRequestForwarding) and select its checkbox. - Select Generate token.
This generates a token that gives your local environment permission to pull data from this remote environment. - Select Copy and then paste the token to a secure location.
It's a long string that you need to copy and paste back into Dynatrace later.
Add the remote environment
To add the remote Dynatrace environment to your list of available remote environments
-
Sign in to your local Dynatrace environment.
-
Go to Settings.
-
Select Integration > Remote environments.
-
Select Connect environment.
-
Define the remote environment from which your local environment pulls data, and then select Save changes.
-
Name is the name under which this environment will be listed in your local Dynatrace environment when you configure a tile to query this remote environment. This is freeform text. It doesn't affect the remote environment.
-
Remote environment URI
-
For Dynatrace SaaS, it needs to be in the following format:
https://<ENVIRONMENTID>.live.dynatrace.com/Replace
<ENVIRONMENTID>with your actual environment ID. -
For Dynatrace Managed, any URI is allowed.
-
-
Network scope
External: The remote environment is located in another network. Globally configured proxy settings are used if present. This is the default scope.Internal: The remote environment is located in the same network. Globally configured proxy settings are not used.Cluster: The remote environment is located in the same cluster. The request is made tolocalhost.
Dynatrace SaaS can only use the
Externalnetwork scope. -
Token is the token you generated in the previous procedure. It needs to include the Fetch data from a remote environment scope (
RestRequestForwarding). -
Test connection checks the connection from your local environment to the remote environment.
Be sure to get a
connection successfully establishedmessage before continuing.
-
Now that you have established a link to the remote environment, you can create dashboard tiles that query that environment.
Create a tile that displays remote data
To create a tile that pulls data from the remote environment
-
Display the dashboard that will display the tile.
-
Select Edit.
-
Select or add a tile on which you want to display data from the remote environment.
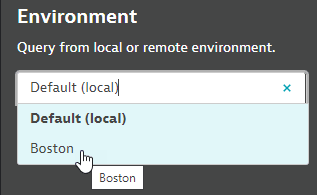
The Environment section of the tile settings pane displays the name of the environment from which that tile pulls monitoring data.- Default (local) configures the tile to pull its data from the local Dynatrace environment.
All other listed environments are remote environments for which a connection has been established.
-
Select the remote environment that you want the selected tile to query.
If you named the remote environmentBostonwhen you added the remote environment in the previous procedure,Bostonshould be on this list. -
Select Done to display the finished dashboard.
-
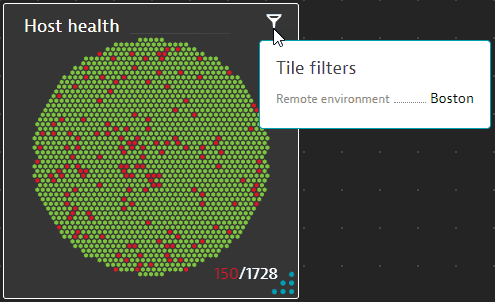
Hover over the tile filter icon to see the environment selection.
Examples
Same tiles, different environments
In this example, we create a dashboard that shows the host health and network status for the local environment and a remote environment side by side. We assume that you have already added the remote environment to your local environment.
-
Go to Dashboards or Dashboards Classic (latest Dynatrace), select Create dashboard, give it a name, and select Create.
-
Drag two Header tiles to the dashboard (or drag one and then clone it).
-
Edit one header to say Local and the other to say Remote.
-
Drag two Host health tiles to the dashboard (or drag one and then clone it).
Position one under the Local header and the other under the Remote header. -
Drag two Network status tiles to the dashboard (or drag one and then clone it).
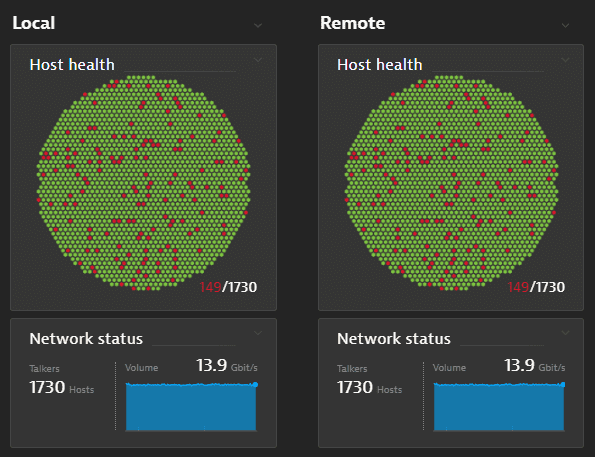
Position one under the Local header and the other under the Remote header.At this point, all of the tiles query the local environment, so you have two identical Host health tiles and two identical Network status tiles.
-
Under the Remote header, edit the Host health and Network status tiles so that both of them query the remote environment (
Bostonin this example). -
Select Done to display the dashboard.
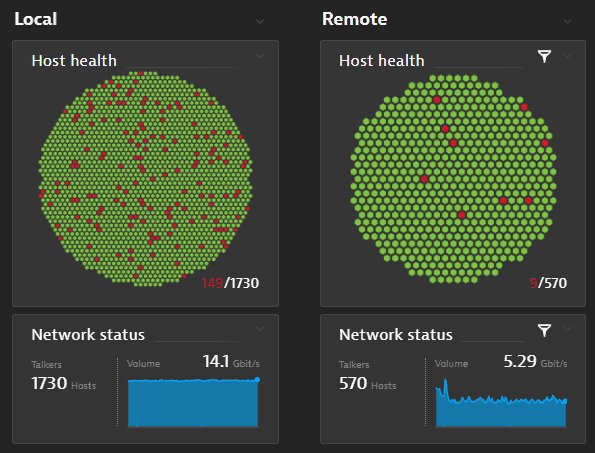
- The tiles under Local still display local host and network information.
- The tiles under Remote now query the remote environment:
The remote tiles display the host health and network status for the remote environment, not the default local environment.
The remote tiles each display a filter icon. Hover over the icon to see the environment name.
You can of course add other tile types and point to additional remote environments.