Diagnostic archives for Dynatrace Managed installations
When you run Dynatrace Managed cluster diagnostics, you have two analysis options:
- Analyze automatically: Dynatrace Managed gathers cluster diagnostics data and submits it automatically to Dynatrace so that Dynatrace product experts can use the data to analyze your support ticket quickly and efficiently.
- Collect and review locally: Dynatrace Managed gathers cluster diagnostics data, at which point you can analyze the data yourself and optionally attach it to a support ticket for review by Dynatrace product experts.
Analyze automatically
By default, Dynatrace collects diagnostics data for a cluster and immediately analyzes it.
If you prefer to collect and review the data before manually submitting it to Dynatrace for analysis, see Collect and review locally.
-
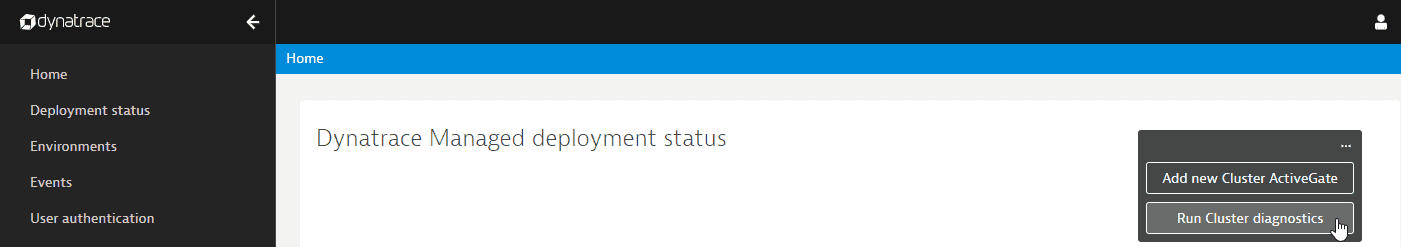
On the Dynatrace Managed Home page, select More (…) > Run Cluster diagnostics.
-
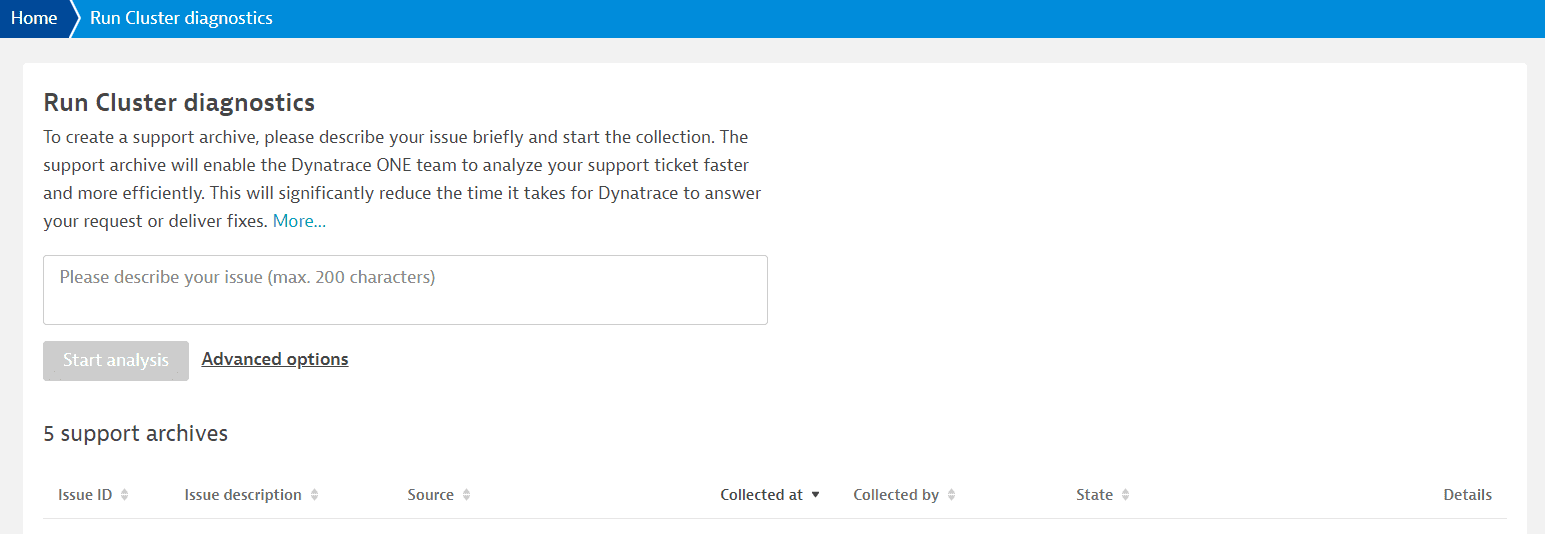
On the Run Cluster diagnostics page, briefly describe what isn’t working as expected from your point of view.
-
optional By default, 7 days of data is collected for analysis. If you need more data, select the Advanced options link, change the number of days, and select Apply.
-
Select Start analysis.
What happens next
Dynatrace does the following:
Collects diagnostic data for the last 7 days (if you didn't change the default) of the affected cluster nodes and ActiveGates
Stores the collected diagnostic data
Uploads the diagnostic data to Mission Control regional storage for further analysis
The State column describes the current phase of the process.
State does not automatically refresh. Select Refresh to check for a state change.
Data collection is in progress. While collecting data, you can:
- Refresh the page to update the progress.
- Cancel diagnostic data collection.
Dynatrace has finished collecting diagnostic data. After collecting data, you can:
- Analyze to submit the collected data to Dynatrace for analysis.
- Download the collected data locally for your inspection.
- Delete the issue, including the collected diagnostic data.
Diagnostic data is being transferred to Dynatrace for analysis. While sending data, you can:
- Refresh the page to update the progress.
- Download the collected diagnostic data.
- Delete the issue, including the collected diagnostic data.
Diagnostic data has been transferred to Dynatrace for analysis.
Dynatrace is now analyzing the diagnostic data.
While analyzing data, you can:
- Refresh the page to update the progress.
- Download the collected diagnostic data.
- Delete the issue, including the collected diagnostic data.
The analysis is done. The number of associated alerts is shown in parentheses.
After an analysis, you can:
- Download the collected diagnostic data.
- Delete the issue, including the collected diagnostic data.
The diagnostic data is being deleted. While deleting data, you can:
- Refresh the page to update the progress.
The diagnostic data has been deleted. Dynatrace keeps only a small set of information about who, when, where, and why the diagnostic data was collected.
The diagnostics process was canceled manually before it was finished.
Review the Dynatrace analysis
When the analysis is complete, Dynatrace sends the results back to your cluster. If a potential solution is identified, Dynatrace lists it in the Alerts section.
Collect and review locally
This procedure describes how to collect diagnostics data for a host or process locally. Use this option if you prefer to collect and review the data before manually submitting it to Dynatrace for analysis.
If you instead want to collect data and submit it to Dynatrace automatically for analysis, see Analyze automatically.
-
On the Dynatrace Managed Home page, select More (…) > Run Cluster diagnostics.
-
On the Run Cluster diagnostics page, briefly describe what isn’t working as expected from your point of view.
-
Select the Advanced options link.
-
Select and store locally.
- While you are here, you can also change the number of days of data to collect (default =
7 days).
- While you are here, you can also change the number of days of data to collect (default =
-
Select Apply.
-
Select Start collection to collect diagnostic data and store it locally.
What happens next
Dynatrace now:
Collects diagnostic data for the last 7 days (if you didn't change the default) of the affected cluster nodes and ActiveGates
Stores the collected diagnostic data
The State column describes the current phase of the process.
State does not automatically refresh. Select Refresh to check for a state change.
Data collection is in progress. While collecting data, you can:
- Refresh the page to update the progress.
- Cancel diagnostic data collection.
Dynatrace has finished collecting diagnostic data. After collecting data, you can:
- Analyze to submit the collected data to Dynatrace for analysis.
- Download the collected data locally for your inspection.
- Delete the issue, including the collected diagnostic data.
What to do with the collected data
Now that the data is collected, you can:
- Download the collected data.
- You can review the data. See Contents of diagnostic data for an overview of what's in the download.
You can add the data to your support ticket.
- Analyze the data.
- Delete the issue, including the collected diagnostic data.
Cluster diagnostics overview
For an overview of all cluster troubleshooting runs in your environment
- On the Dynatrace Managed Home page, select More (…) > Run Cluster diagnostics.
- The Run Cluster diagnostics page lists all diagnostics activity in your cluster.
Expand any entry to see details.
If the data has not been deleted (all diagnostic data is deleted automatically after 30 days), you can download it or delete it.
Contents of diagnostic data
All the collected diagnostic data is compressed into a SupportArchive<ID number> ZIP file that includes the following folders and files:
-
COLLECTOR(ActiveGates)
Contains a list of all ActiveGates for the cluster. Diagnostics data is located in a separate folder for each ActiveGate. The ActiveGate folders are named after the ActiveGate UUID. Each ActiveGate folder contains the following subfolders:Folder Description autoupdaterContains logs from the auto-update process.
configContains a snapshot of the ActiveGate configuration directory.
debuguiContains a snapshot of the internal environment configuration related to the ActiveGate.
installContains ActiveGate installation logs.
logContains a snapshot of the ActiveGate log directory).
-
SERVER(nodes)
Contains a list of all nodes in the cluster. Diagnostics data is located in a separate folder for node. The node folders are named after the unique node number. Each node folder contains the following subfolders:Folder Description autoupdaterContains logs from the auto-update process.
configContains configuration files of cluster nodes components.
logContains log files including audit logs of a server process.
managed-logsContains log files of other cluster node components grouped in a separate folders.
nginx-error-logsContains error logs from the NGINX server.
-
download details.txt(TXT)
Contains information and statistics about the diagnostic archive including file count and size for each folder.
Data privacy
To comply with regional data protection and privacy regulations, Dynatrace does the following:
Masks some personal data (for example, IBANs and URI credentials) automatically before storing it.
Automatically deletes all diagnostic data 30 days after its collection. This applies to the data in your Dynatrace environment and on the Dynatrace Cluster.
You can choose to delete collected diagnostic data earlier. To ensure transparency, Dynatrace keeps only a small set of information about who, when, where, and why the diagnostic data was collected.
For related details on Dynatrace data privacy, see:
Troubleshooting
If Dynatrace cannot collect diagnostic data within 20 minutes, it automatically tries again.
If the retry fails as well, we suggest that you contact a Dynatrace product expert via live chat.
State does not automatically refresh. Select Refresh to check for a state change.