Platform extensions (DPS)
Learn how consumption of Dynatrace platform extensions is calculated using the Dynatrace Platform Subscription model.
Custom Metrics Classic
You can extend the value of Dynatrace by defining, enabling or ingesting custom metrics. Dynatrace enables you to integrate third-party data sources, ingest custom metrics via API, leverage extensions, cloud integrations, and more.
Here is a non-exhaustive list of custom metric types:
Metrics ingested from Amazon CloudWatch, Azure Monitor, or Google Cloud Operations Cloud for Cloud services monitoring
Metrics ingested from remote extensions for monitoring of databases, network devices, queues, and more
All API-ingested metrics
Calculated service metrics, custom DEM metrics, and log metrics
The unit of measure for calculating custom metrics is a metric data point. A metric data point is a single measurement of a custom metric. Every metric data point that belongs to a custom metric consumes an additional metric data point whenever the metric is calculated.
To calculate your environment's custom metric consumption
In Dynatrace Hub, find the cloud service or extension you want to use (for example, Amazon S3, Azure Storage Account, Oracle Database, and F5).
Determine how many custom metrics Dynatrace ingests for the service or extension.
Determine the number of metric data points per custom metric.
Use the example below as a guide.
If you have a single custom metric that is written once per minute, annually you will consume 525.6 k metric data points:
1 metric data point × 60 min × 24 h × 365 days = 525.6k metric data points/year
Note that a single custom metric may have multiple dimensions. For example, if you have the same custom metric for 2 instances of your cloud service, you will consume 2 metric data points:
cloud.aws.dynamo.requests.latency, dt.entity.dynamo\_db\_table=DYNAMO\_DB\_TABLE-41043ED33F90F271 21.78cloud.aws.dynamo.requests.latency, dt.entity.dynamo\_db\_table=DYNAMO\_DB\_TABLE-707BF9DD5C975159 4.47
2 instances × 1 metric data point × 60 min × 24 h × 365 days = 1,051.2k metric data points/year
Metric data points are not billed based on the increase in dimensions, but rather by the increased number of metric data points. If dimensions are added, but the number of metric data points remains the same, then billable metric data points usage does not change:
cloud.aws.dynamo.requests.latency, dt.entity.dynamo\_db\_table=DYNAMO\_DB\_TABLE-41043ED33F90F271, Operation='DeleteItem' 21.78cloud.aws.dynamo.requests.latency, dt.entity.dynamo\_db\_table=DYNAMO\_DB\_TABLE- 707BF9DD5C975159, Operation='DeleteItem' 4.47
Therefore, in this case, the same number of metric data points is consumed as shown in the calculation above.
Consumption details: Custom Metrics Classic
Dynatrace provides built-in usage metrics that help you understand and analyze your organization's consumption of Custom Metrics Classic. To use them in Data Explorer, enter DPS into the Search field. These metrics are also available via the Environment API and linked in Account Management (Usage summary > Custom Metrics Classic > Actions > View details). The table below shows the list of metrics you can use to monitor your organization's consumption of Custom Metrics Classic.
- (DPS) Recorded metric data points per metric key
Key:
builtin:billing.custom_metrics_classic.raw.usage_by_metric_keyDimension:
metric_key\[STRING]Resolution: 1 min
Description: Number of consumed metric data points split by metric key.
- (DPS) Total billable metric data points
Key:
builtin:billing.custom_metrics_classic.usageDimension: count
Resolution: 15 min
Description: Total number of metric data points after deducting the included metric data points.
- (DPS) Total billable metric data points by other entities
Key:
builtin:billing.custom_metrics_classic.usage.otherDimension: count
Resolution: 15 min
Description: Number of billable metric data points that are not included with host monitoring.
- (DPS) Billable metric data points reported and split by other entities
Key:
builtin:billing.custom_metrics_classic.usage.other_by_entityDimension:
dt.entity.monitored_entity\[ME:MONITORED_ENTITY]Resolution: 15 min
Description: Number of billable metric data points split by entities that cannot be assigned to a host.
- (DPS) Total metric data points billable for Full-Stack monitored hosts
Key:
builtin:billing.custom_metrics_classic.usage.fullstack_hostsDimension: count
Resolution: 15 min
Description: The number of billable metric data points for Full-Stack monitored hosts.
- (DPS) Total metric data points billable for Infrastructure hosts
Key:
builtin:billing.custom_metrics_classic.usage.infrastructure_hostsDimension: count
Resolution: 15 min
Description: Number of billable metric data points for Infrastructure monitored hosts.
You can monitor the total number of billable metric data points for different intervals (15 min, hour, day, or week) for any selected timeframe using the metric (DPS) Total billed metric data points. The example below shows consumption aggregated in 1-hour intervals.
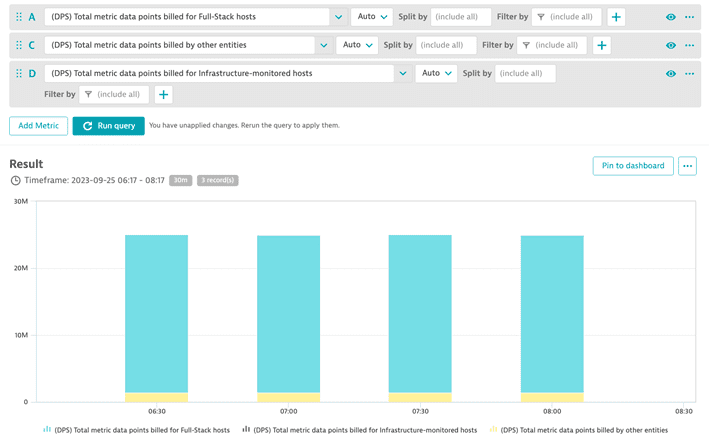
You can break down the total number of billable metric data points to monitor the number of metric data points consumed by Full-Stack monitored hosts, Infrastructure monitored hosts, and other entities. The following metrics can be used: (DPS) Total metric data points billed for Full-Stack hosts, (DPS) Total metric data points billed for Infrastructure hosts, and (DPS) Total metric data points billed by other entities.
The example below shows the number of billable metric data points consumed by all Full-Stack monitored hosts, Infrastructure monitored hosts, and other entities.
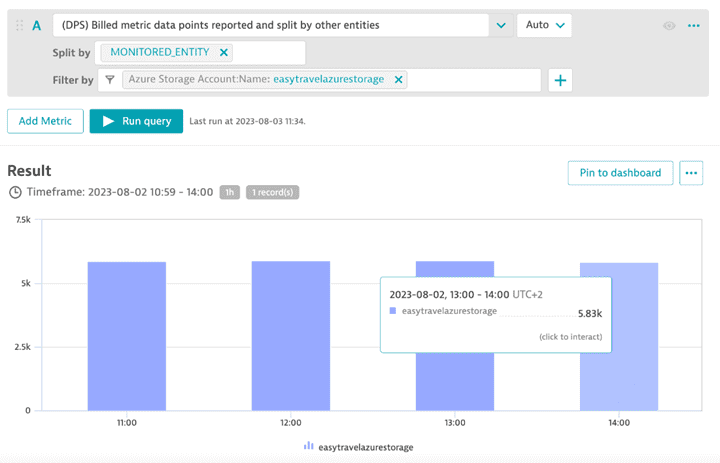
You can monitor the consumption of metric data points by any filtered entity using the metric (DPS) Billed metric data points reported and split by other entities. The example below shows the number of billable metric data points that come from an Azure Storage Account.
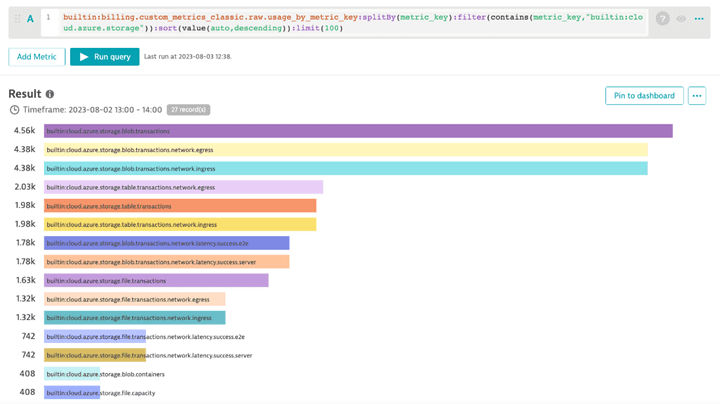
You can monitor metric data point consumption per metric keyusing the metric (DPS) Recorded metric data points per metric key. The example below lists the top metric keys for an Azure Storage Account, in descending order of consumption.
You can easily control billable metric data points for cloud services. You can identify which metric data points are the most valuable and disable those that are less valuable. For example, learn how to do that for Azure Storage Account.
SaaS deployments only
Monitoring consumption details are also reported in Account Management (Usage summary > Platform Extensions > Environment name > View Details).
Log Monitoring Classic
The unit of measure for Log Monitoring Classic is one log record. A log record is recognized in one of the following ways:
Timestamp
JSON Object
If you use Logs Powered by Grail, see Log Management and Analytics DPS.
Timestamps
Each timestamp is counted as a new log record.
For example, in the following log data (consumed via log file or generic ingestion), Dynatrace counts nine log records based on timestamp occurrence:
-
Oct 18 05:56:11 INFO ip-10-176-34-132 DHCPREQUEST on eth0 to 10.176.34.1 -
Oct 18 05:56:12 INFO ip-10-176-34-132 DHCPACK from 10.176.34.1 -
Oct 18 05:56:13 INFO ip-10-176-34-132 bound to 10.176.34.132 -- renewal in 1551s4: -
Oct 18 05:56:13 INFO ip-10-176-34-132 [get\_meta] Getting token for IMDSv -
Oct 18 05:56:16 INFO ip-10-176-34-132 [get\_meta] Trying to get http://169.23.2.3 -
Oct 18 05:56:18 INFO ip-10-176-34-132 [rewrite\_aliases] Rewriting aliases -
Oct 18 06:22:06 INFO ip-10-176-34-132 DHCPREQUEST on eth0 to 10.176.34.1 port 67 -
Oct 18 06:22:07 INFO ip-10-176-34-132 DHCPACK from 10.176.34.1 (xid=0x3a182c8c) -
Oct 18 06:22:10 INFO ip-10-176-34-132 bound to 10.176.34.132 -- renewal in 1364s
JSON Objects
Each JSON object is counted as a log record. A JSON file can contain multiple objects that count as a log record. For example, in the following log data, Dynatrace counts three log records based on JSON object occurrence:
{"timestamp": "2021-07-29T10:54:40.962165022Z","level": "error","log.source": "/var/log/syslog","application.id": "PaymentService-Prod","content": "DHCPREQUEST on eth0 to 10.176.34.1"},{"log.source": "/var/log/syslog","content": "[get\_meta] Getting token for IMDSv"},{"content": "DHCPACK from 10.176.34.1 (xid=0x3a182c8c)"}
Consumption details: Log Monitoring Classic
Dynatrace provides built-in usage metrics that help you understand and analyze your organization's consumption of Log Monitoring Classic. To use them in Data Explorer, enter DPS into the Search field. These metrics are also available via the Environment API and linked in Account Management (Usage summary > Log Monitoring Classic > Actions > View details ). The table below shows the list of metrics you can use to monitor the consumption details for Log Monitoring Classic.
- (DPS) Total Log Monitoring Classic billing usage
Key:
builtin:billing.log_monitoring_classic.usageDimension: count
Resolution: 1 min
Description: Number of log records ingested aggregated over all monitored entities.
- (DPS) Log Monitoring Classic billing usage by monitored entity
Key:
builtin:billing.log_monitoring_classic.usage_by_entityDimension:
dt.entity.monitored_entity\[ME:MONITORED_ENTITY]Resolution: 1 min
Description: Number of log records ingested split by monitored entity.
- (DPS) Log Monitoring Classic billing usage by log path
Key:
builtin:billing.log_monitoring_classic.usage_by_log_pathDimension:
log_path\[STRING]Resolution: 1 min
Description: Number of log records ingested split by log path.
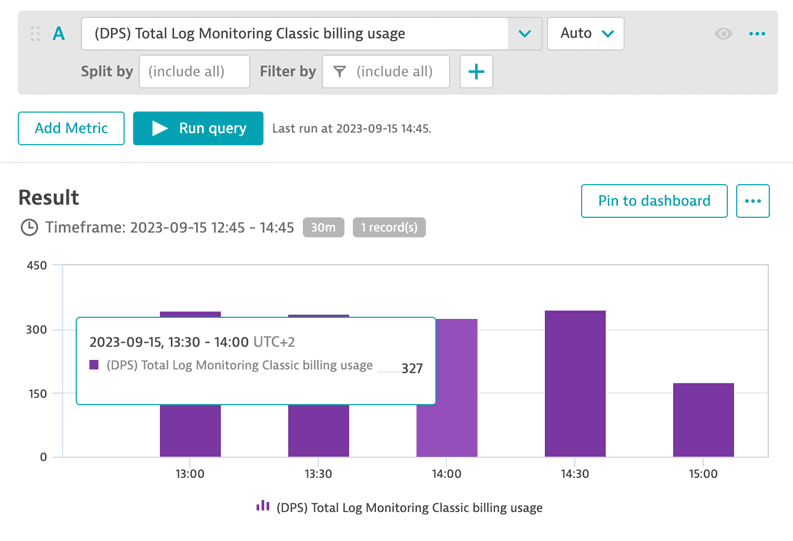
You can monitor the total number of billable log records for different intervals (15 min, hour, day, or week) for any selected timeframe using the metric (DPS) Total Log Monitoring Classic billing usage. The example below shows consumption aggregated in 1-hour intervals.
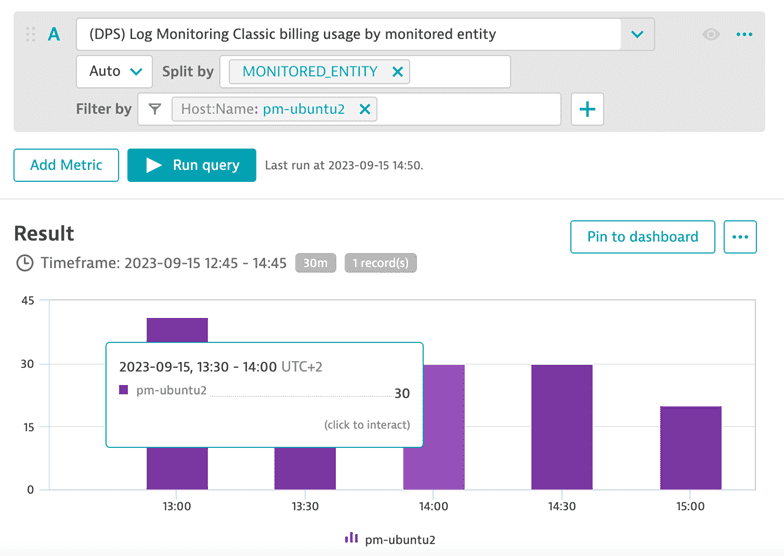
You can monitor the consumption of log records by any filtered entity by using the metric (DPS) Log Monitoring Classic billing usage by monitored entity. The example below shows the number of billable log records that came from a specified host.
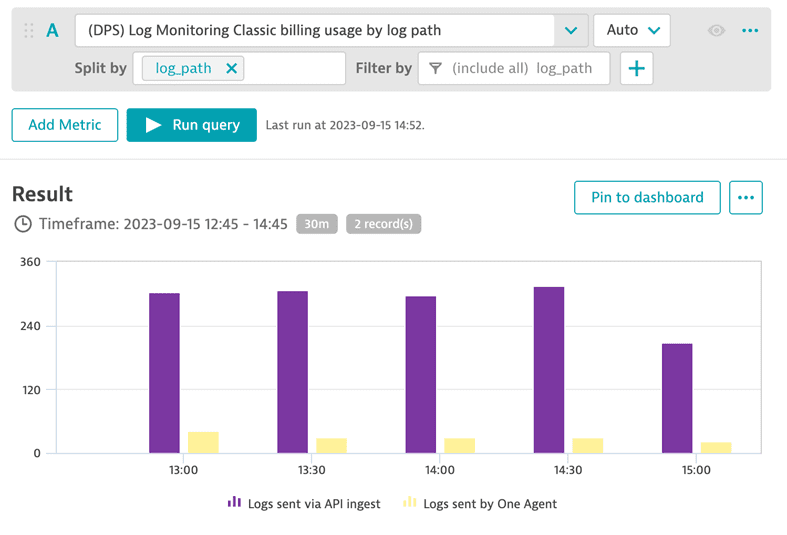
You can monitor the consumption of log records by any filtered log path using the metric (DPS) Log Monitoring Classic billing usage by log path. The example below shows the number of billable log records that came from OneAgent and API.
SaaS deployments only
Monitoring consumption details are also reported in Account Management (Usage summary > Platform Extensions > Environment name > View Details).
Custom Traces Classic
You can ingest traces into Dynatrace using OpenTelemetry exporters for applications running on hosts that don't have OneAgent installed. These distributed traces are sent via the Trace Ingest API.
The unit of measure for Custom Traces Classic is in an ingested span. A span is a single operation within a distributed trace. To calculate the total consumption, multiply the number of ingested spans by the price per span.
Traces, including OpenTelemetry spans captured by OneAgent code modules or sent via the OneAgent local Trace API, are included with Full-Stack Monitoring, and therefore are not consumed as Custom Traces Classic.
Consumption details: Custom Traces Classic
Dynatrace provides built-in usage metrics that help you understand and analyze your organization's consumption of Custom Traces Classic. To use them in Data Explorer, enter DPS into the Search field. These metrics are also available via the Environment API and linked in Account Management (Usage summary > Custom Traces Classic > Actions > View details). The table below shows the list of metrics you can use to monitor your organization's consumption of Custom Traces Classic.
- (DPS) Total Custom Traces Classic billing usage
Key:
builtin:billing.custom_traces_classic.usageDimension: count
Resolution: 1 min
Description: The number of billable ingested spans aggregated over all monitored entities.
- (DPS) Custom Traces Classic billing usage by monitored entity
Key:
builtin:billing.custom_traces_classic.usage_by_entityDimension:
dt.entity.monitored_entity\[ME:MONITORED_ENTITY]Resolution: 1 min
Description: The number of billable ingested spans split by monitored entity.
- (DPS) Custom Traces Classic billing usage by span type
Key:
builtin:billing.custom_traces_classic.usage_by_span_typeDimension:
span_type\[STRING]Resolution: 1 min
Description: The number of billable ingested spans split by span type. |
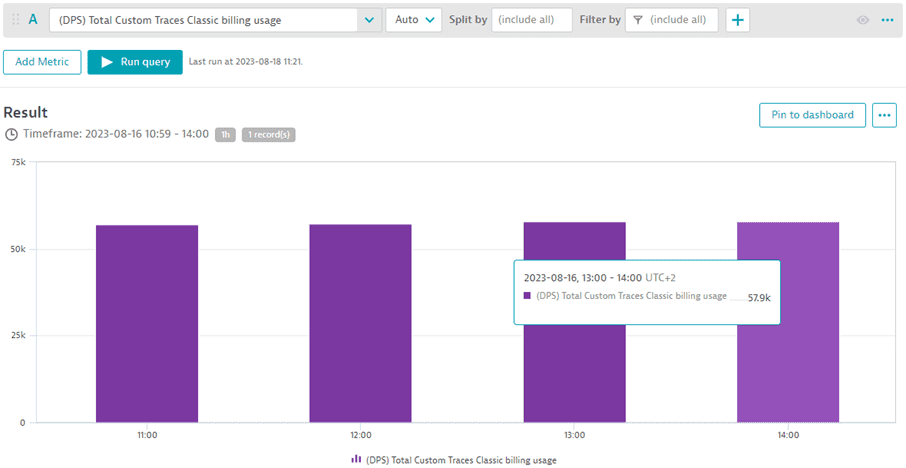
You can monitor the total number of billable custom traces for various intervals for any selected timeframe using the metric (DPS) Total Custom Traces Classic billing usage. The example below shows consumption aggregated in 1-hour intervals. Between 11:00 and 14:00, around 58,000 custom traces were consumed each 1 hour.
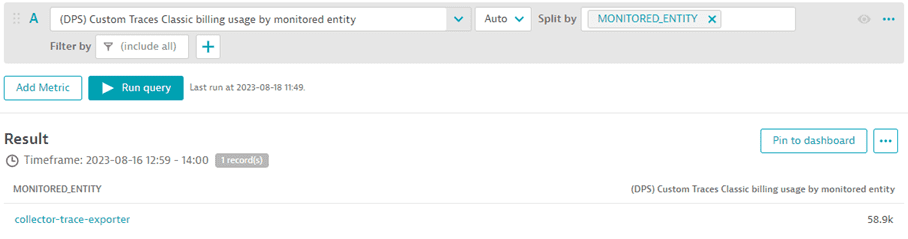
You can monitor the consumption of metric data points by any filtered entity using the metric (DPS) Billed metric data points reported and split by other entities. The example below shows that all billable custom traces between 13:00 and 14:00 came from the entity collector-trace-exporter.
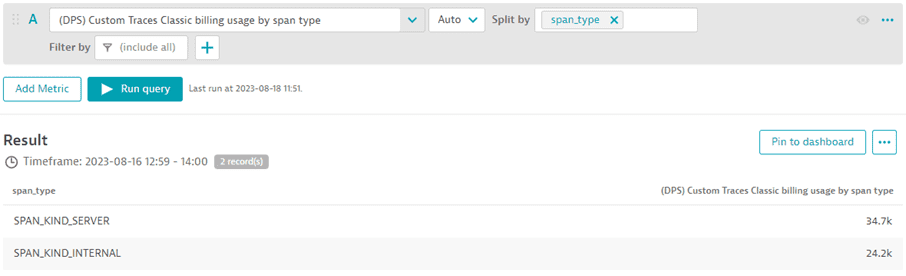
If you are interested in the split by span type, use the metric (DPS) Custom Traces Classic billing usage by span type.
SaaS deployments only
Monitoring consumption details are also reported in Account Management (Usage summary > Platform Extensions > Environment name > View Details).
Custom Events Classic
The unit of measure for calculating your environment's consumption of custom events is custom events. While there are no additional costs or licensing involved in the default monitoring and reporting of built-in event types via OneAgent or cloud integrations, you have the option to configure custom events and/or event-ingestion channels. Such event-related customizations do result in additional consumption because they require significantly more processing and analytical power than the built-in event ingestion via OneAgent of cloud integrations.
Custom created/ingested or subscribed events that might be configured for an environment include:
- Any custom event sent to Dynatrace using the Events API v2
- Any custom event (such as a Kubernetes event) created from log messages by a log event extraction rule
Consumption details: Custom Events Classic
Dynatrace provides built-in usage metrics that help you understand and analyze your organization's consumption of Custom Events Classic. To use them in Data Explorer, enter DPS into the Search field. These metrics are also available via the Environment API and linked in Account Management (Usage summary > Custom Events Classic > Actions > View details). The table below shows the list of metrics you can use to monitor your organization's consumption of Custom Events Classic.
- (DPS) Total Custom Events Classic billing usage
Key:
builtin:billing.custom_events_classic.usageDimension: count
Resolution: 1 min
Description: Number of billable ingested events aggregated over all monitored entities.
- (DPS) Custom Events Classic billing usage by event info
Key:
builtin:billing.custom_events_classic.usage_by_event_infoDimension: count
Resolution: 1 min
Description: Number of billable ingested events split by entity type.
- (DPS) Custom Events Classic billing usage by monitored entity
Key:
builtin:billing.custom_events_classic.usage_by_entityDimension: count
Resolution: 1 min
Description: Number of billable ingested events split by monitored entity.
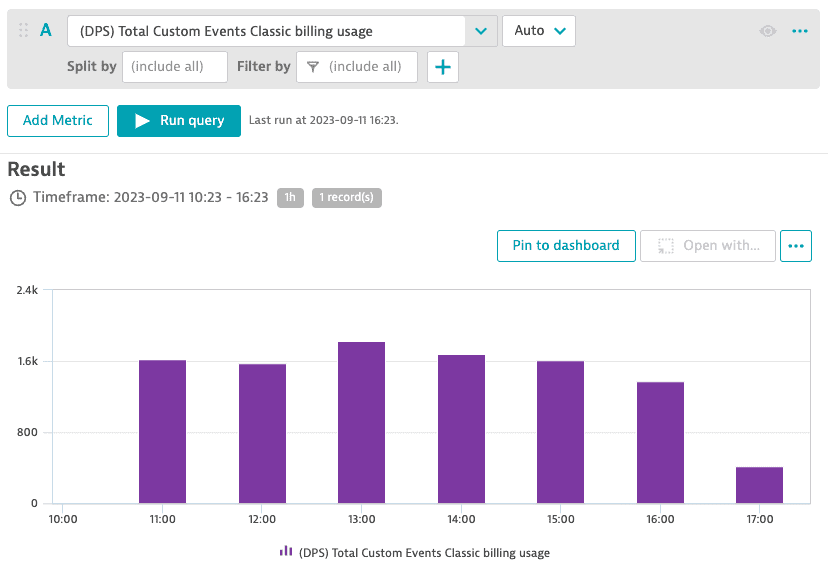
You can monitor the total number of billable classic events ingested for various intervals for any selected timeframe using the metric (DPS) Total Custom Events Classic billing usage. The example below shows the consumption aggregated in 1-hour intervals. Between 11:00 and 14:00, around 1,600 custom events classic were ingested every 1 hour.
SaaS deployments only
Monitoring consumption details are also reported in Account Management (Usage summary > Platform Extensions > Environment name > View Details).
Serverless Functions Classic
Dynatrace enables end-to-end observability of serverless Cloud functions based on monitoring data coming from traces, metrics, and logs.
Tracing of serverless functions, such as AWS Lambda, Azure Functions, and Google Functions operating on a consumption model, is based on the monitored function's total number of monitored invocations. The term "function invocations" is equivalent to "function requests" or "function executions."
Cloud functions monitored with metrics using cloud vendor integrations, such as Amazon CloudWatch, Azure Monitor, or Google Cloud Operations consume custom metrics within Dynatrace. For details, see custom metrics.
Dynatrace also allows you to ingest logs from your serverless cloud functions. When using Dynatrace with Grail, serverless function consumption works as described in Log Management and Analytics. Using Dynatrace without Grail results in consumption via Log Monitoring Classic. With Dynatrace Managed, the Log Monitoring Classic consumption model is applied.
AWS Lambda tracing
For AWS Lambda tracing integration, monitoring consumption is based on the monitored functions' total number of monitored invocations (for example, requests).
Assuming an average of 1,000 invocations per Lambda function per month, monitoring 100 Lambda functions would result in a total of 100,000 invocations per month. Each invocation results in the consumption of one invocation from your DPS budget as per your rate card.
Azure Function tracing
Azure Functions provide many different hosting options with various tracing integration possibilities. Tracing Azure Functions on the App Service (dedicated) plan is equivalent to Full-Stack Monitoring and consumes GiB-hours (depending on the memory size and the duration the App Service is monitored).
For Tracing Azure Functions on Azure consumption plan, monitoring consumption is based on the monitored functions' total number of monitored invocations (for example, requests).
Assuming an average of 1,000 invocations per Azure function per month, monitoring 100 Azure functions would result in a total of 100,000 invocations per month. Each invocation is deducted from your available Dynatrace Platform Subscription budget as per your rate card.
Google Functions tracing
For Google Functions tracing integration, monitoring consumption is based on the monitored functions' total number of monitored invocations (for example, requests).
Assuming an average of 1,000 invocations per Google function per month, monitoring 100 Google functions would result in a total of 100,000 invocations per month. Each invocation is deducted from your available Dynatrace Platform Subscription budget as per your rate card.
When a Serverless Functions platform host is monitored with OneAgent (consuming GiB-hours), all monitored function invocations are part of the Full-Stack monitoring package and therefore don't result in additional consumption.
Consumption details: Serverless Functions Classic
Dynatrace provides built-in usage metrics that help you understand and analyze your organization's consumption of Serverless Functions Classic. To use them in Data Explorer, enter DPS into the Search field. These metrics are also available via the Environment API and linked in Account Management (Usage summary > Serverless Functions Classic > Actions > View details). The table below shows the list of metrics you can use to monitor your organization's consumption of Serverless Functions Classic.
- (DPS) Total Serverless Functions Classic billing usage
Key:
builtin:billing.serverless_functions_classic.usageDimension: count
Resolution: 1 min
Description: Number of billable serverless function invocations aggregated over all monitored entities.
- (DPS) Serverless Functions Classic billing usage by function
Key:
builtin:billing.serverless_functions_classic.usage_by_functionDimension:
function\[STRING]Resolution: 1 min
Description: Number of billable serverless function invocations split by function.
- (DPS) Serverless Functions Classic billing usage by monitored entity
Key:
builtin:billing.serverless_functions_classic.usage_by_entityDimension:
dt.entity.monitored_entity\[ME:MONITORED_ENTITY]Resolution: 1 min
Description: Number of billable serverless function invocations split by monitored entity.
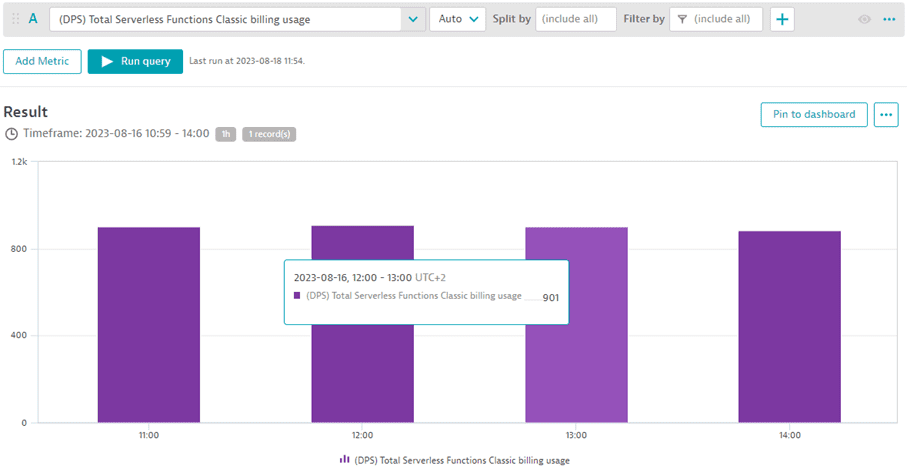
You can monitor the total number of billable serverless function invocations for various intervals for any selected timeframe using the metric (DPS) Total Custom Traces Classic billing usage. The example below shows consumption aggregated in 1-hour intervals. Between 11:00 and 14:00, about 900 serverless function invocations were consumed each hour.
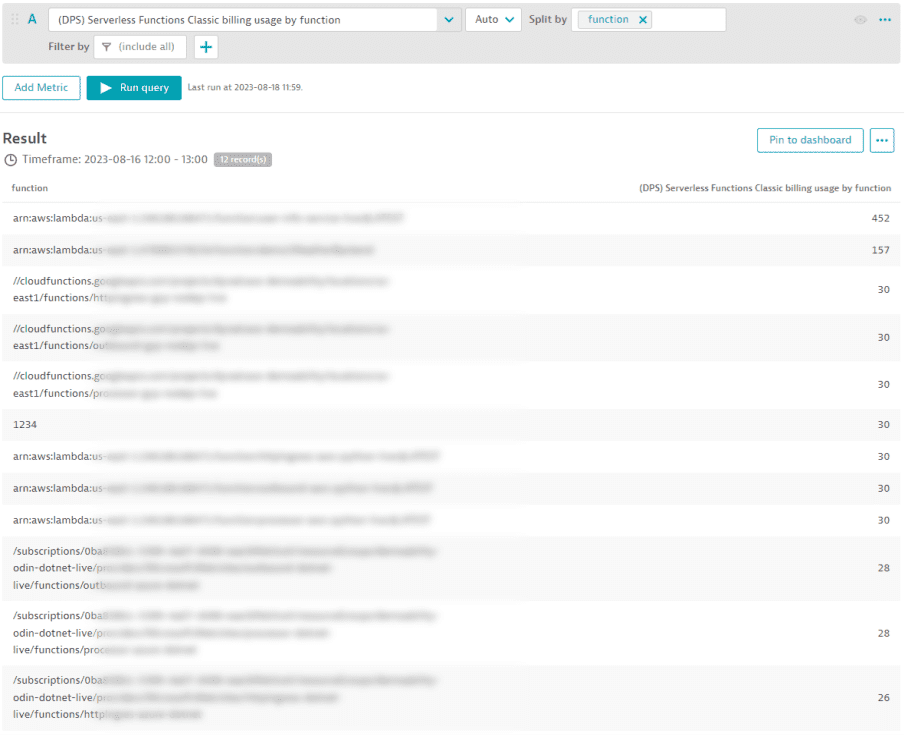
If you need to know the number of invocations split by serverless function, use the metric (DPS) Serverless Functions Classic billing usage by function. The example below shows the list of serverless functions and the number of invocations between 12:00 and 13:00.
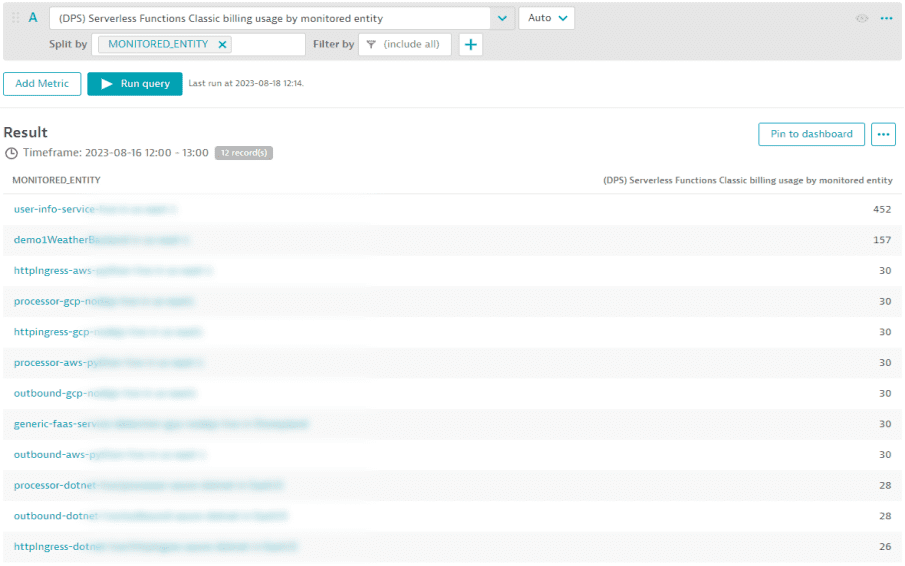
If you need to know the number of invocations split by monitored entity, use the metric (DPS) Serverless Functions Classic billing usage by monitored entity. The example below shows the list of entities and the number of invocations triggered between 12:00 and 13:00.
SaaS deployments only
Monitoring consumption details are also reported in Account Management (Usage summary > Platform Extensions > Environment name > View Details).