Log analysis with PurePath® technology
OneAgent version 1.231+
Logs are often a crucial component for understanding the behavior of your environment. Use the log enrichment to view related long entries right in the distributed traces view and enhance your analysis capabilities. By combining logs with distributed traces, you can check log records in the full context of a transaction. Automatic contextualization of log data works out of the box for popular languages like Java, .NET, Node.js, Go, and PHP, as well as for NGINX and Apache web servers.
Logs with traces
With logs available for individual services over the flow of the transaction, you can trace user interaction with your application via log records. To view logs related to an individual transaction, navigate to the trace you want to analyze and select the Logs tab.
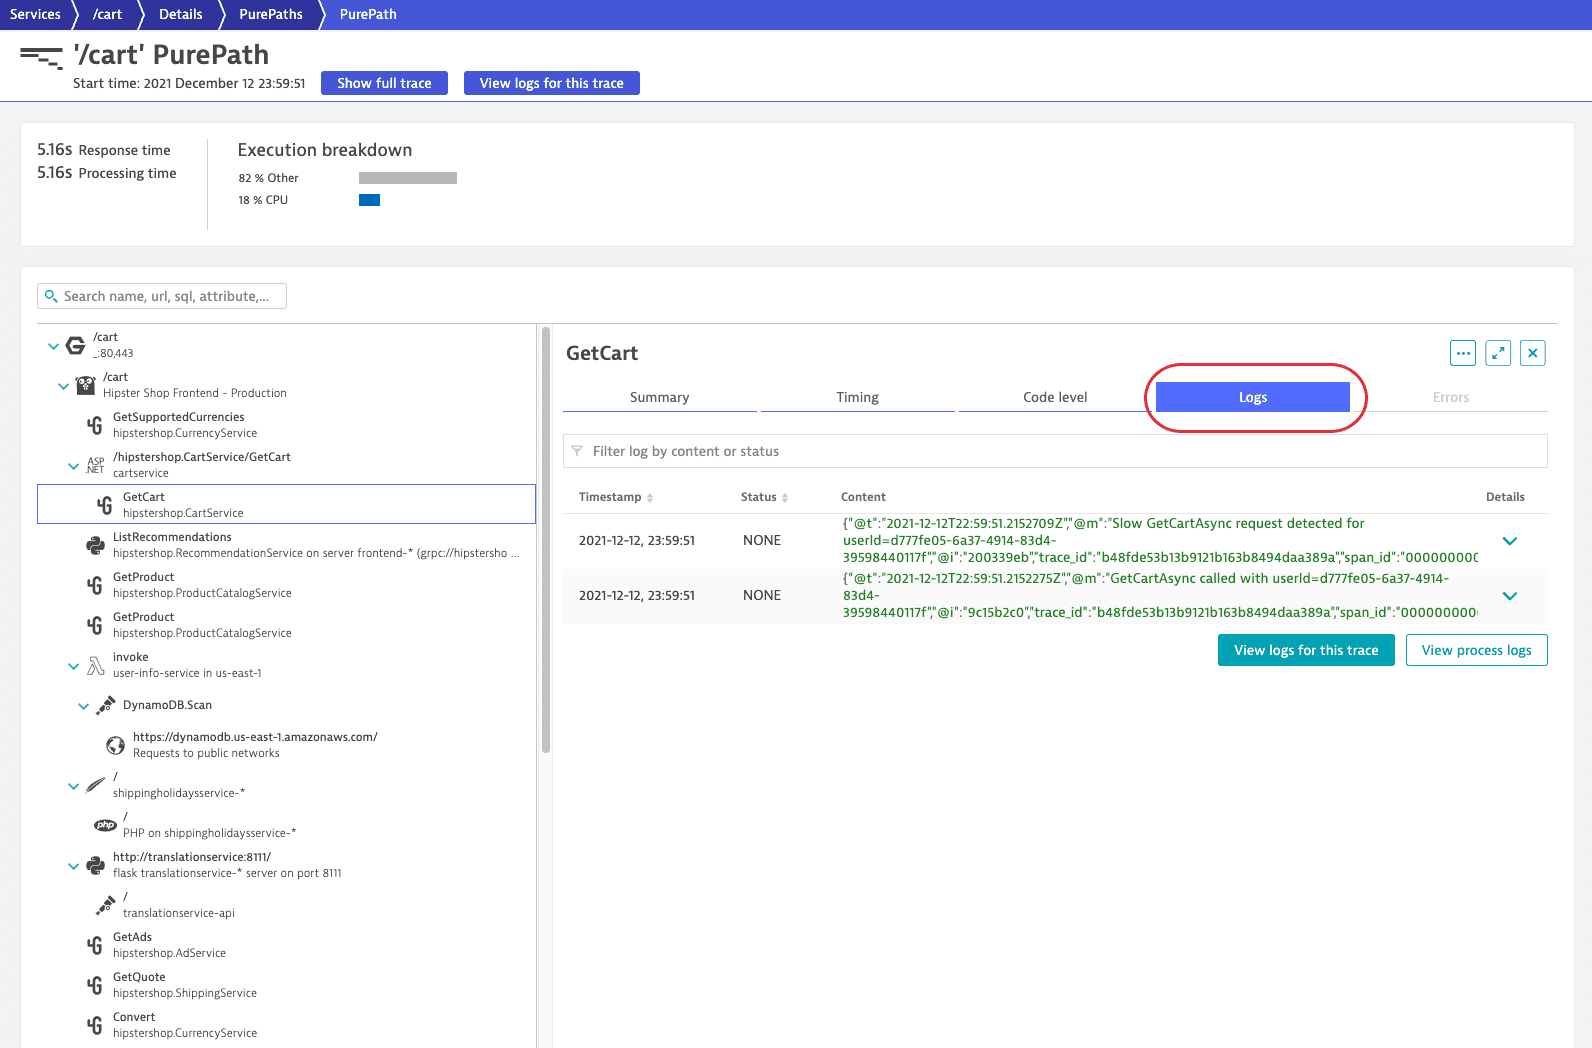
You can also view all logs related to the trace in the Log viewer. To open it, select View logs for this trace.
Use cases
Walk through these examples of problems to see how logs can enhance your distributed traces analysis.
Understand and fix multiple problems via logs and traces
The problem affects multiple services and combines a failure rate increase with response time degradation.
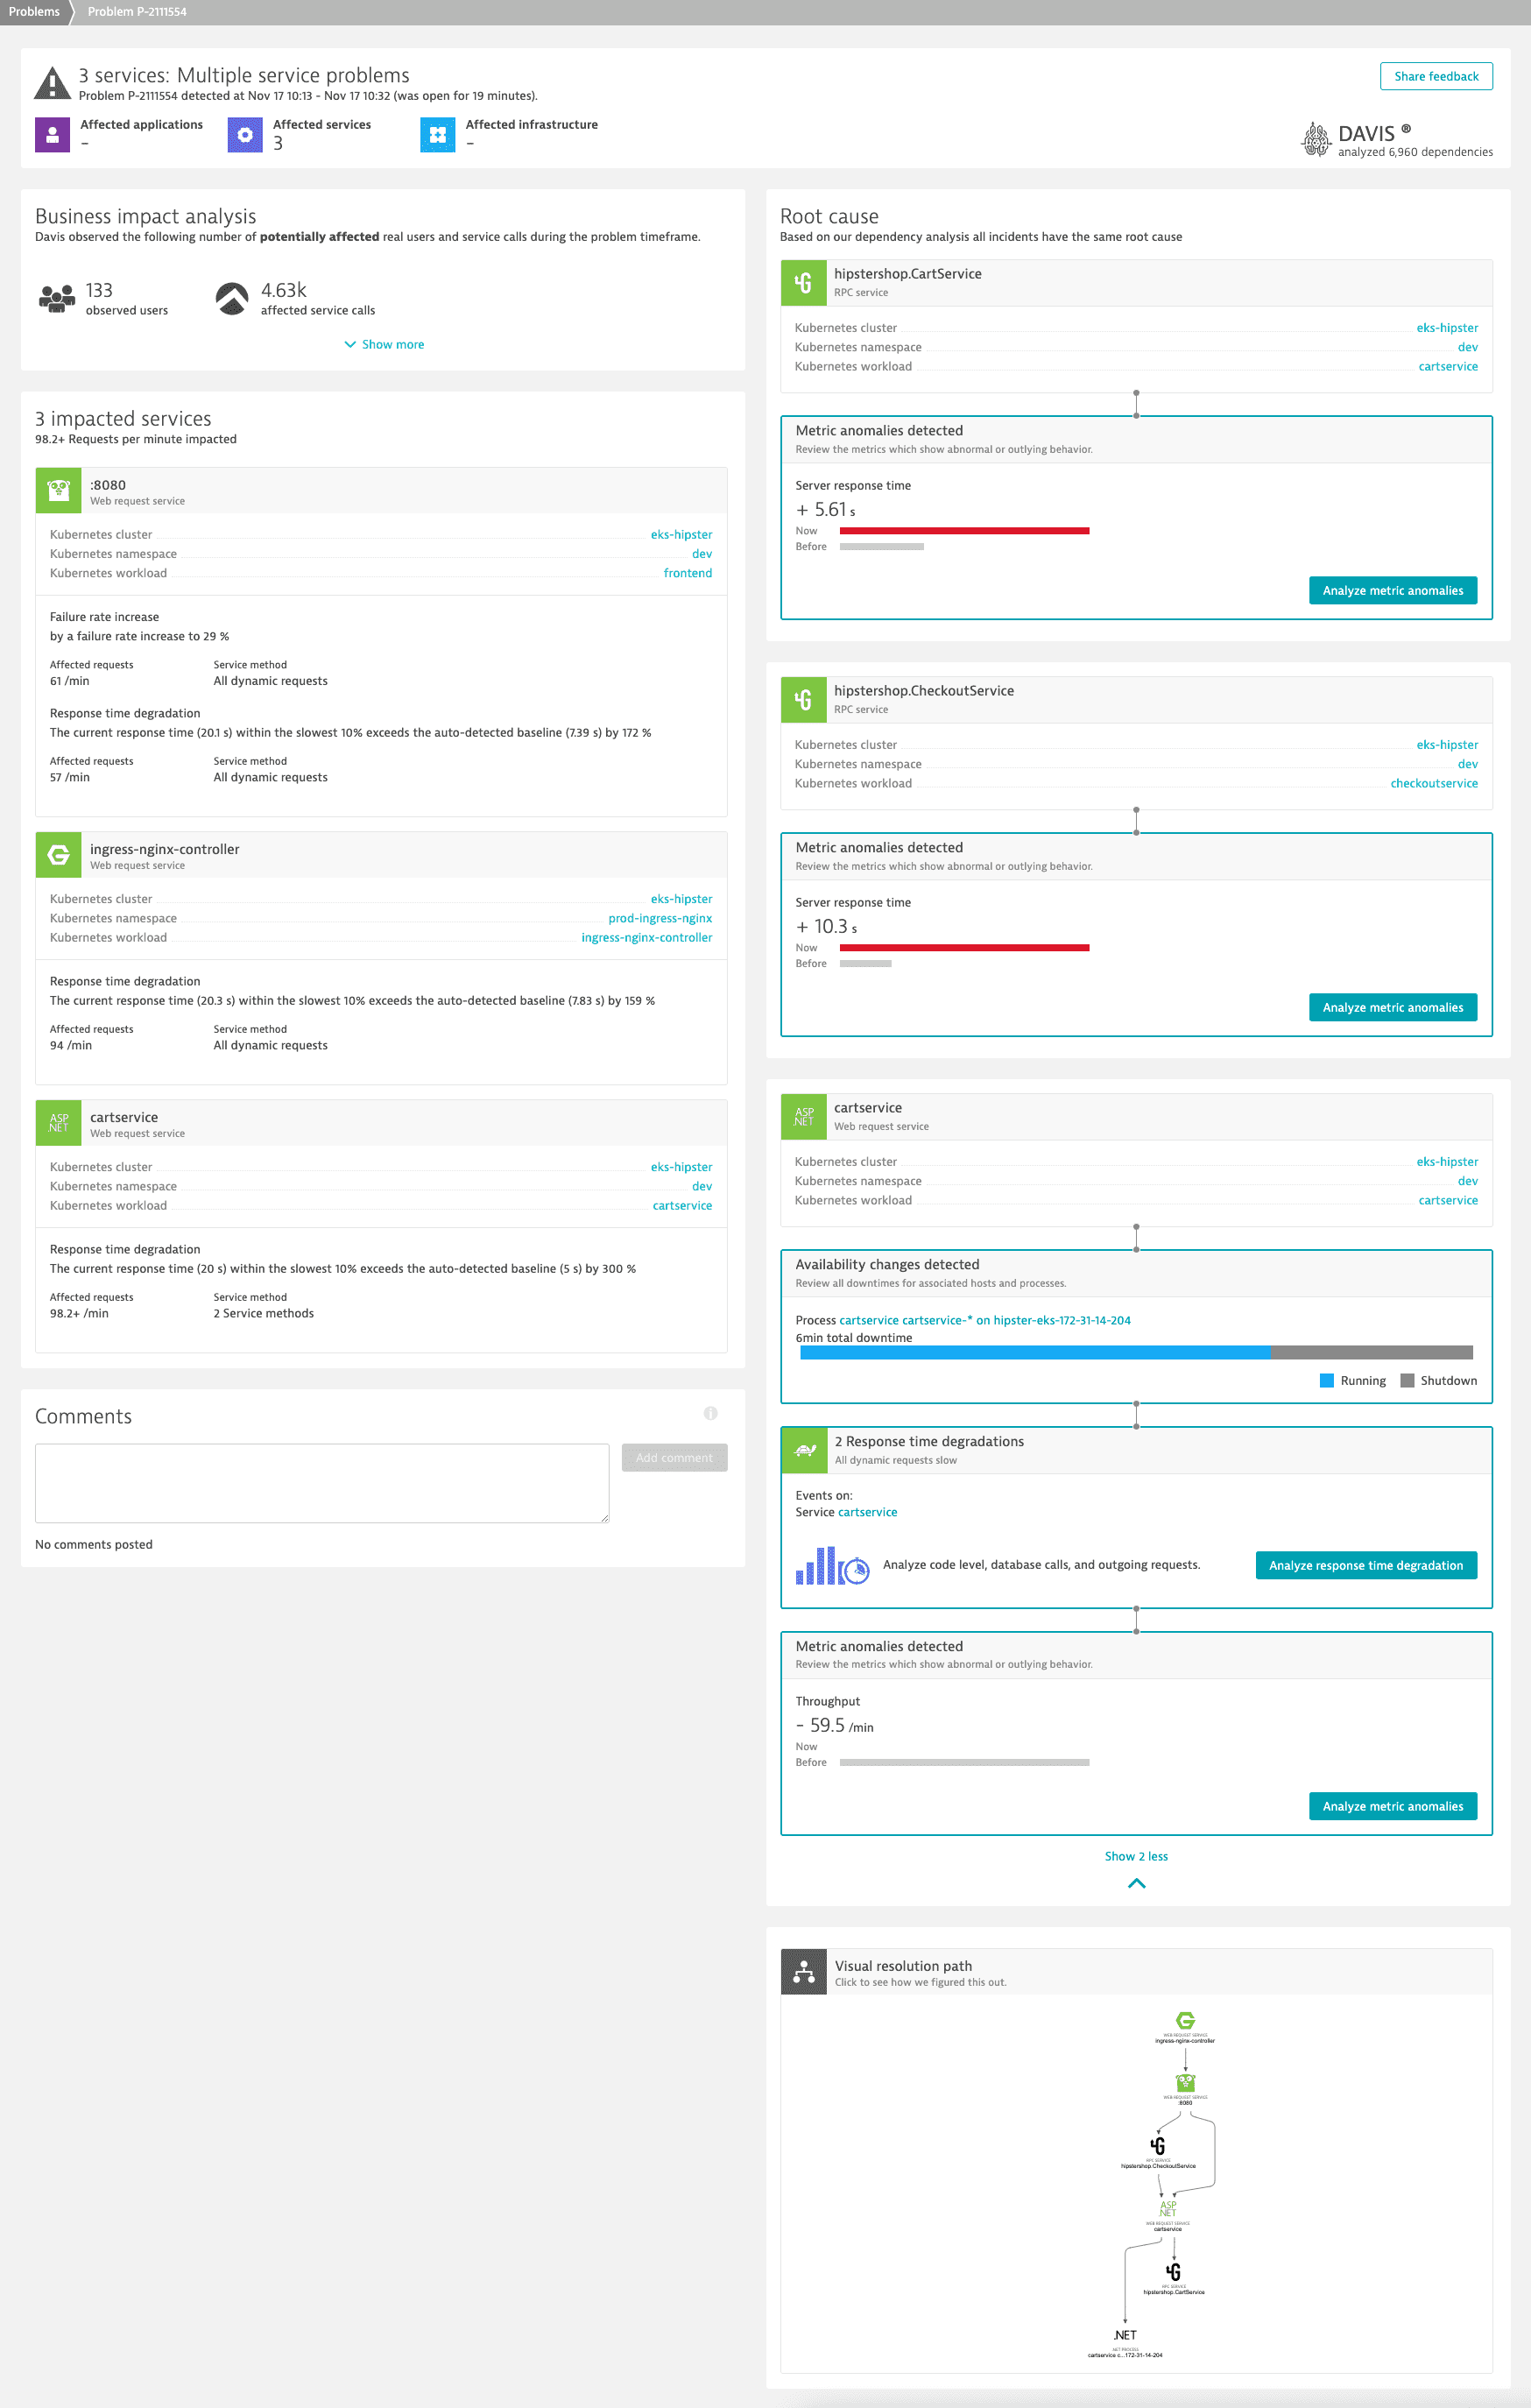
We begin our analysis with the affected Go service and check its dynamic requests.
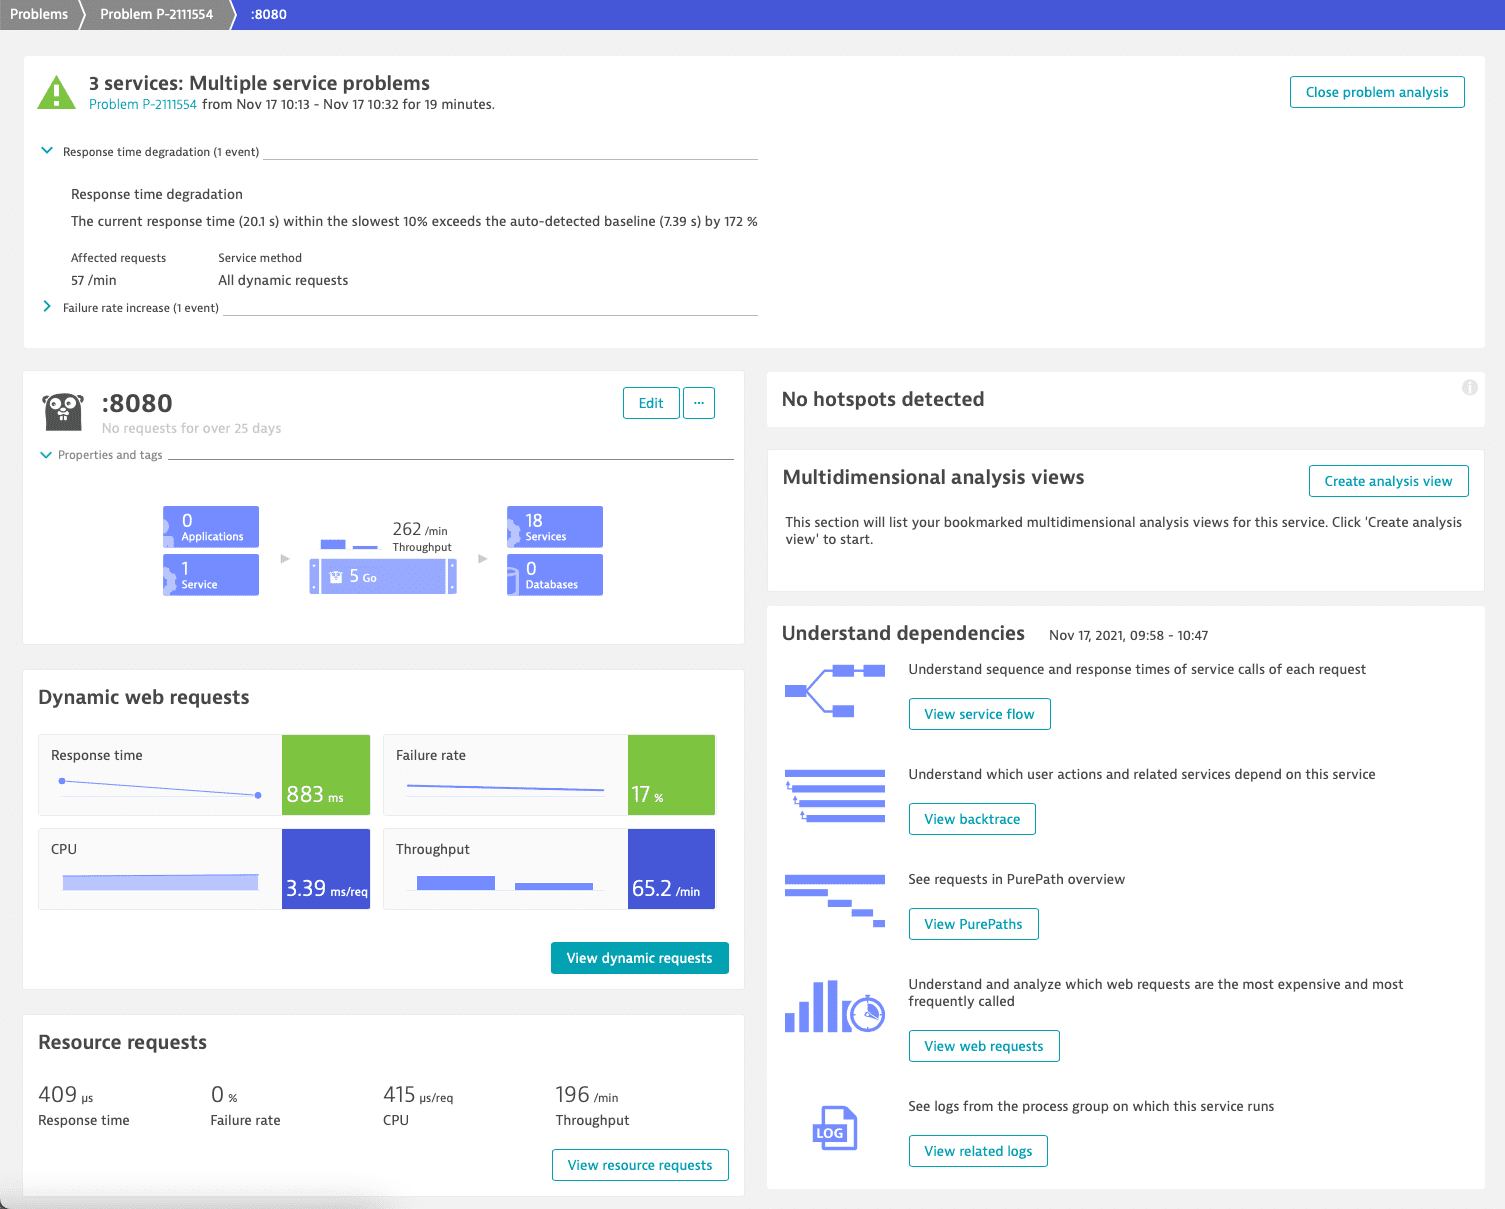
To investigate the failure rate, we select the Failure rate tile. This takes us to the Failure rate tab of the Details page.
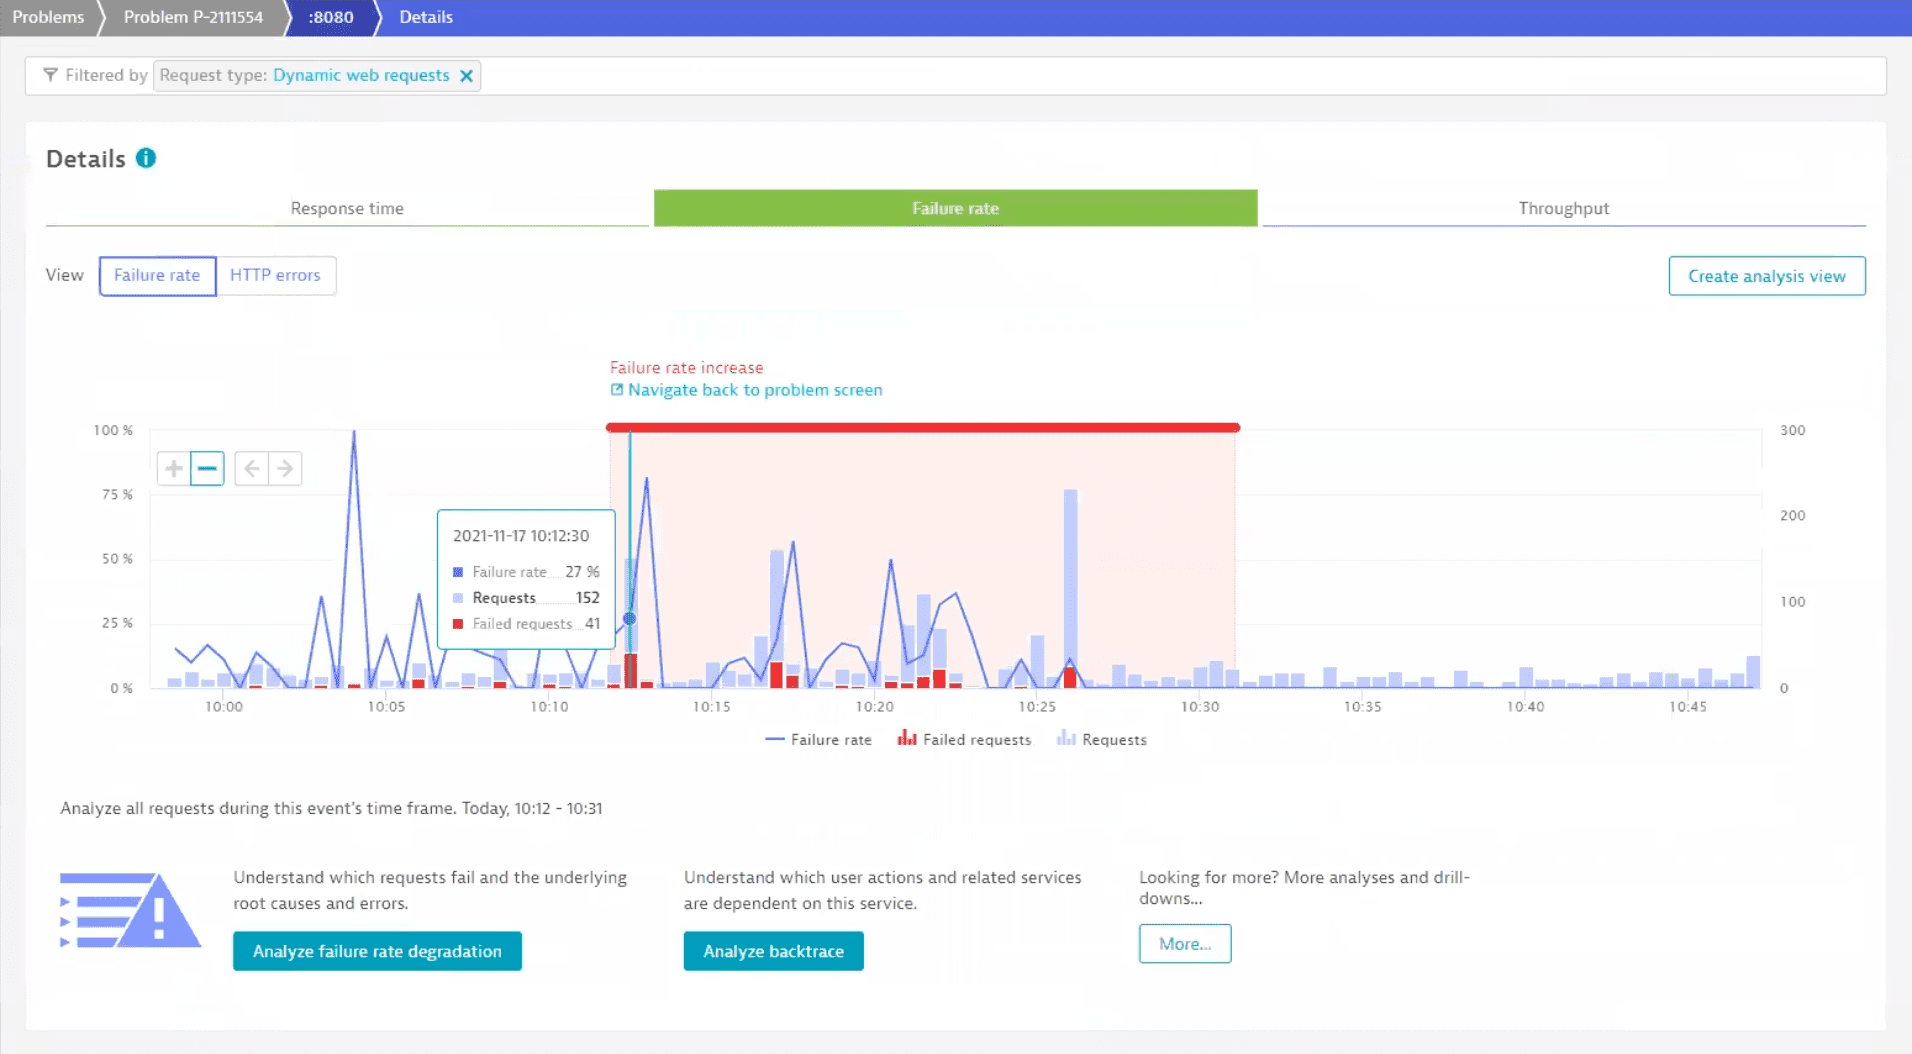
The chart highlights the time period over which the failure rate increase occurred. To find out more, we select Analyse failure rate degradation.
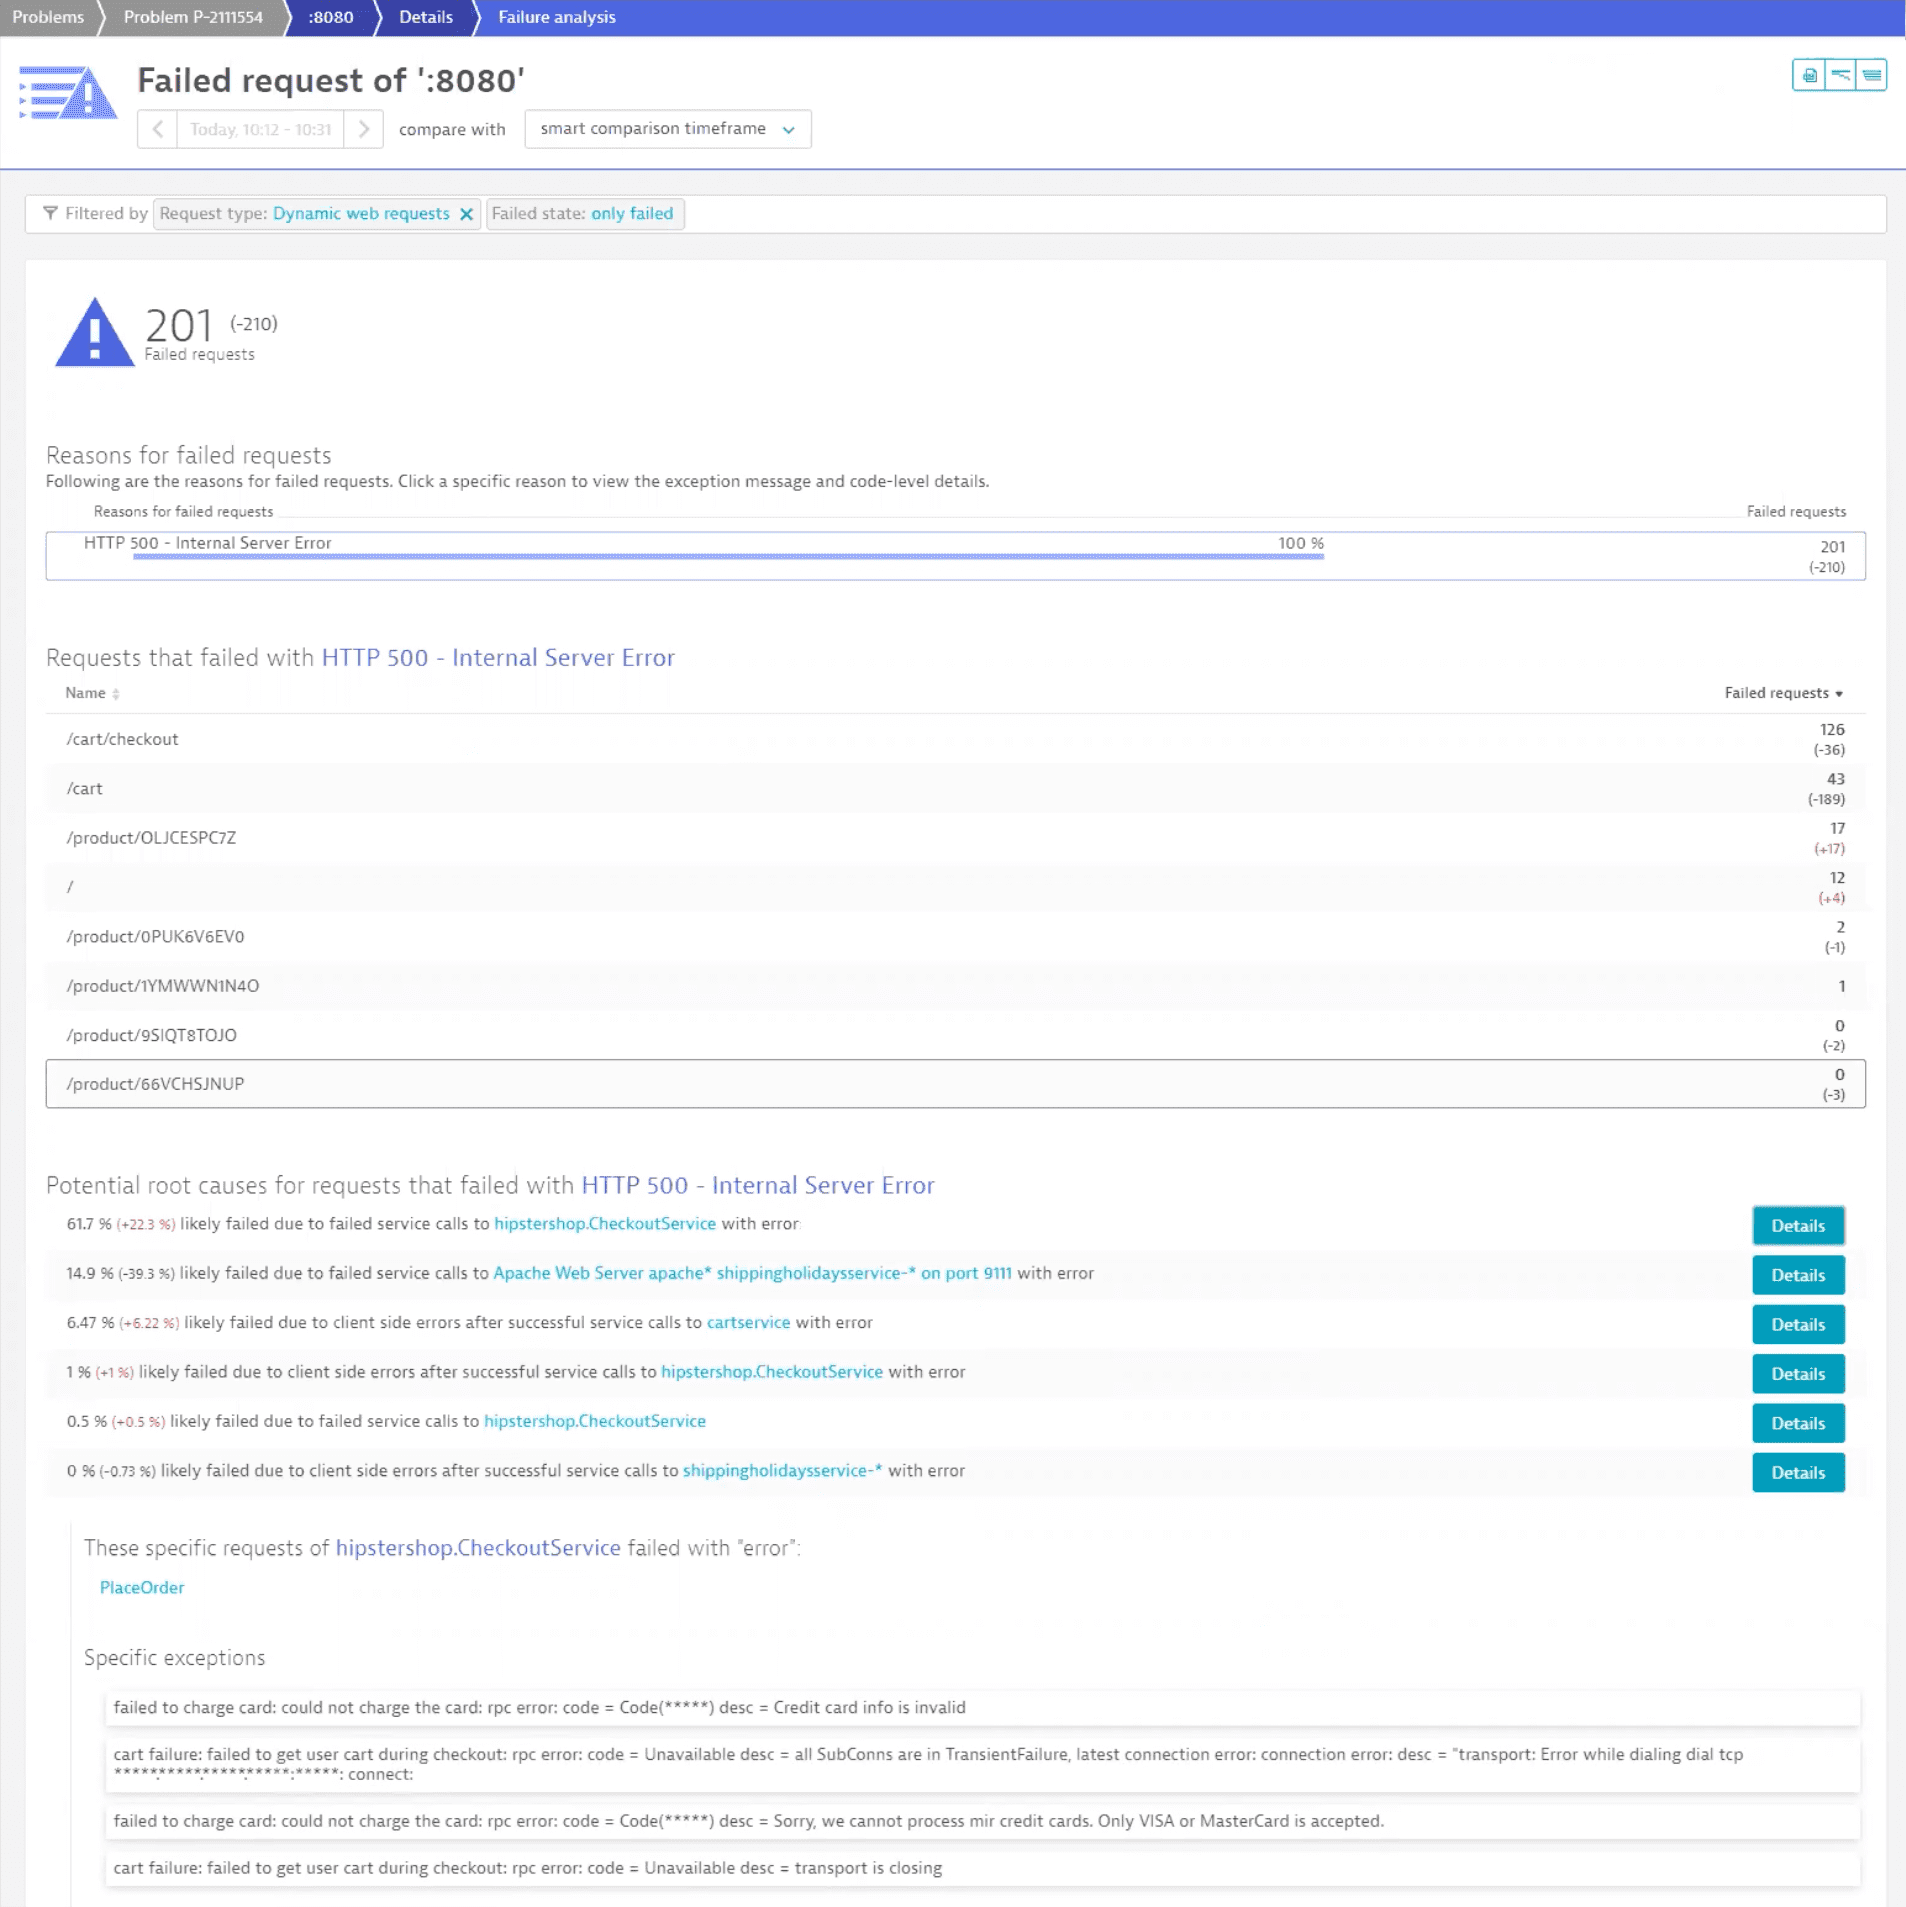
We immediately see that a lot of requests are affected and that Dynatrace suggests some possible root causes. We select Details for the first one to inspect that possible root cause.
The first extension on the list is an issue with a credit card payment, which has a serious impact on users, so that matter requires investigation. You can find related logs at the bottom of the page. For now, let's select View all logs in the log viewer to check all possible logs.
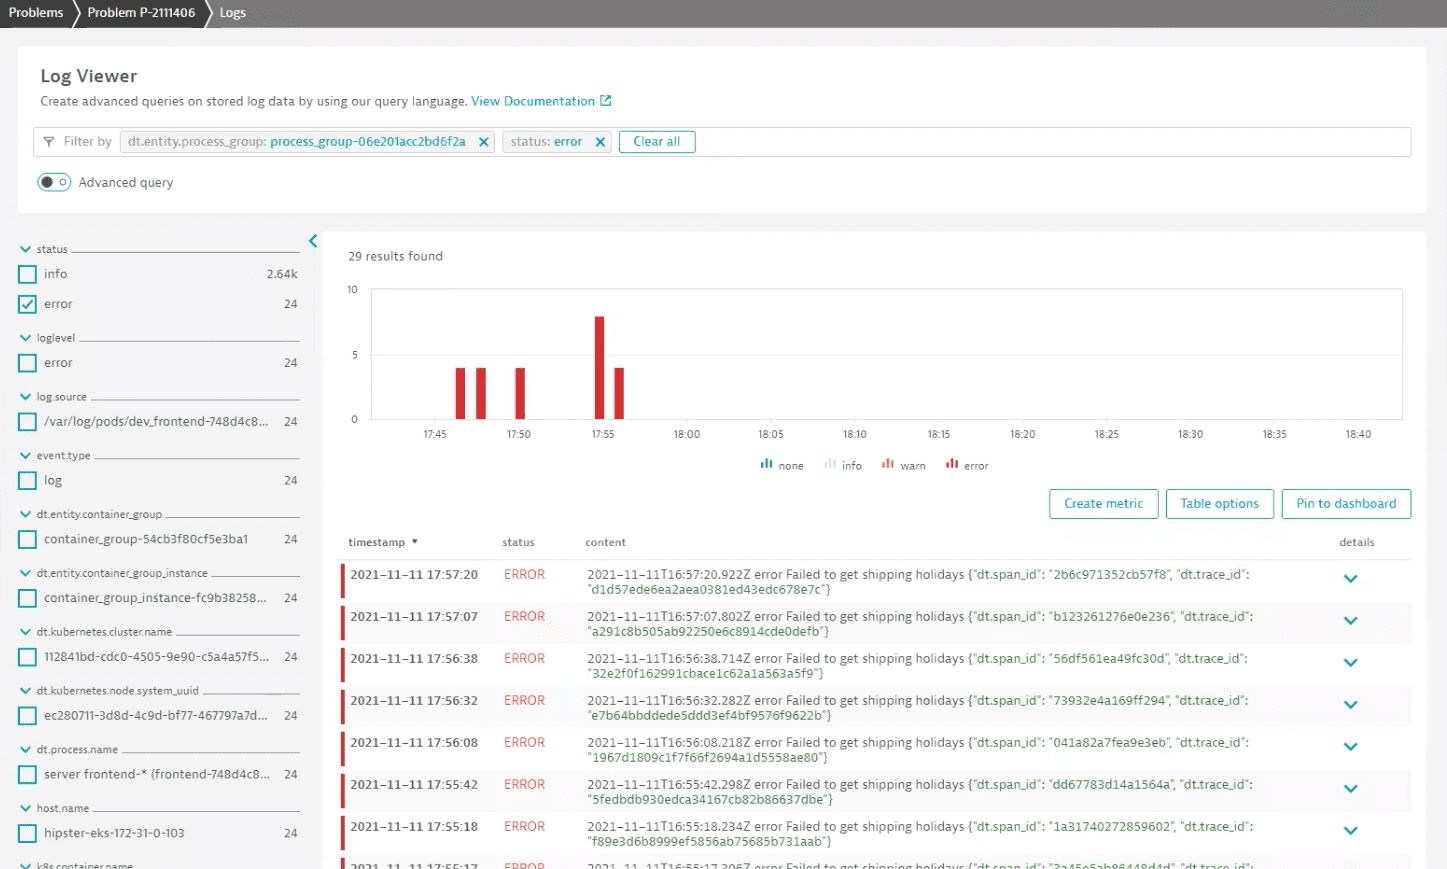
We can see right away that there's a problem with loading shipping holidays. Expand a log record to see more. Among additional attributes, we can find the trace_id property, which links the log record to a distributed trace.
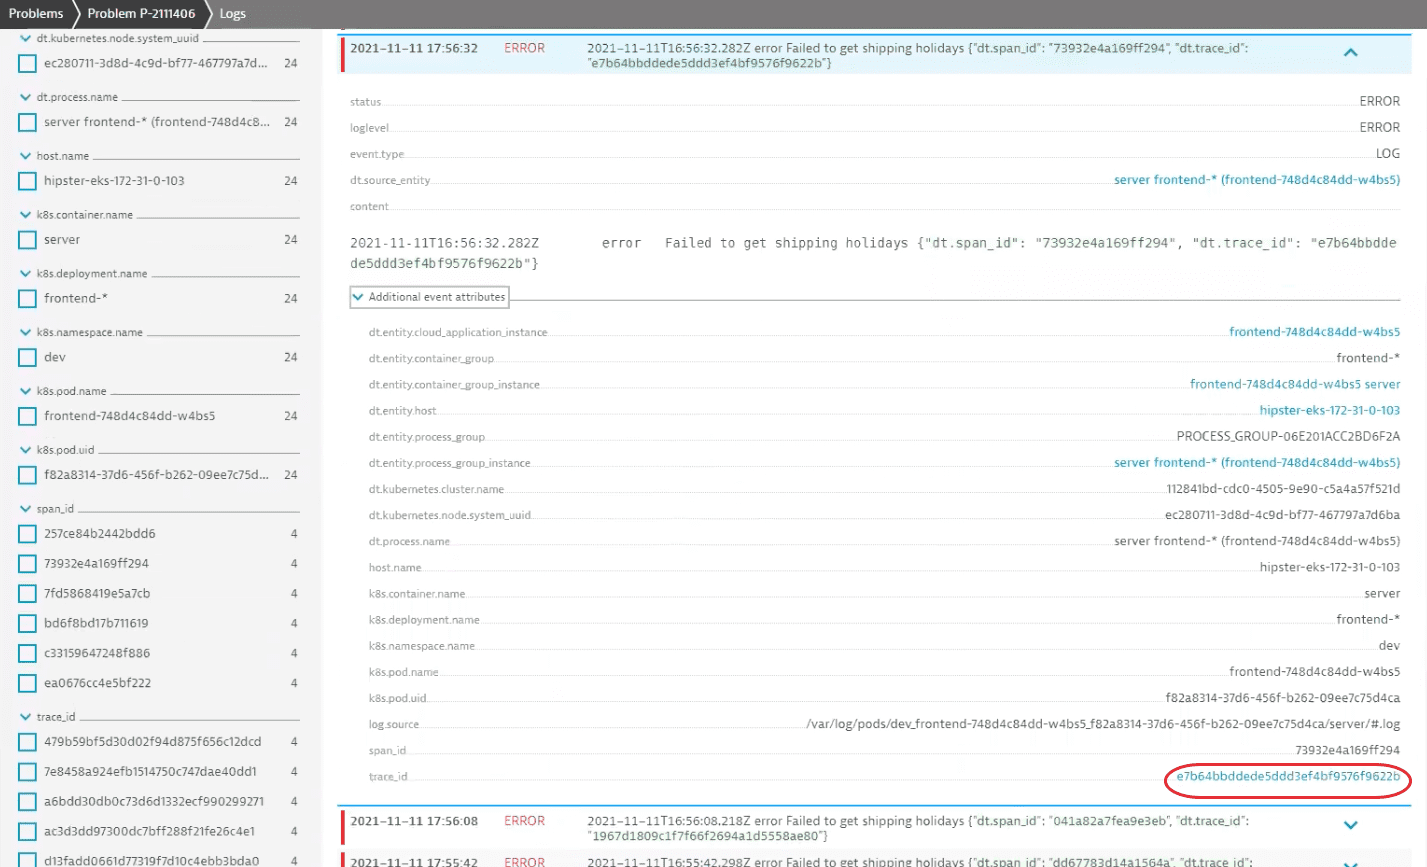
Select the value of the property to navigate to the related distributed trace. It contains a detailed overview of application behavior and user experience for this particular transaction.
We can see at a glance that two traces are in an erroneous state. If we went through them, we'd find an error log for the /cart trace.
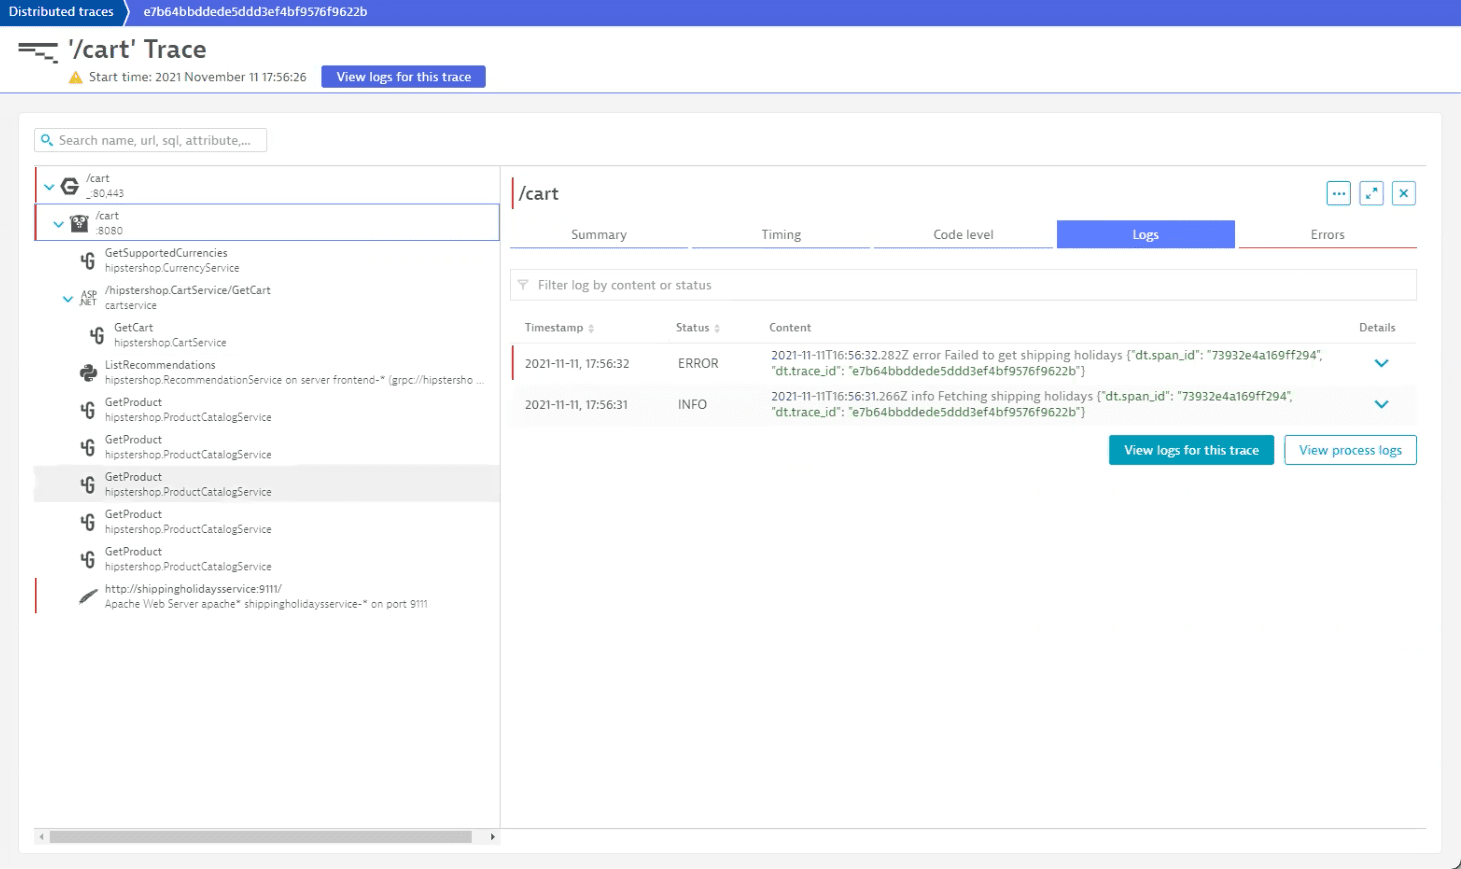
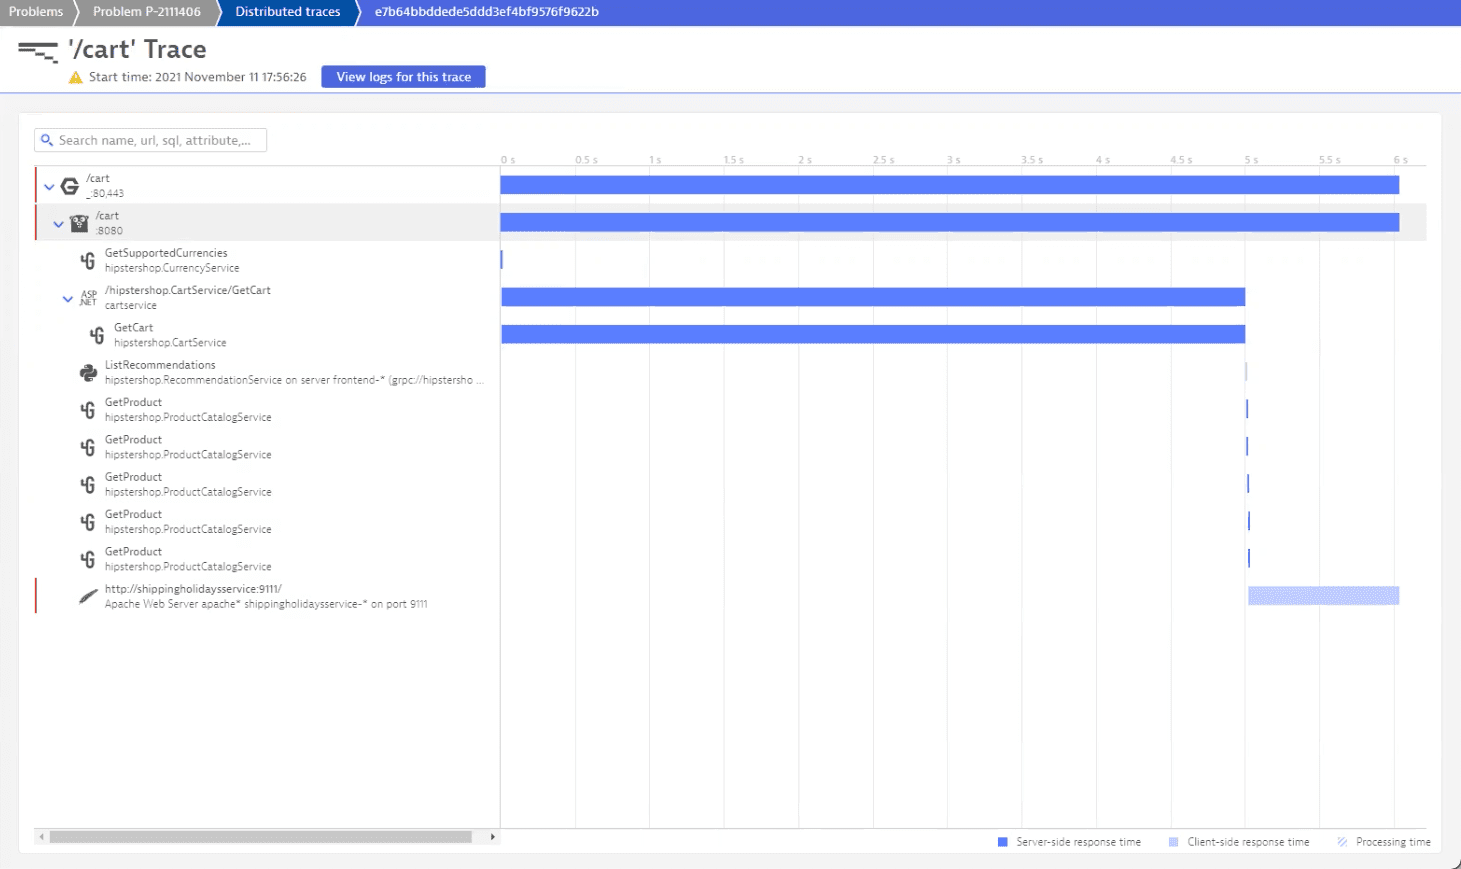
The log shows an error while attempting to load shipping holidays, so we can check this trace for more information, as it contains an error as well, hinting that it might be the cause of response time degradation.
Looking at the distributed trace, we conclude that there's something wrong with the GetCart service, which contributes significantly to the overall response time. If we check its logs, we'll find the slow request entry.
Now that we have identified components contributing to the problem, we can contact responsible teams and ask them to investigate.
Let's go back and check logs for more errors. Because we have attended to the shipping holiday problem, we can filter out those logs with advanced query mode.
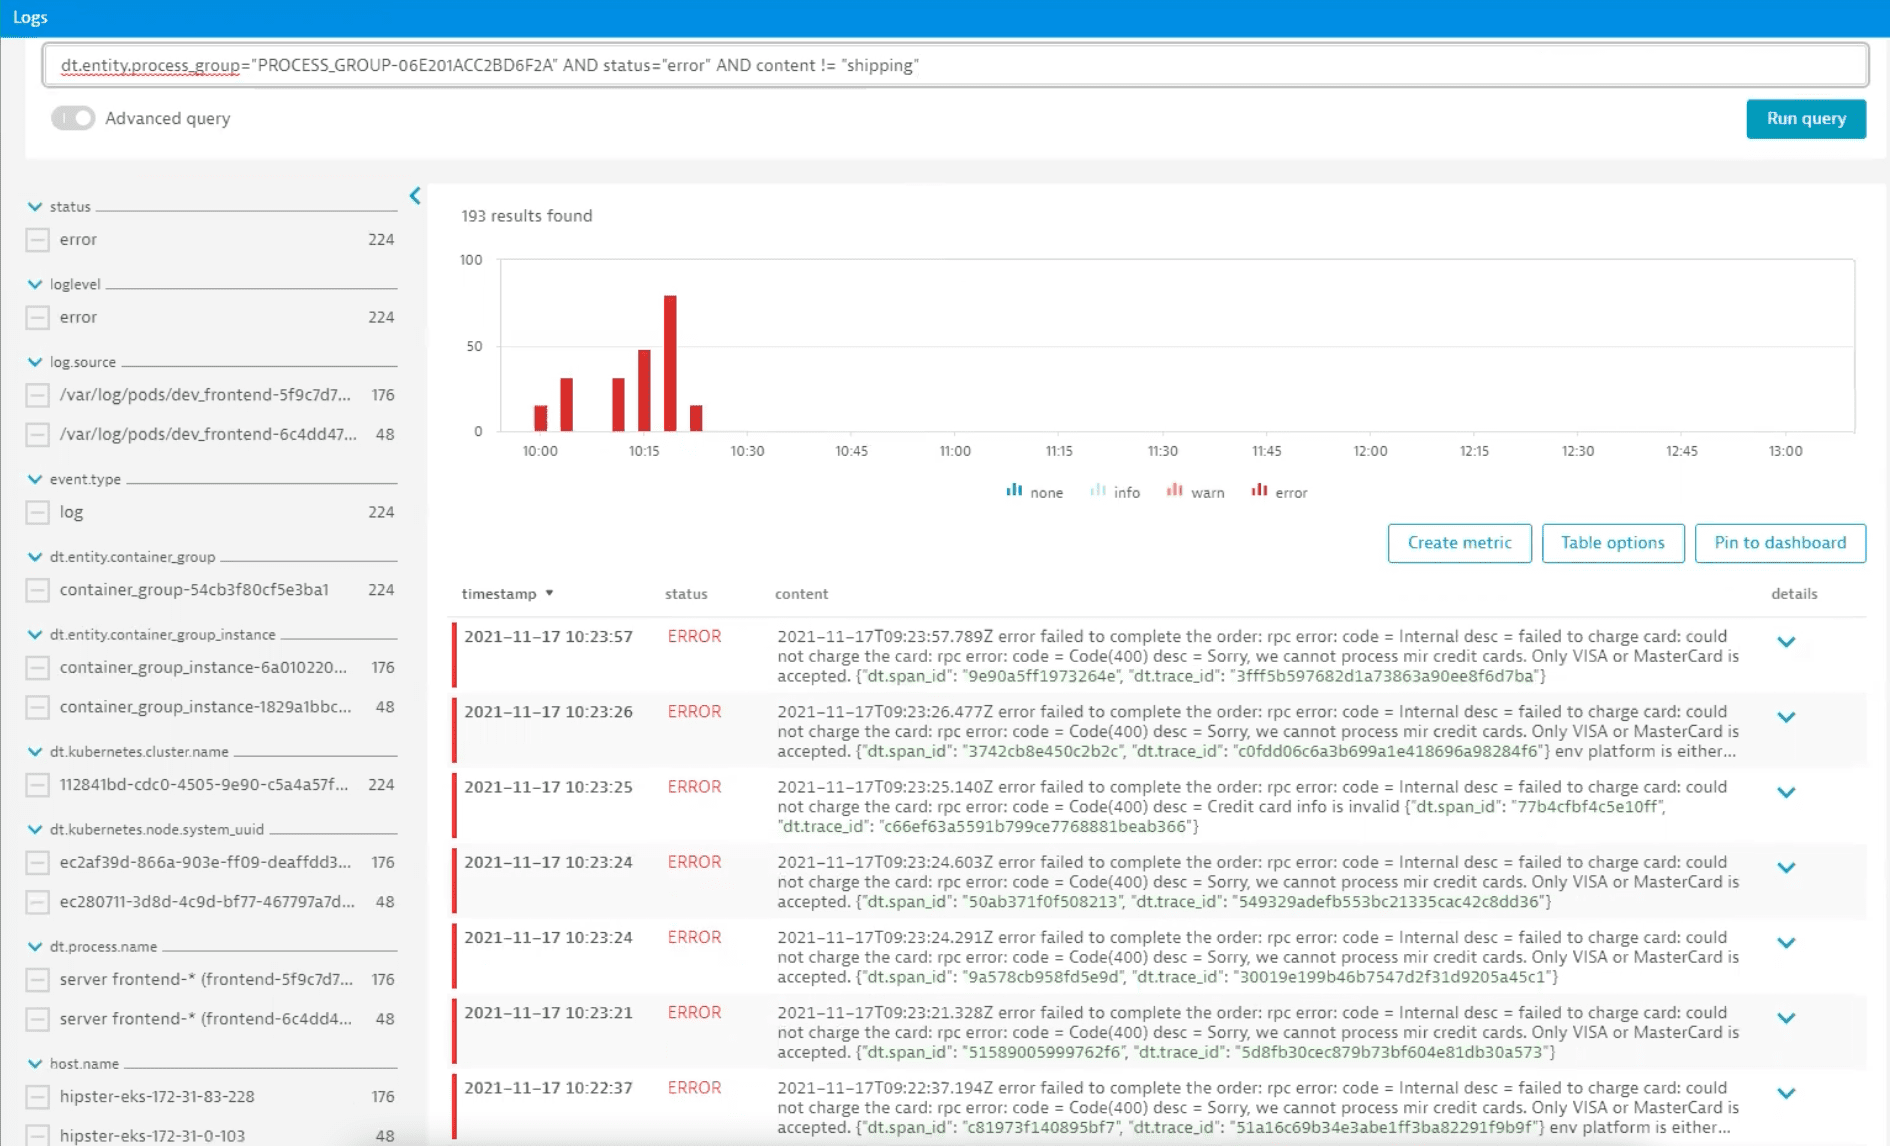
Remaining logs indicate a problem with an unsupported card type. Let's expand the log and navigate to the distributed trace.
By going through the distributed trace, we can see that the application is functioning normally and that the problems are caused by an unsupported card type.
Because this is not something we can fix in our application, we contact our payment handling provider to see how this issue can be resolved.
As a side-effect of this analysis, we notice that the card number appears in the log, so we might also contact the responsible team to change logging rules to prevent logging of sensitive information.
Analyze automatically detected problems when the root cause is service failure
In this example, we analyze an online boutique, HipsterShop. It's a cloud-native microservices demo application that allows users to browse items, add them to a shopping cart, and purchase them.
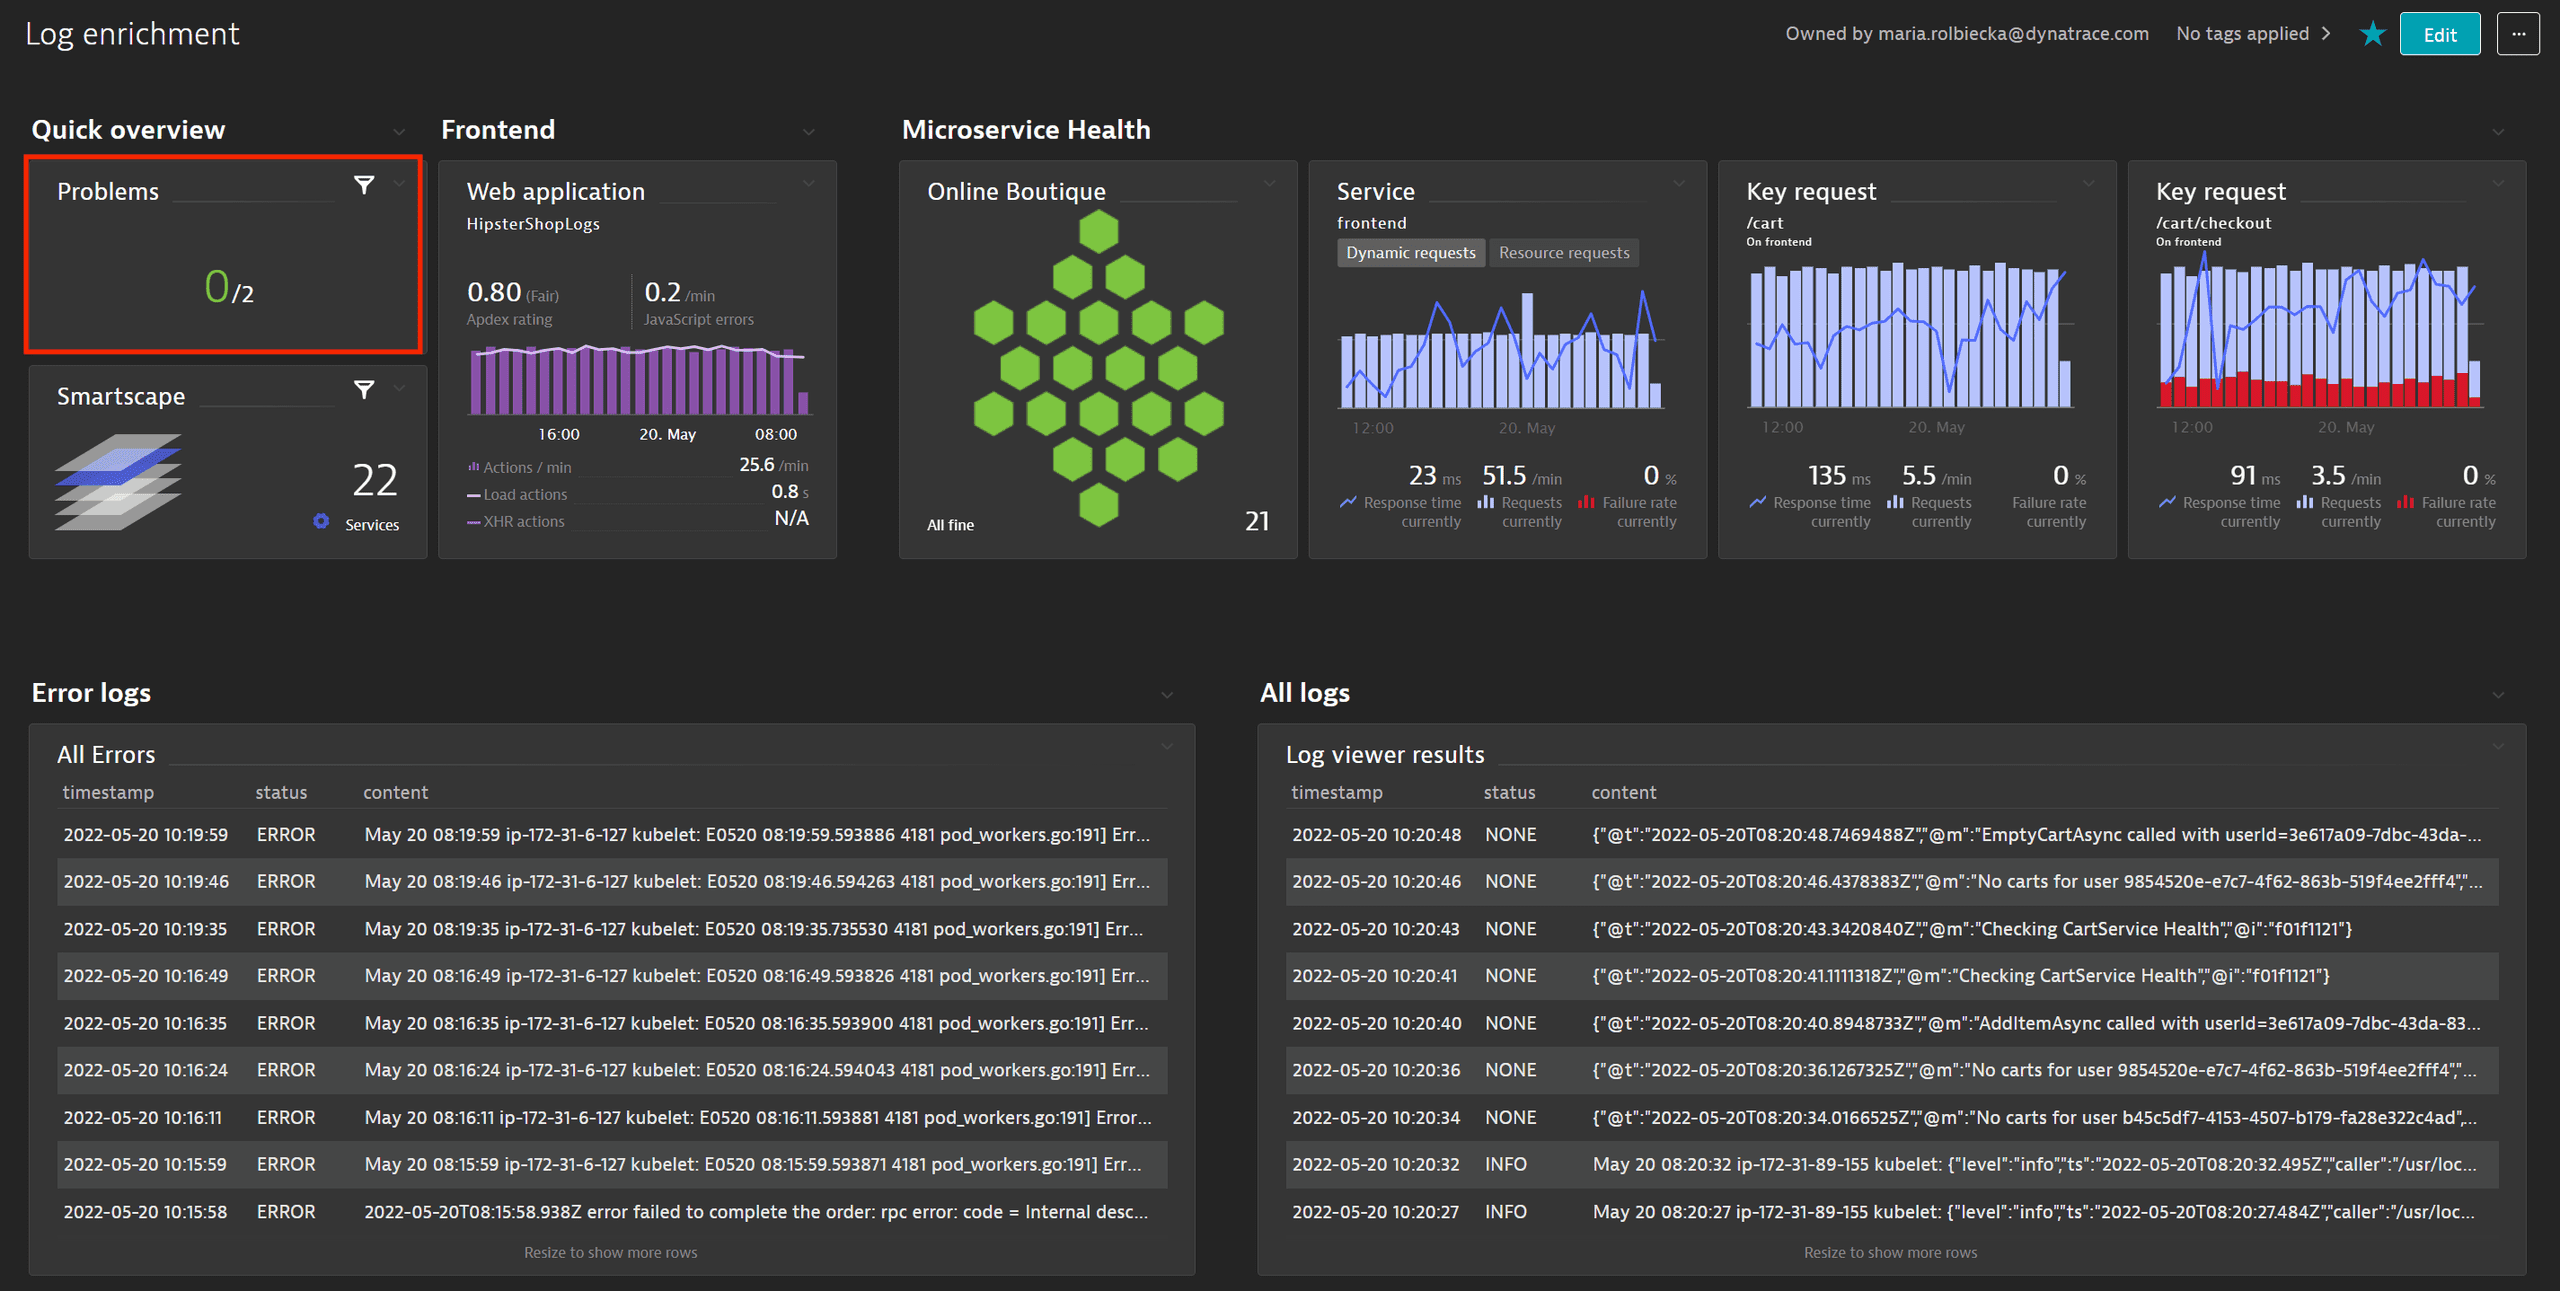
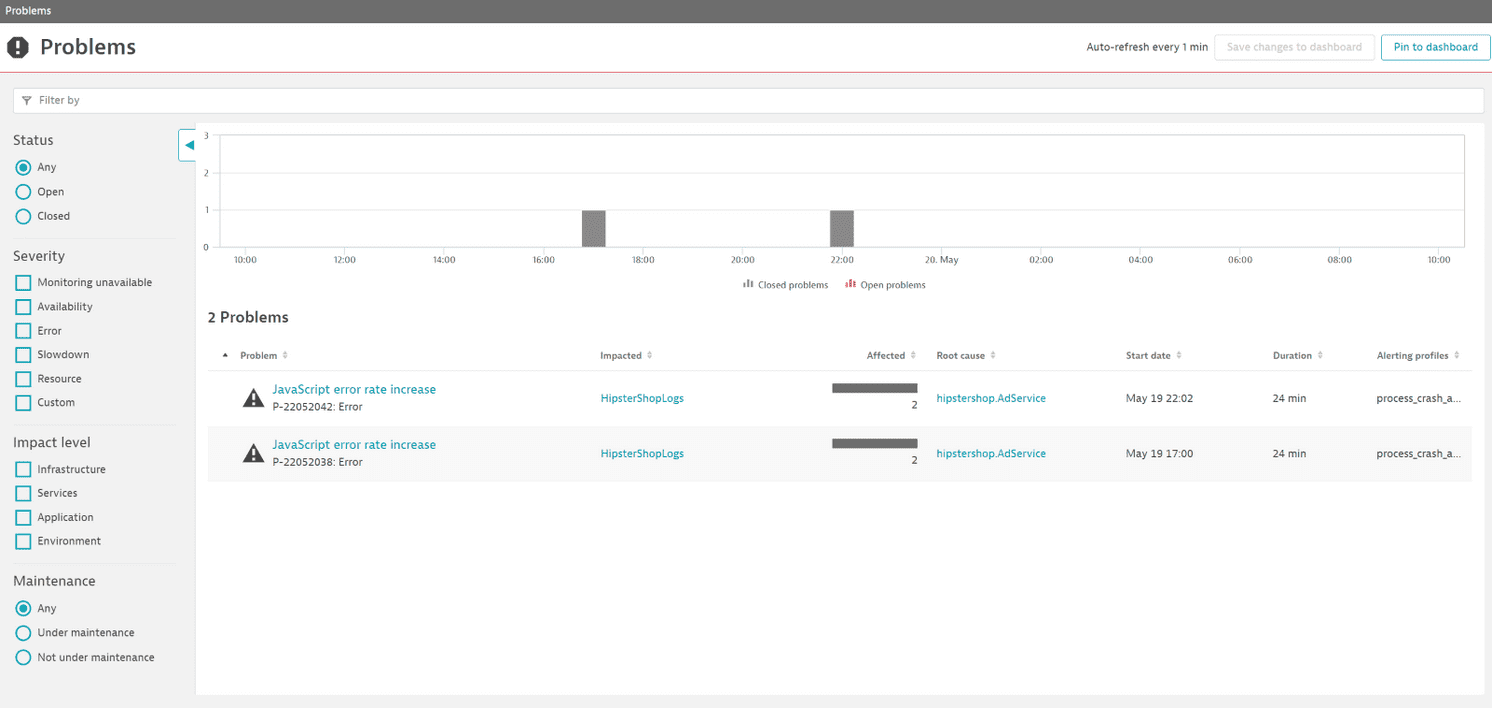
In the Dashboard, we see that two problems have been reported within a 24-hour timeframe. When we select the Problems tile to investigate them, we discover that HipsterShop has been affected by a JavaScript error rate increase that had consequences for end users. To get more details, we open the P-2205042 problem.
On the problem page, contextualized data allows us to understand the end user impact, how many users have been affected, and details about the newly occurring JavaScript error. Under Root cause, we learn that the problem originates from a configuration change on the Kubernetes workload AdService, which enables the Expanded Ads functionality.
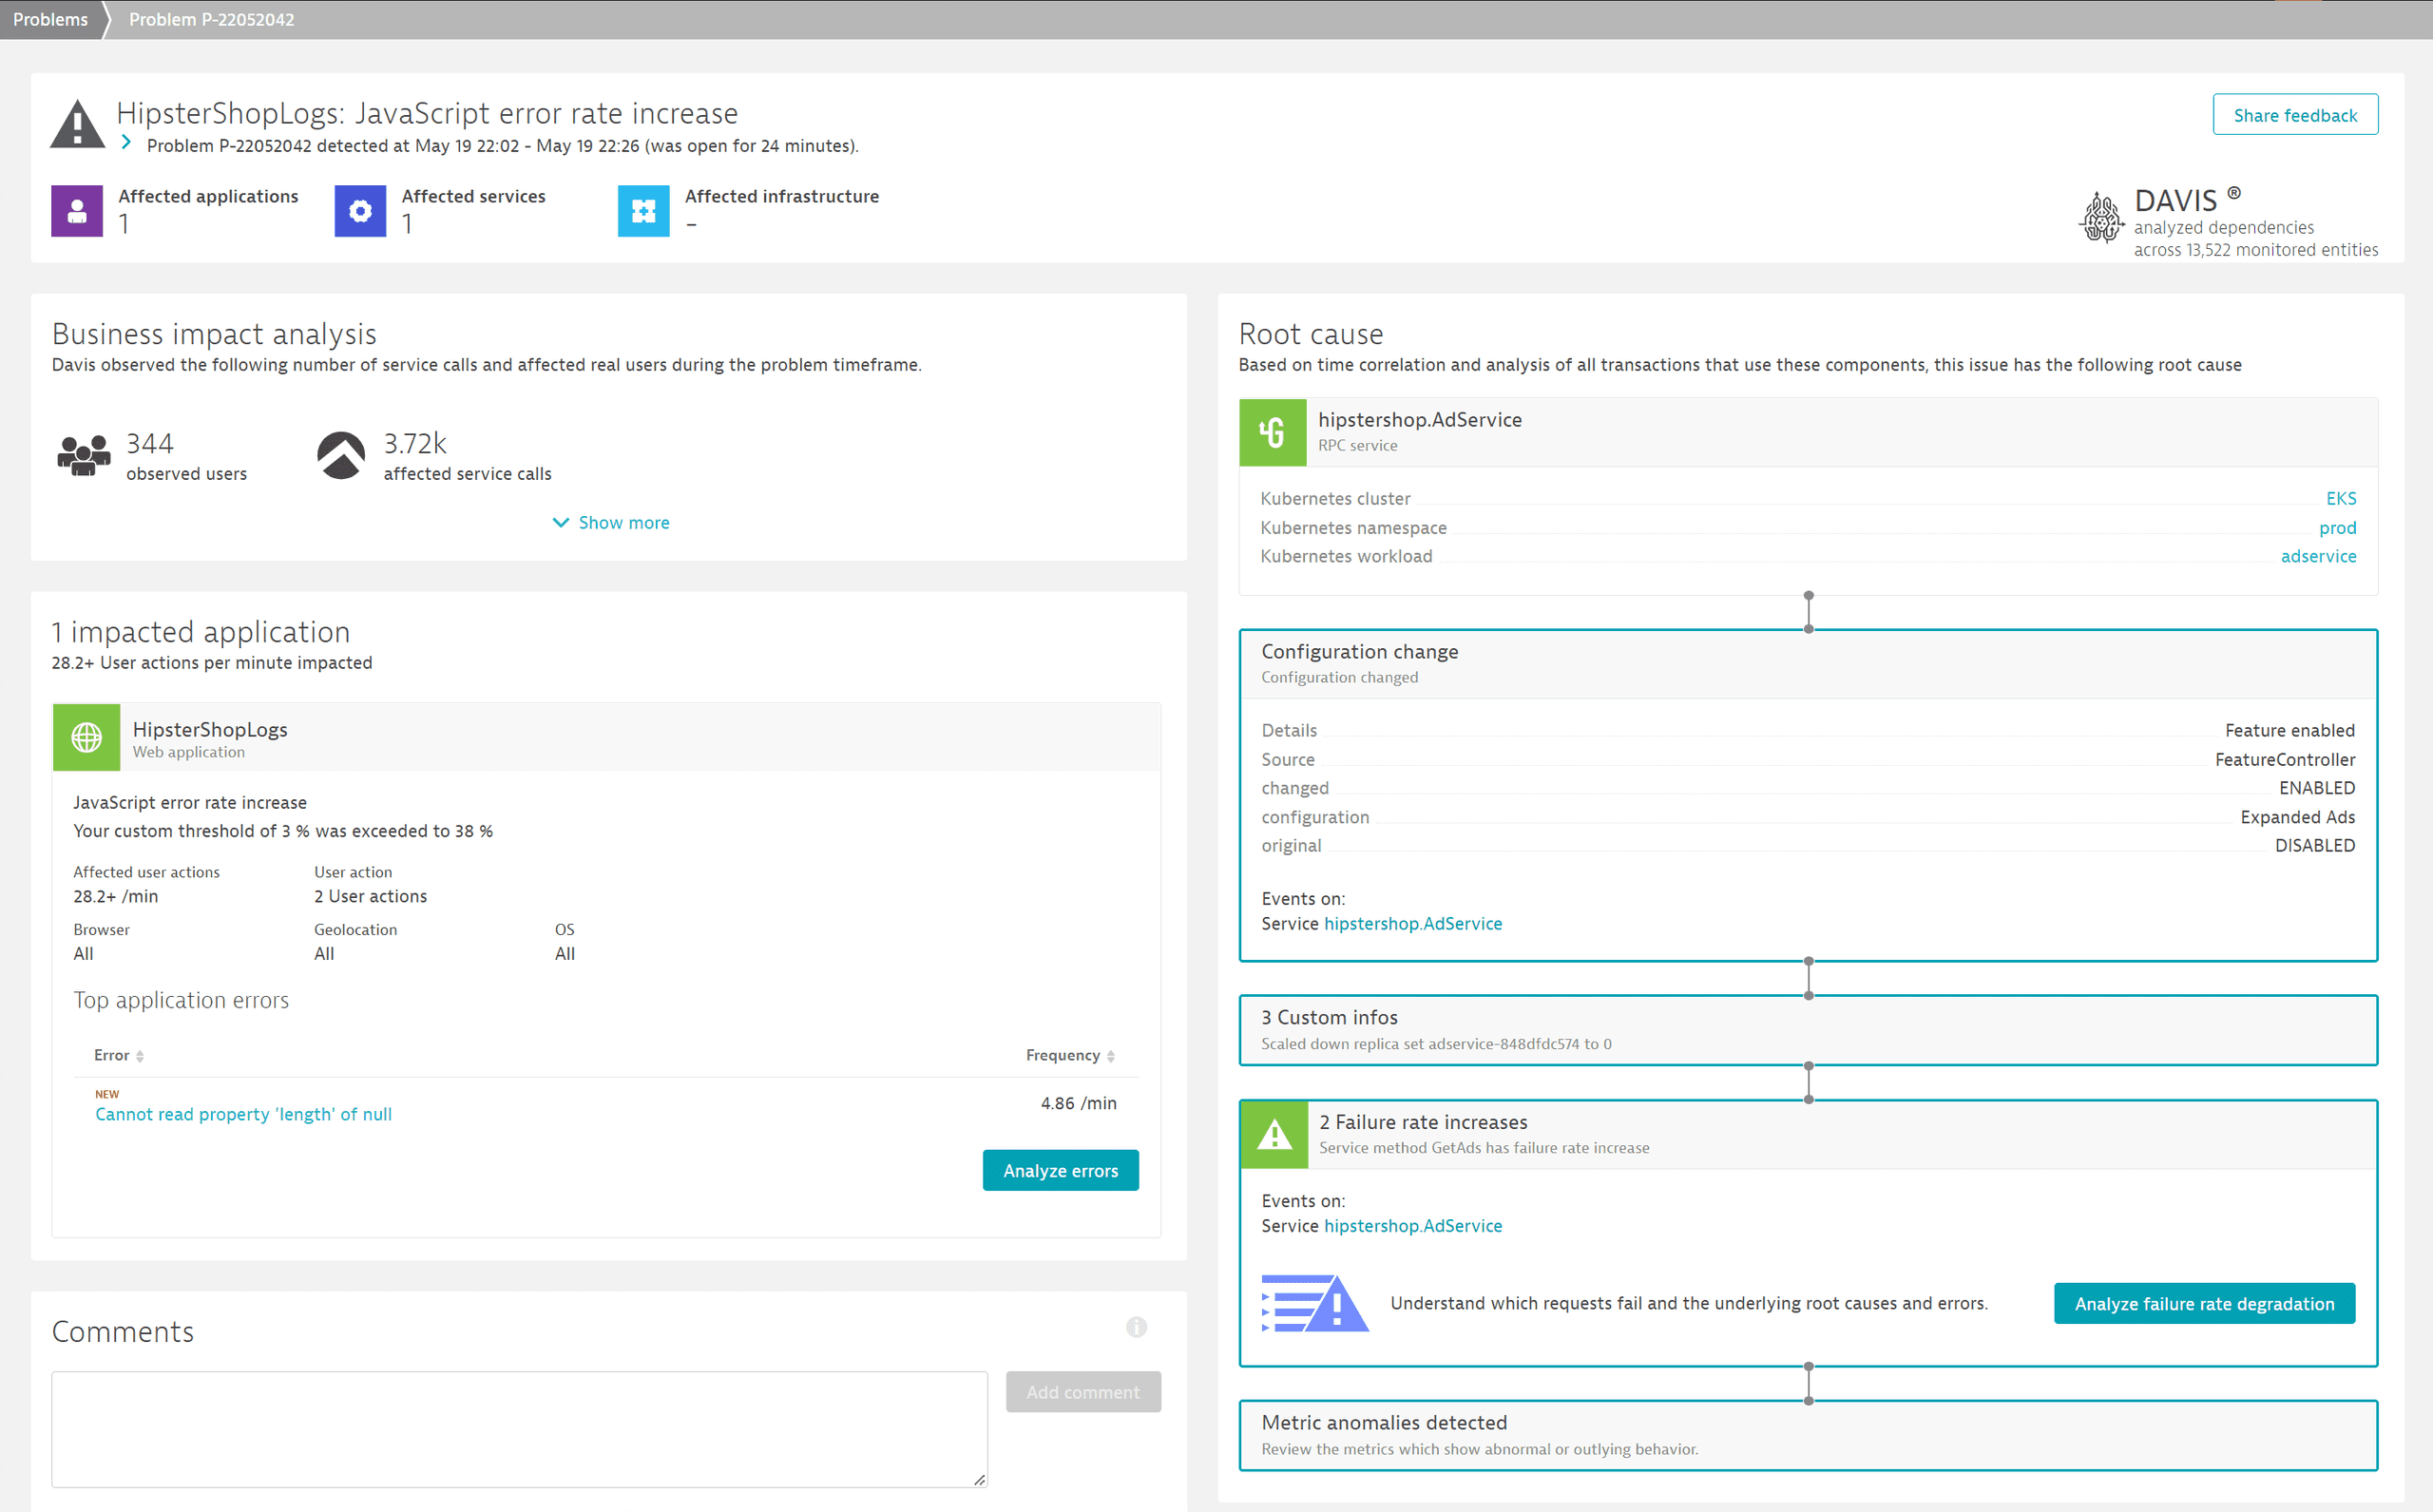
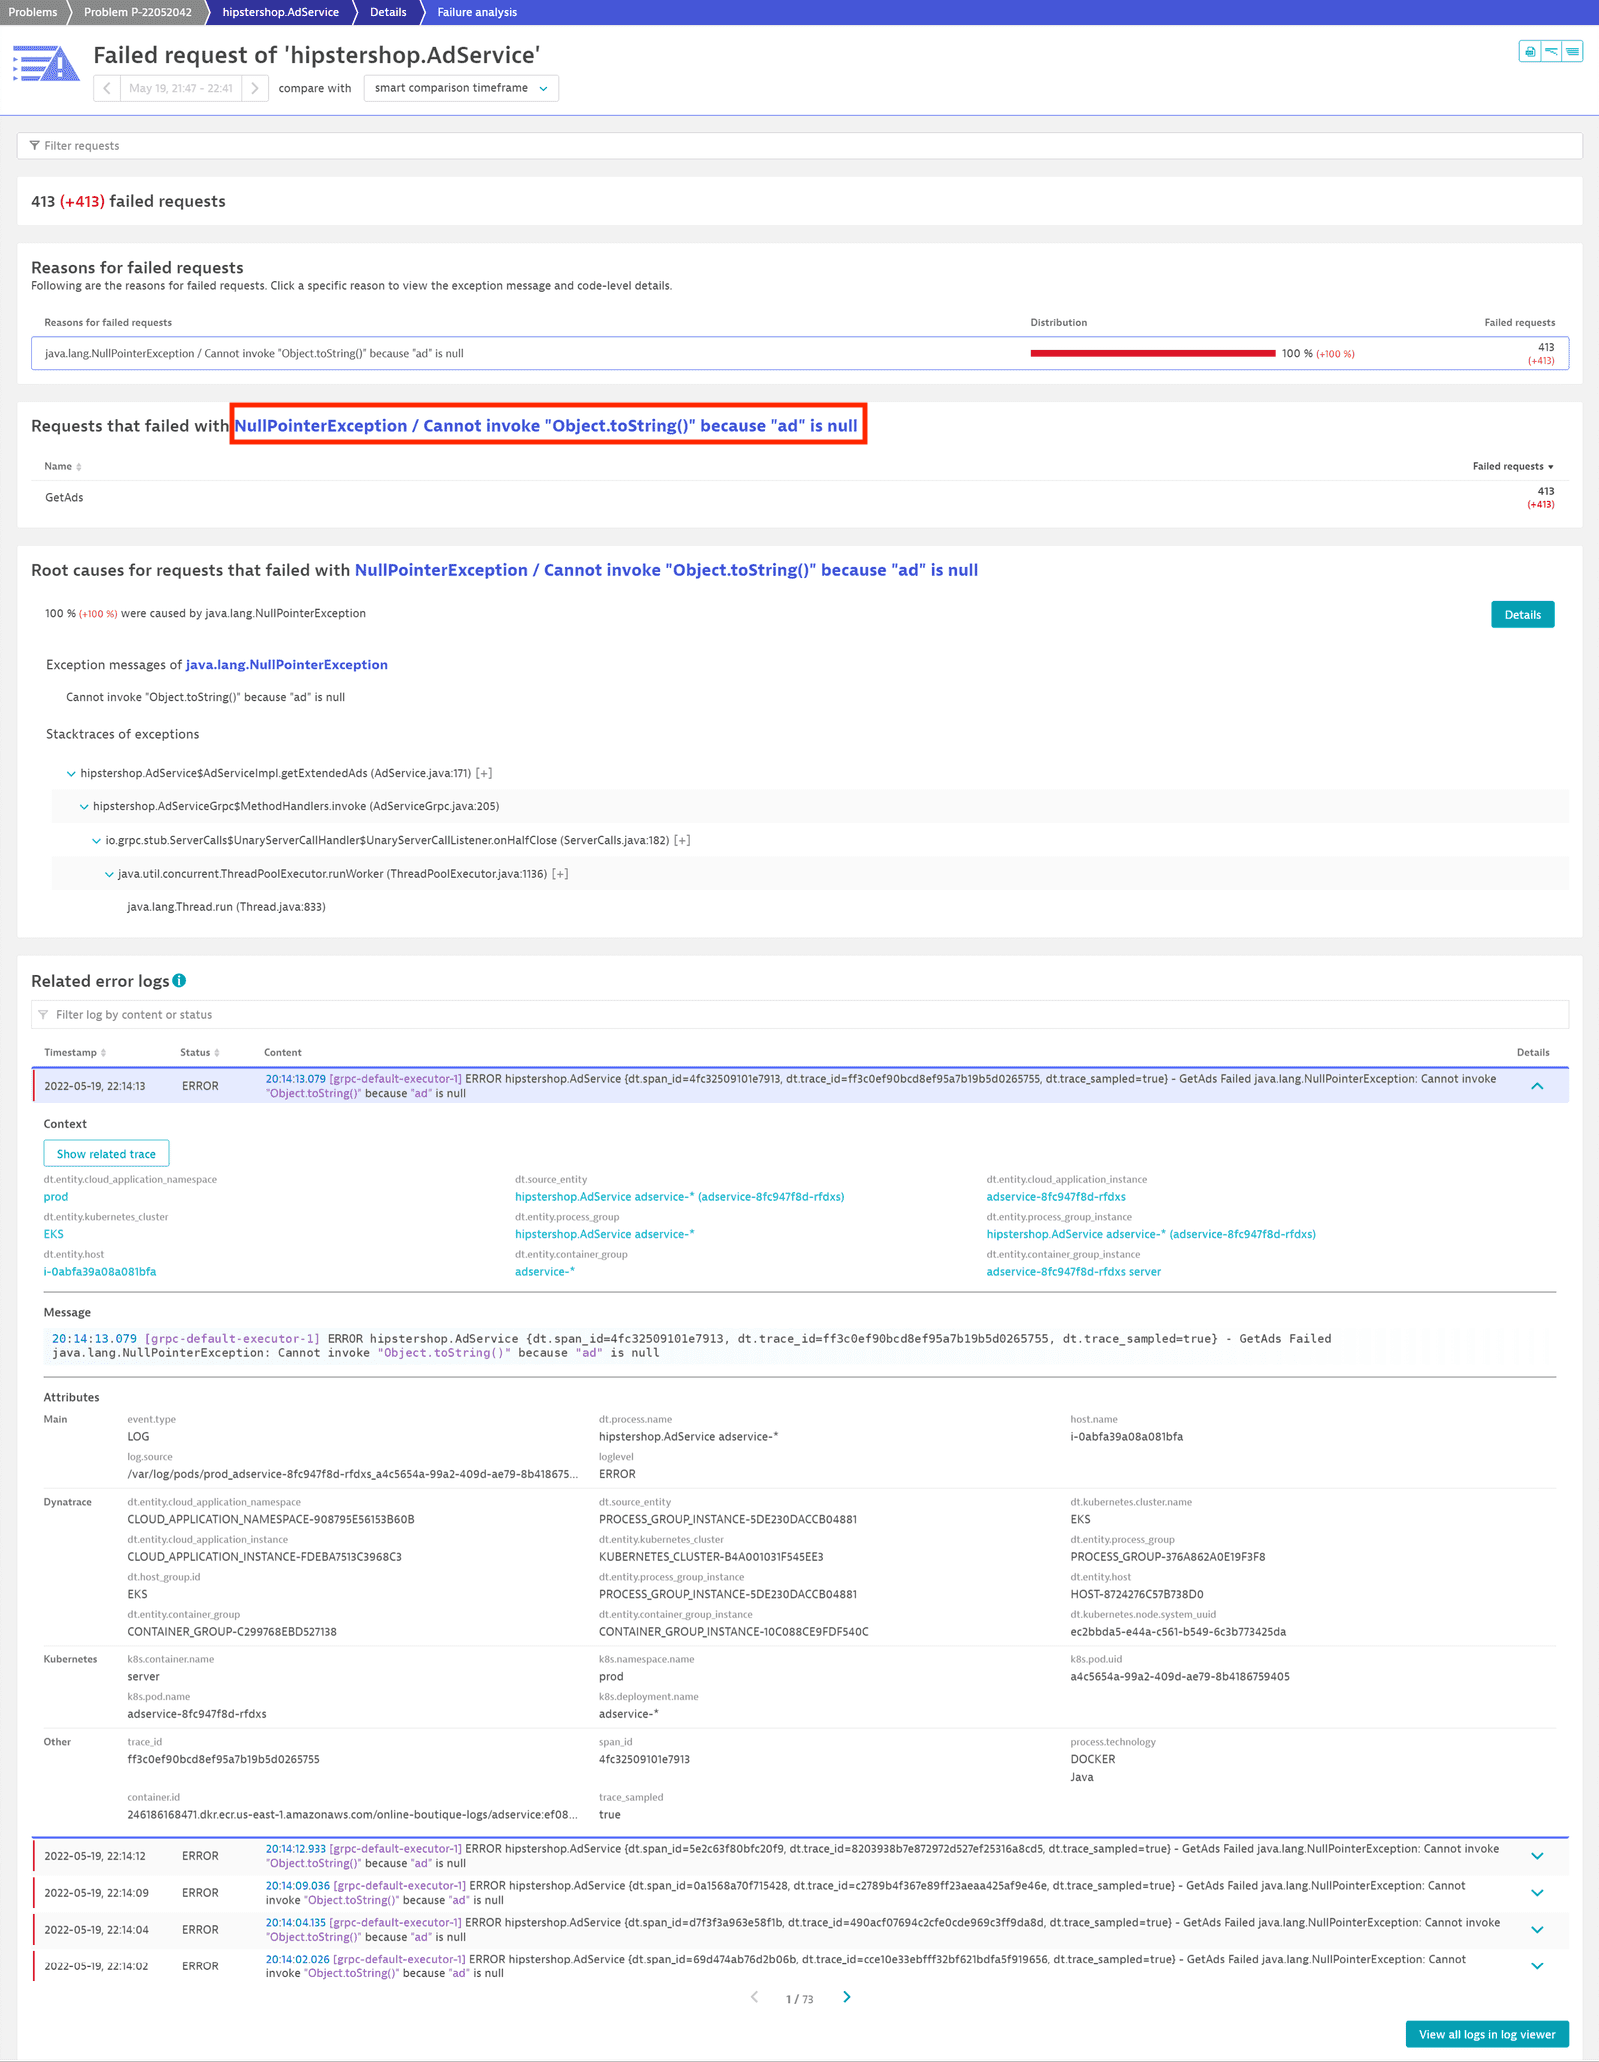
By selecting Analyze Failure rate degradation, we get an overview of all failed requests, highlighting:
- Which requests failed.
In this case, problems affected theGetAdsrequest. - Exception details related to the failed requests.
In this case,NullPointerExceptionwas thrown in theAdServicewhere an object was expected. - Related errors logs and warnings.
Logs in proactive troubleshooting (Kubernetes)
From the dashboard, we want to investigate the frontend service, which is deployed as a Kubernetes workload. To get information on the workload, we select the frontend Kubernetes workload tile.
The workload details page lists all critical health metrics for the workload, such as its CPU and memory usage and limits of the underlying pods, but also response time, failure rate, and throughput for the deployed services. When one of the services (in our case, frontend) is affected by an error, you can investigate it via the service page or, as in our case, check the Logs section.
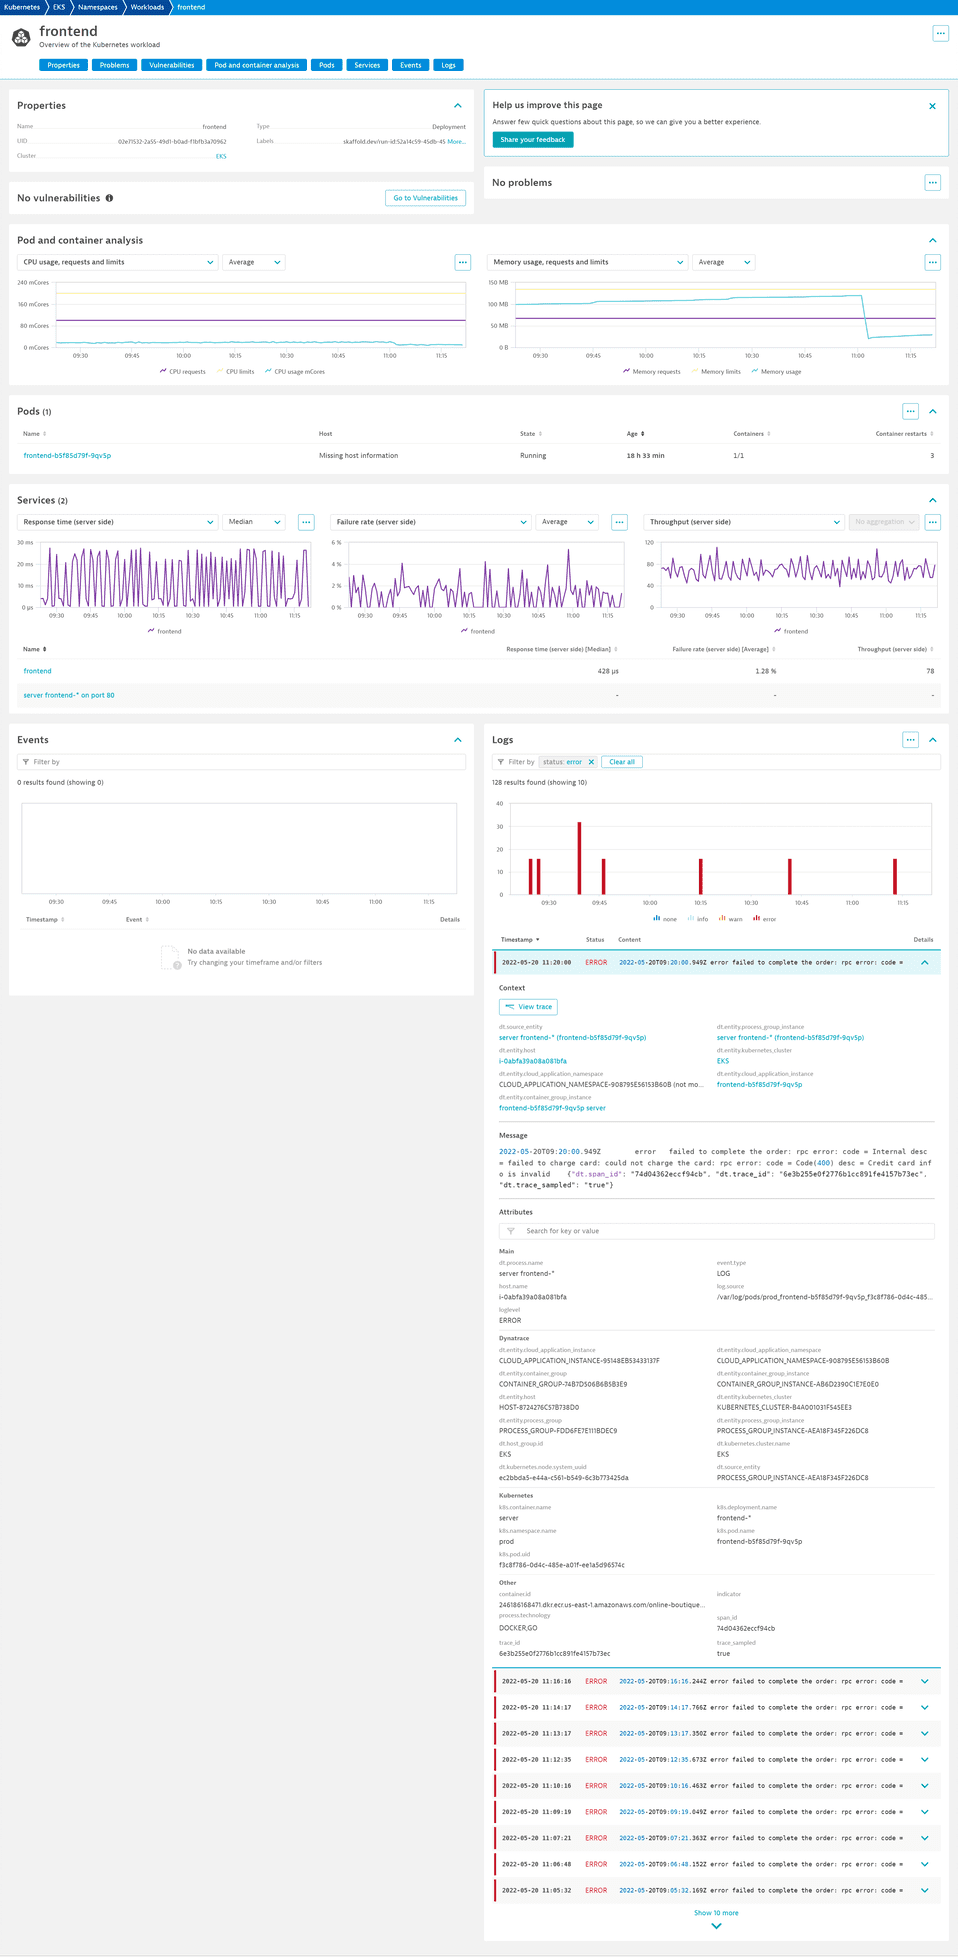
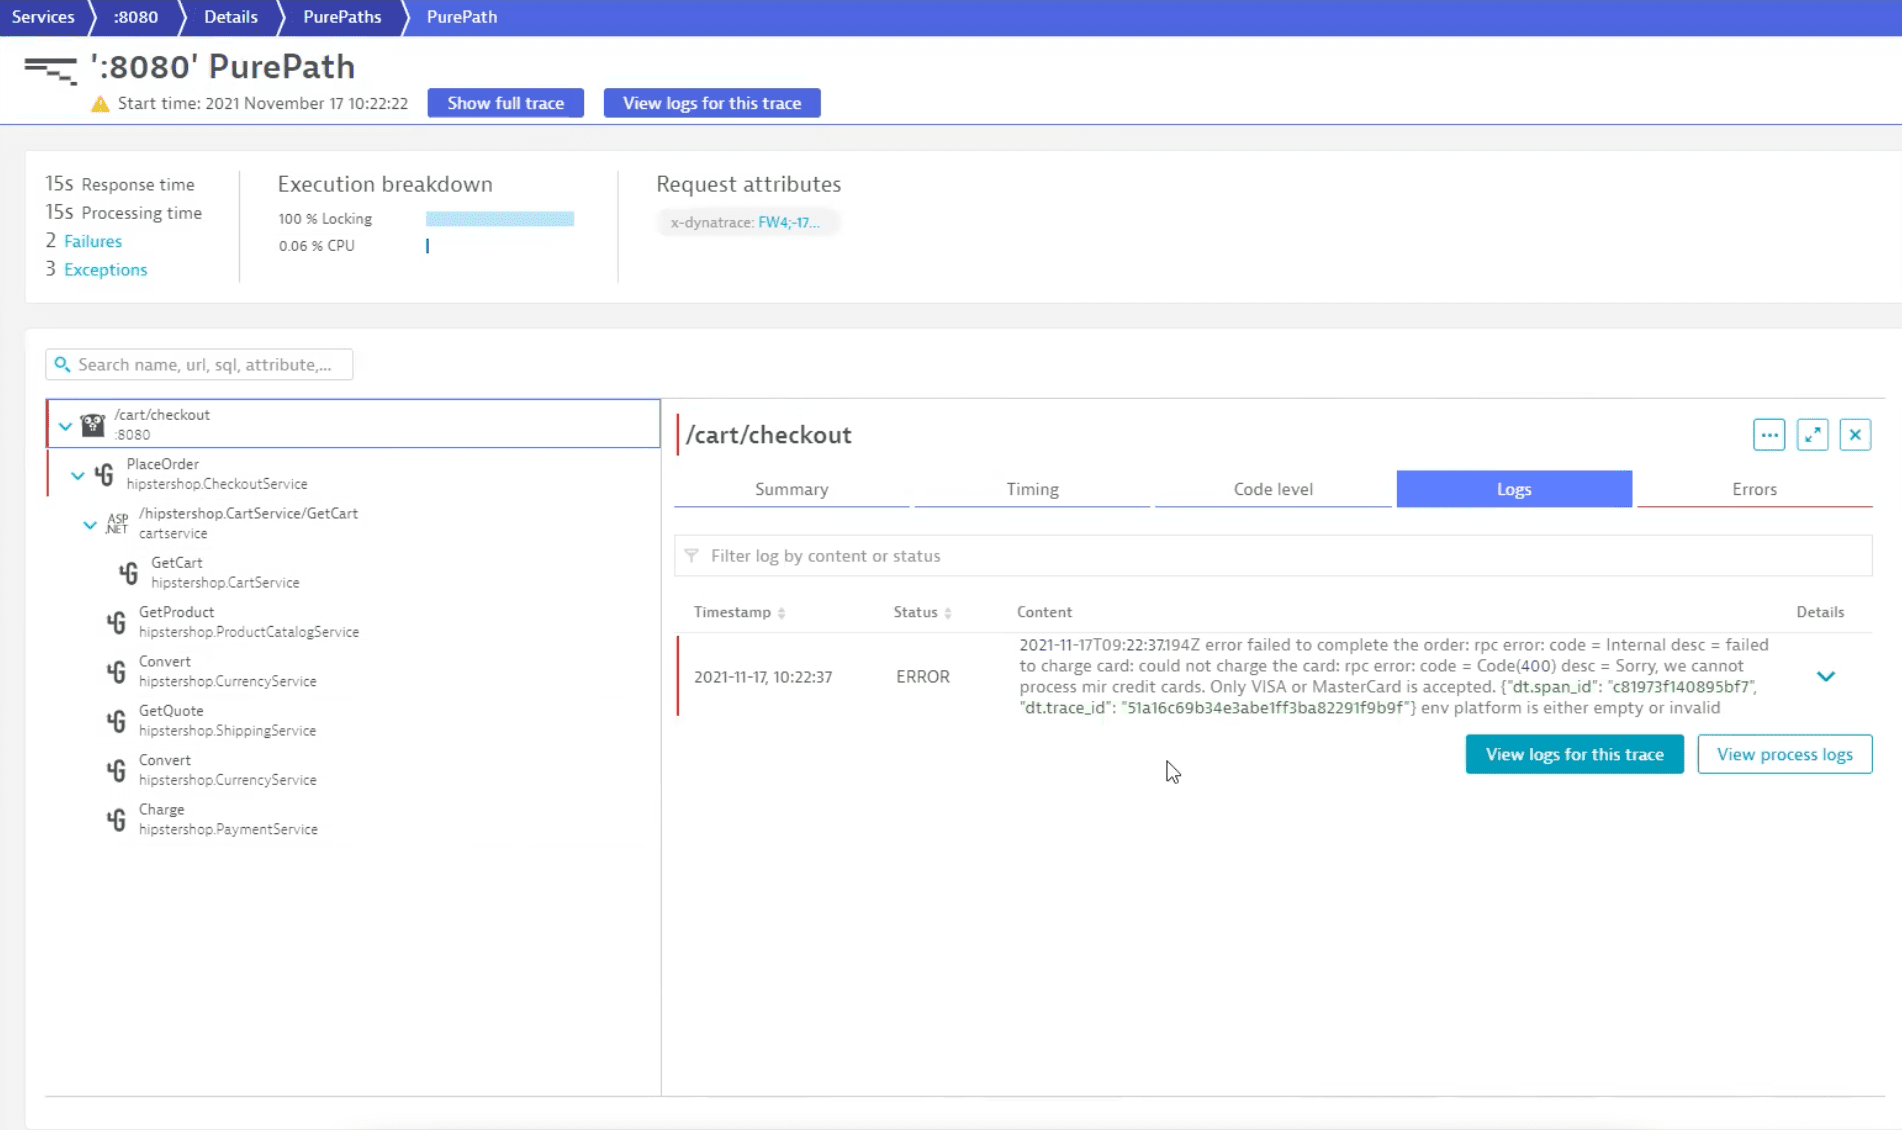
The log table shows the Status info. The red bars indicate that some errors are logged here. We can investigate them by filtering the available logs by status error. We see that all of them are related to a failed order process due to invalid or wrong credit card information. Because each of these log entries happens in the context of a distributed trace, we can also take a look at the related trace for specific log entries by selecting View trace.
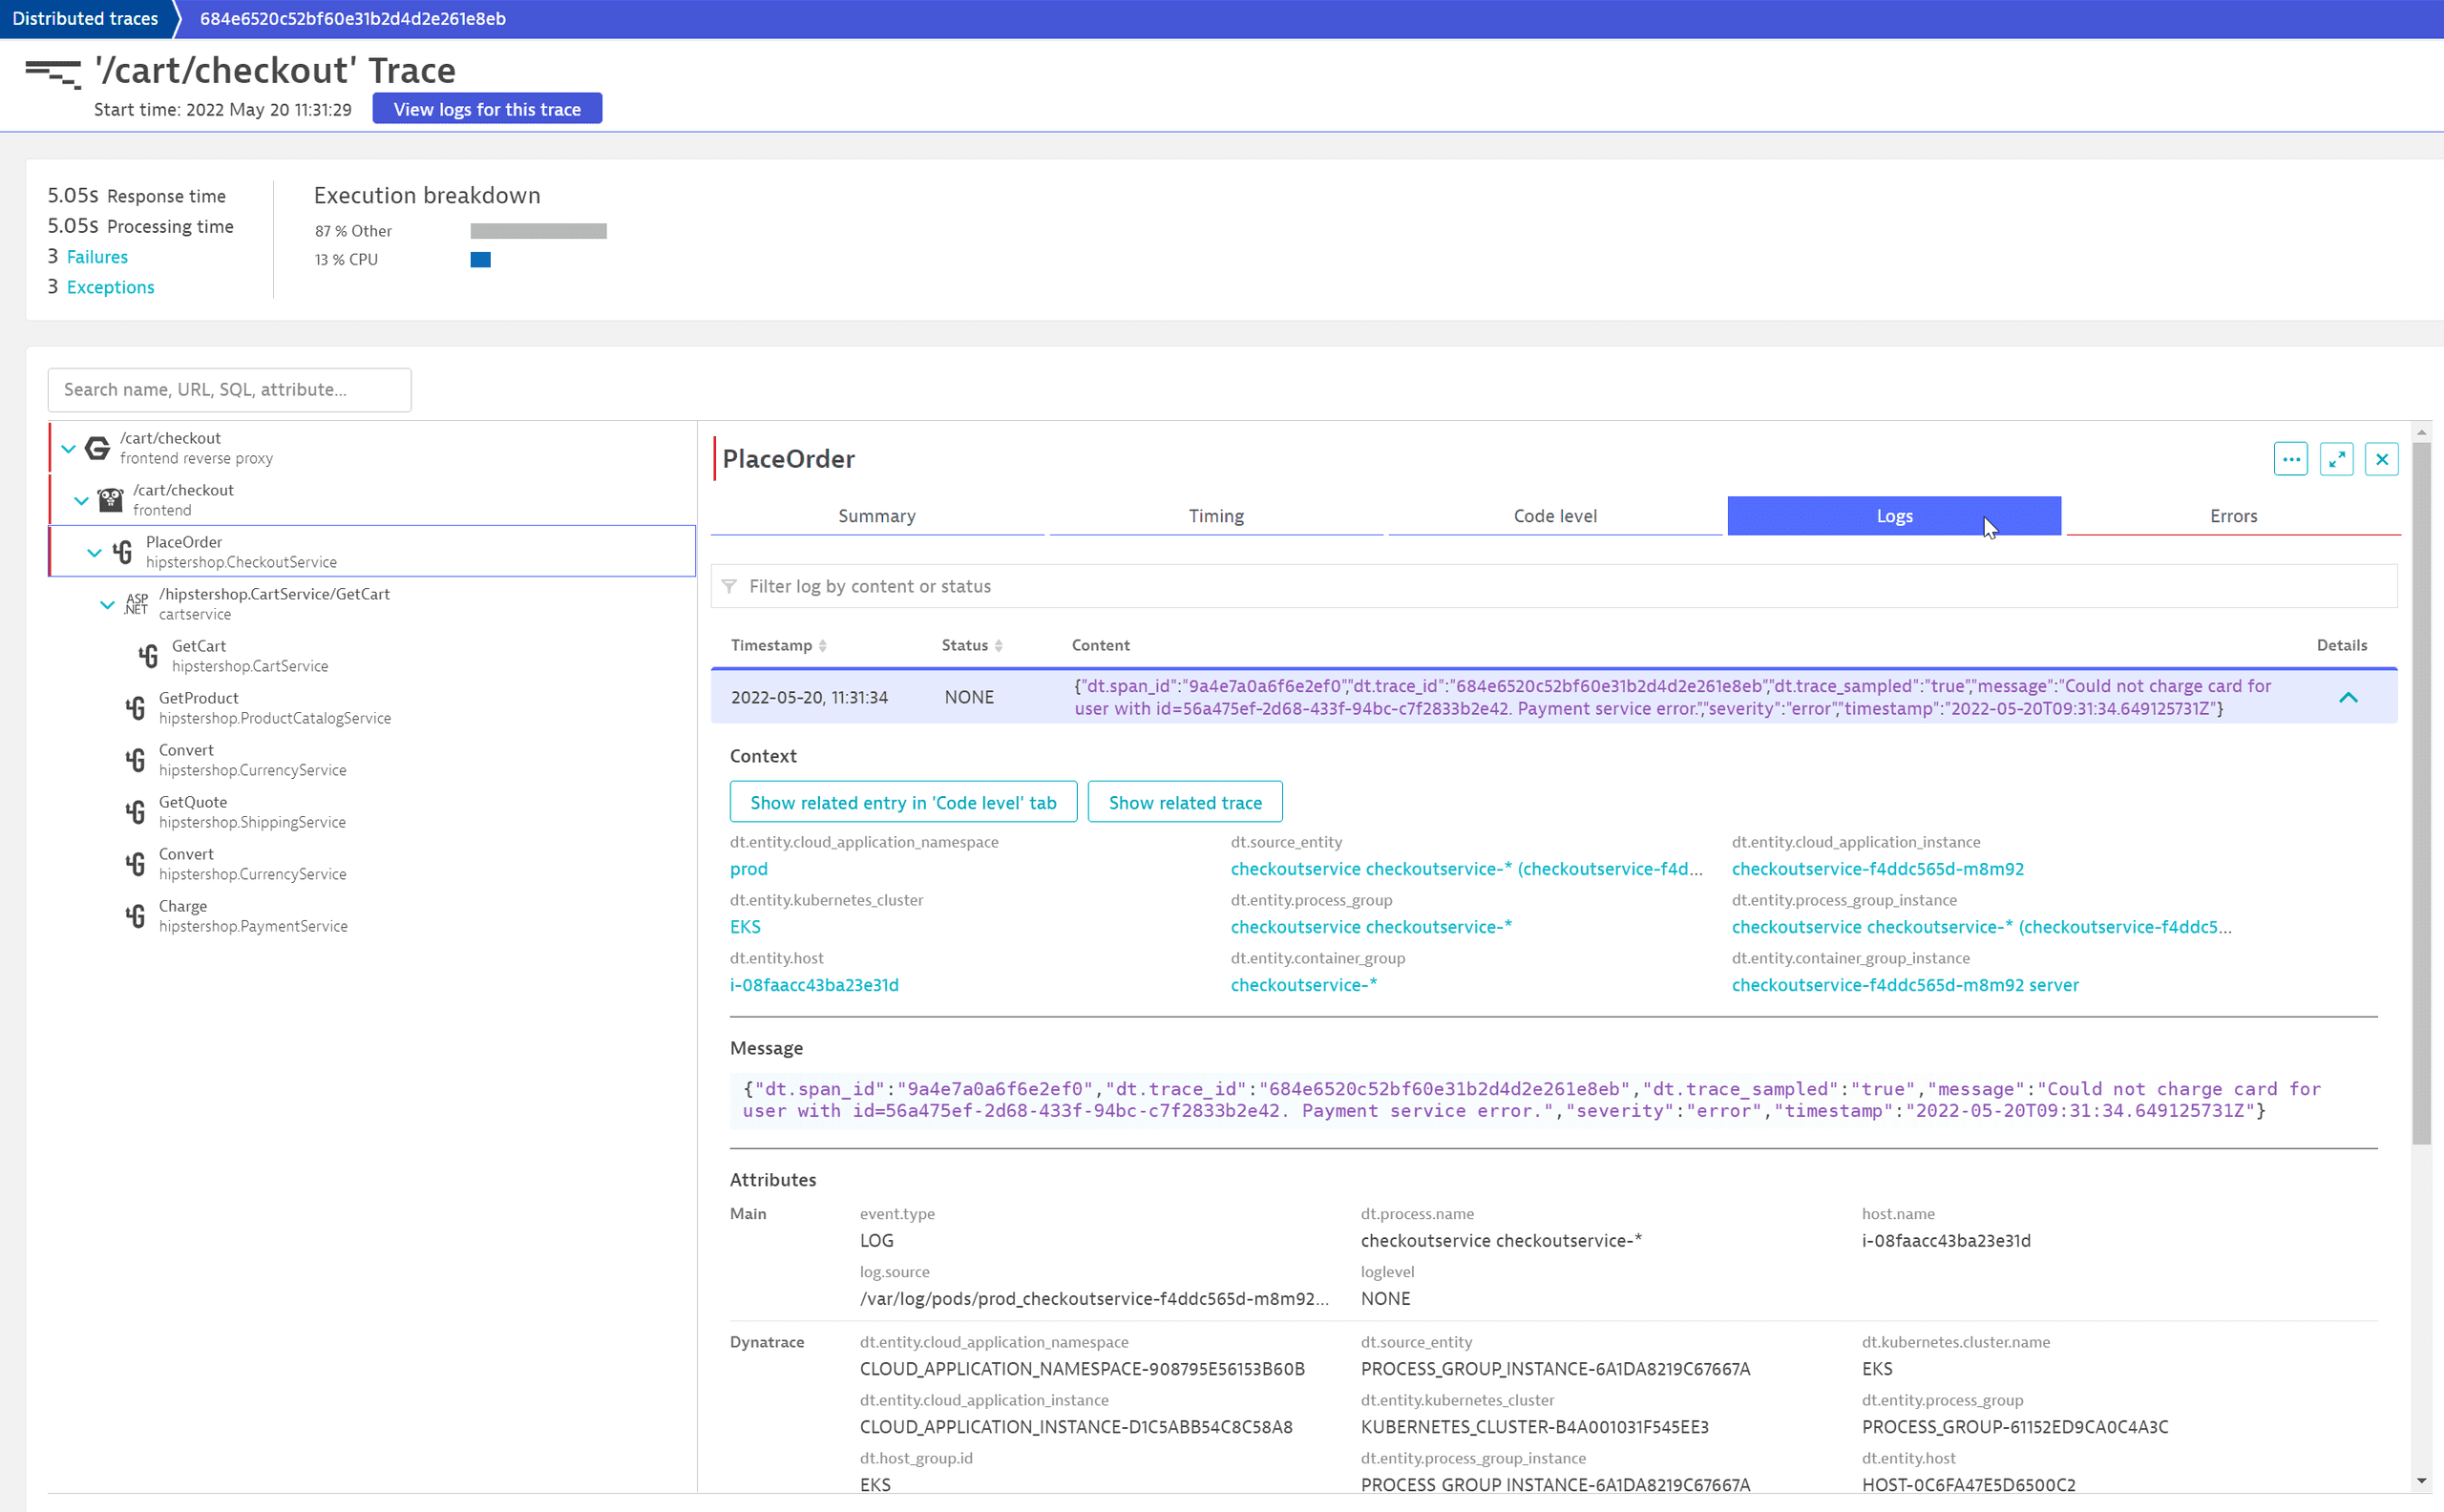
This reveals that the selected log entry on the Go-based frontend microservice is just part of a more complex error pattern. We see that it calls the PlaceOrder method of the hipstershop.CheckoutService downstream. By selecting this service, we can see that OneAgent automatically collects additional helpful information, for example, the fact that it is a gRPC call. By selecting the Logs tab we can see that during this call two log entries have been created, including the error message. Selecting Show related entry 'Code level' tab, we can also understand in which part of their Go microservice the specific logline was generated.
By selecting the NGINX frontend reverse proxy row, we can see that the call returned a 500 – Internal Server Error to the client, which doesn't seem to be the correct error code for wrong credit card information.
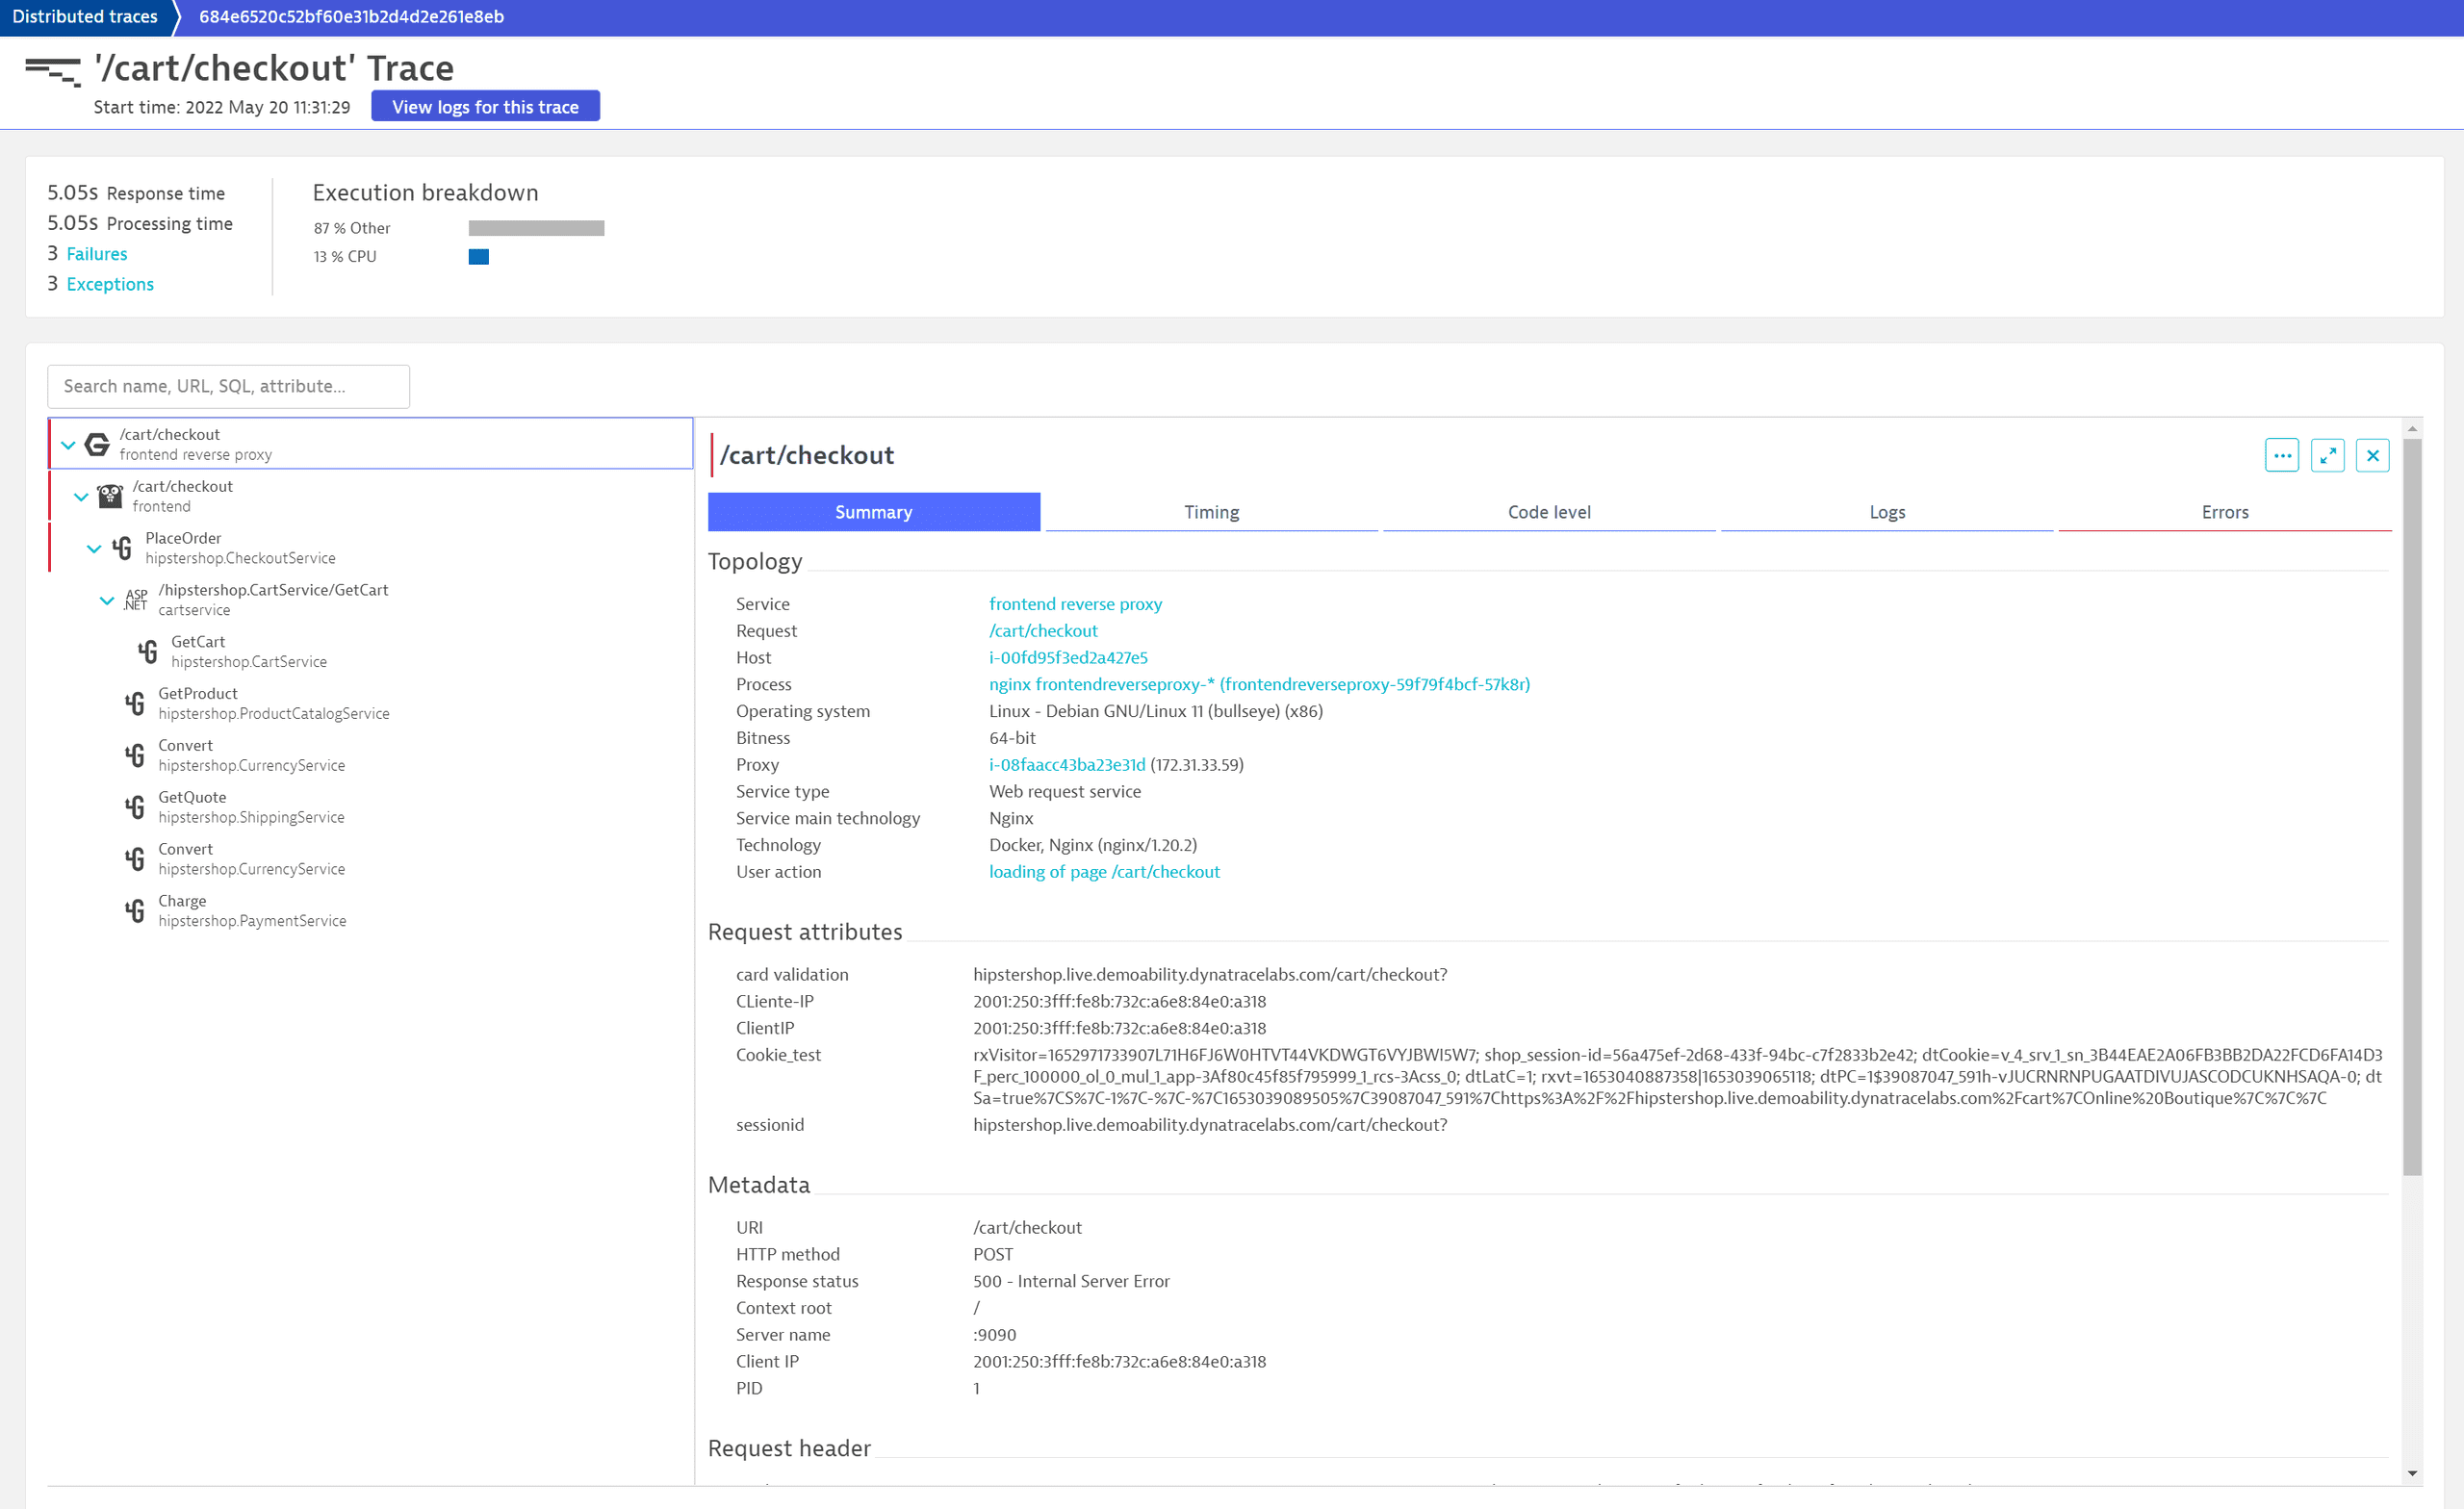
It now makes sense to discuss this behavior with the developers and see whether the HTTP 400 would be a better code and to double-check the frontend app to see if this case is properly handled in the web UI.
Frequently asked questions
You need both log monitoring and trace pricing and packaging.
| Your technology is monitored via OneAgent | Learn more about pricing and packaging |
|---|---|
|
|
|
|
OneAgent can automatically contextualize log data with traces for supported logging frameworks via OneAgent features.
If the technology isn't monitored via OneAgent or not supported out of the box yet, you can leverage open standards to enrich your log entries with the corresponding context information.
OneAgent can automatically connect your logs generated by the most prominent log frameworks for Java, .NET, Golang, Node.js, and PHP. Additionally, OneAgent can automatically enrich your logs for the Apache and NGINX web server.
If your technology is not monitored via OneAgent, you can leverage open standards to enrich your log entries with the corresponding context information.
If the technology is not supported out of the box yet, you can leverage open standards to enrich your log entries with the corresponding context information.
Yes. To learn how, see Connect your log data to user sessions and Session Replays.