PurePath® error analysis
Analyzing individual requests is often a useful way of gaining a better understanding of detected errors.
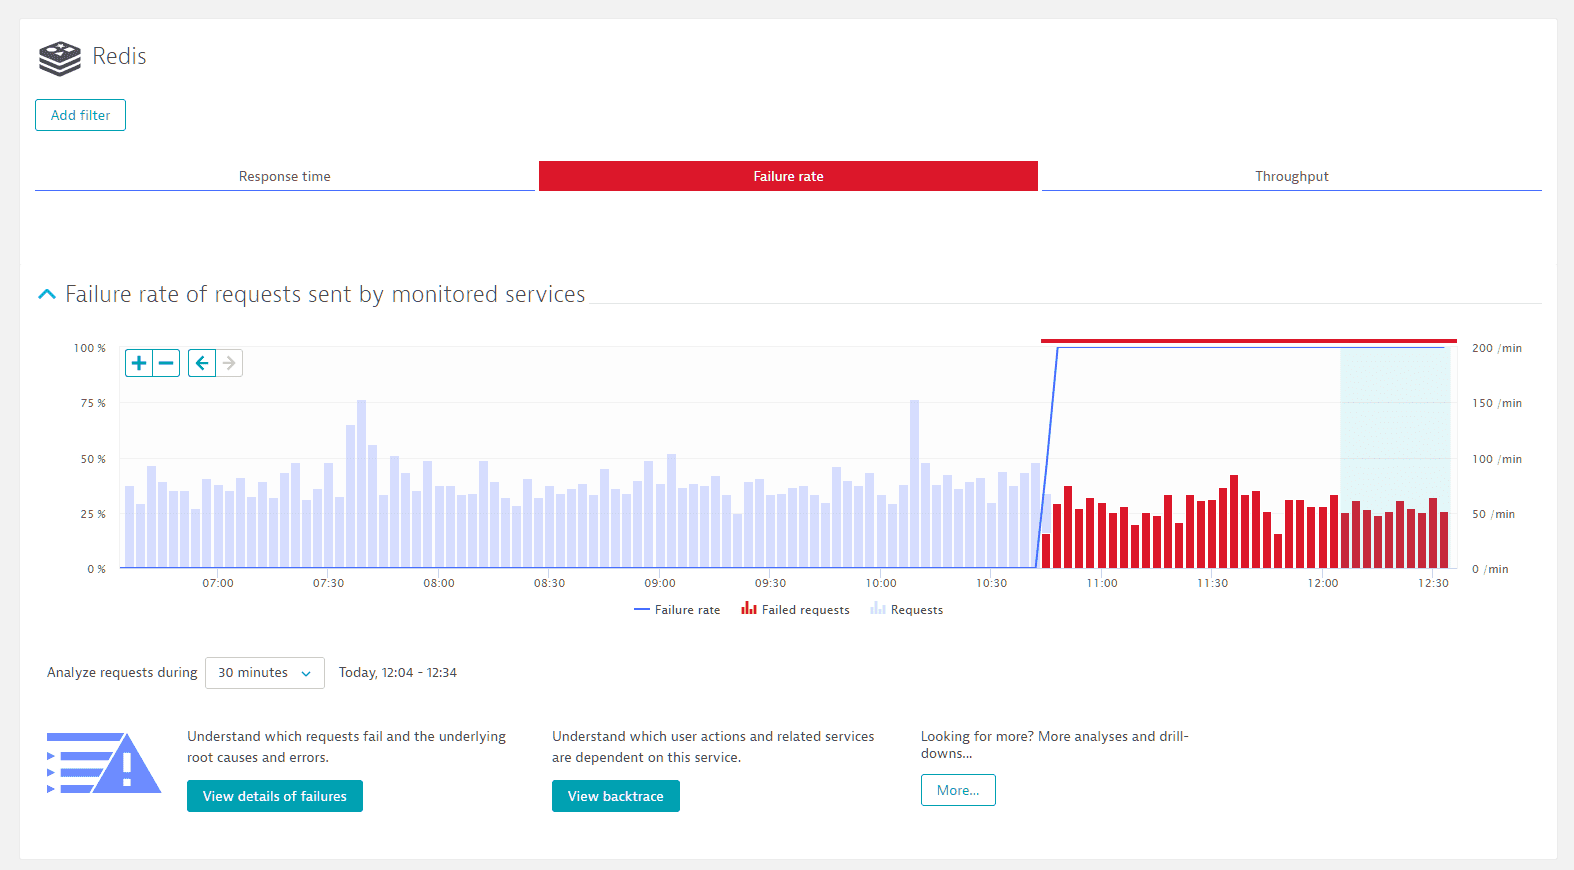
In the image below, you can see that requests to Redis started to fail around the 10:45 mark on the timeline. To find the Failure rate tab, go to the service’s details page and select a View button (such as View requests, View dynamic requests, or View resource requests).
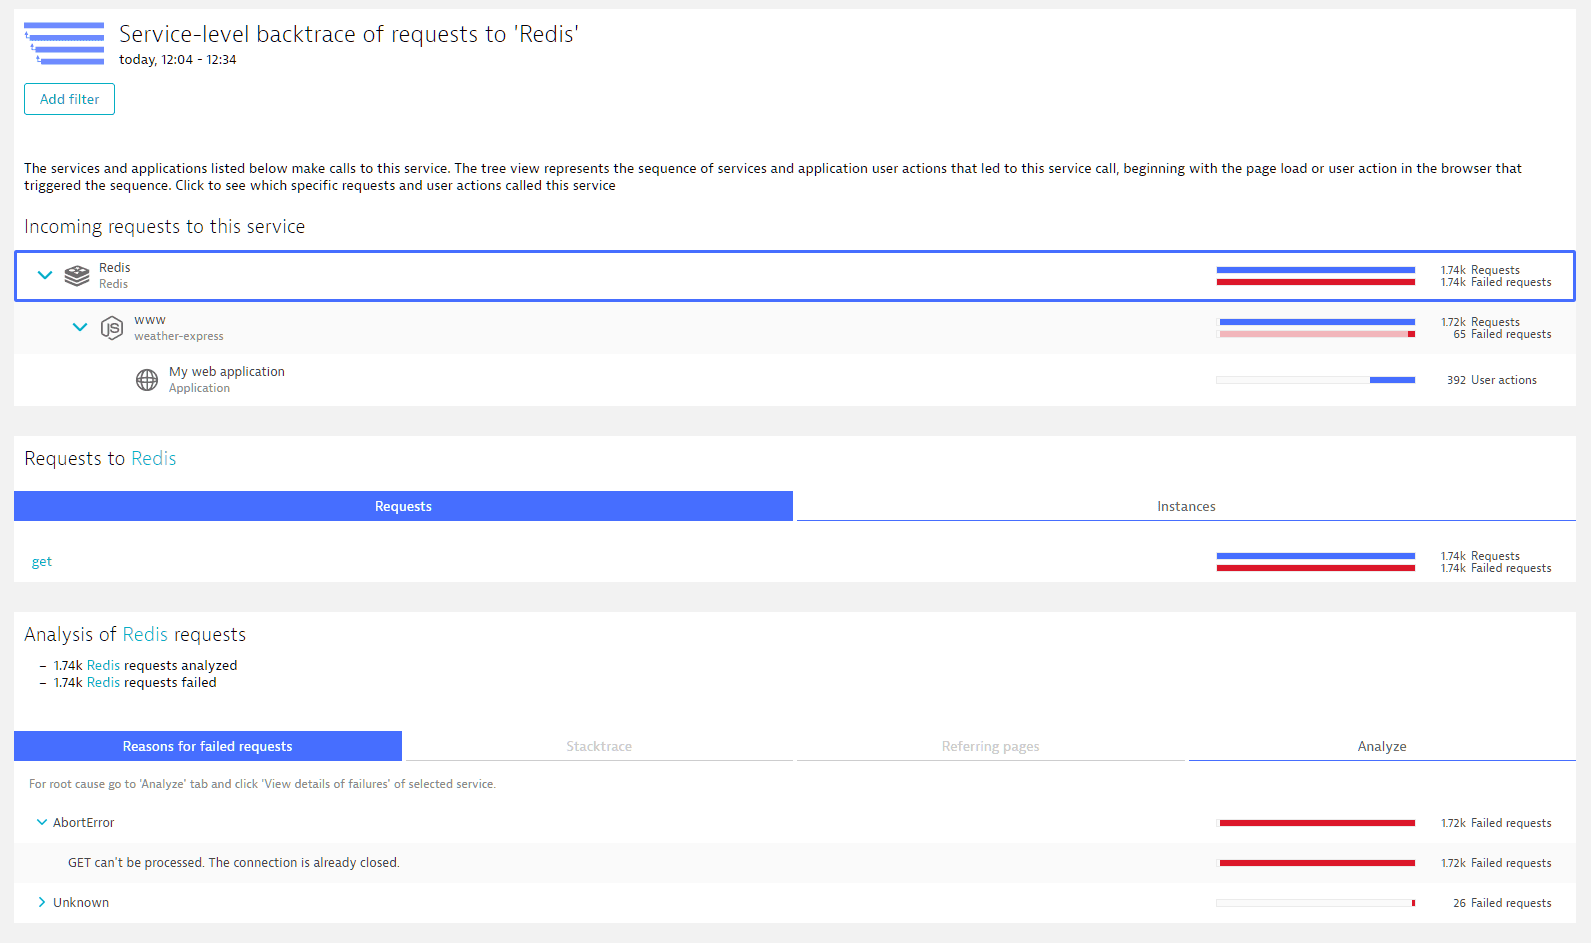
Select Analyze backtrace to see where these requests came from. We can now see that all of these requests originate in the weather-express service. We also see that nearly all failed Redis calls have the same Exception—an AbortError caused by a closed connection.
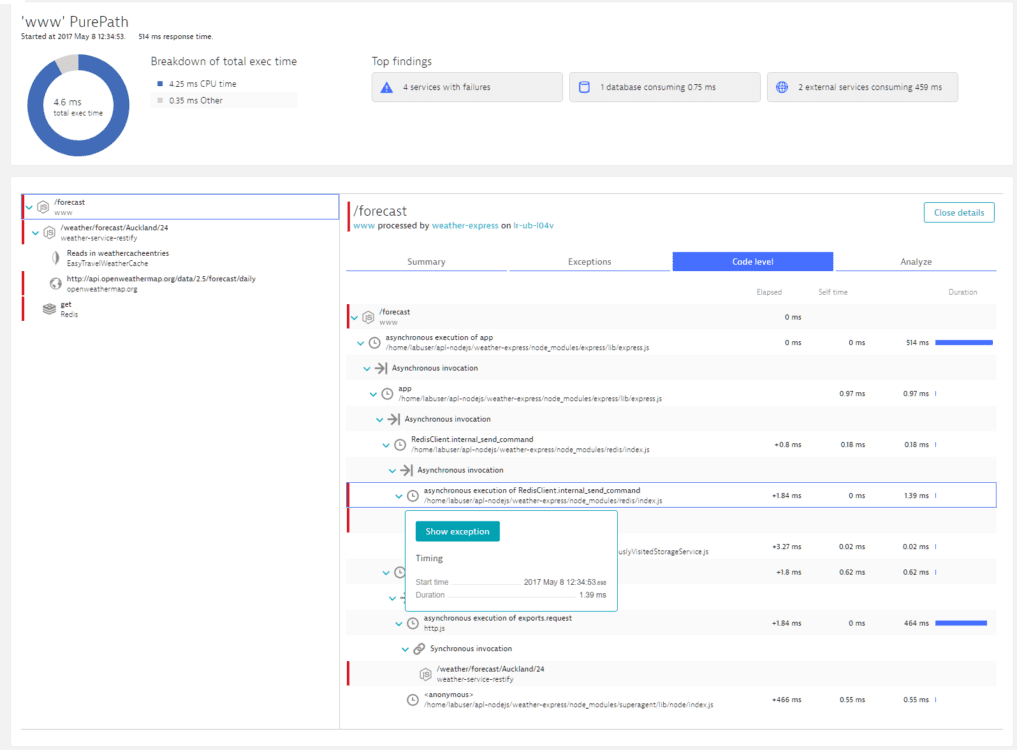
To analyze down to the affected Node.js traces, you can select More (…) > Distributed traces. You can see such a Node.js trace and its code-level execution tree below. Note that the Redis method call leads to an error. You can see where this error occurs in the flow of the Node.js code.
We can also analyze the exception that occurs at this point in the request—select the Errors tab.
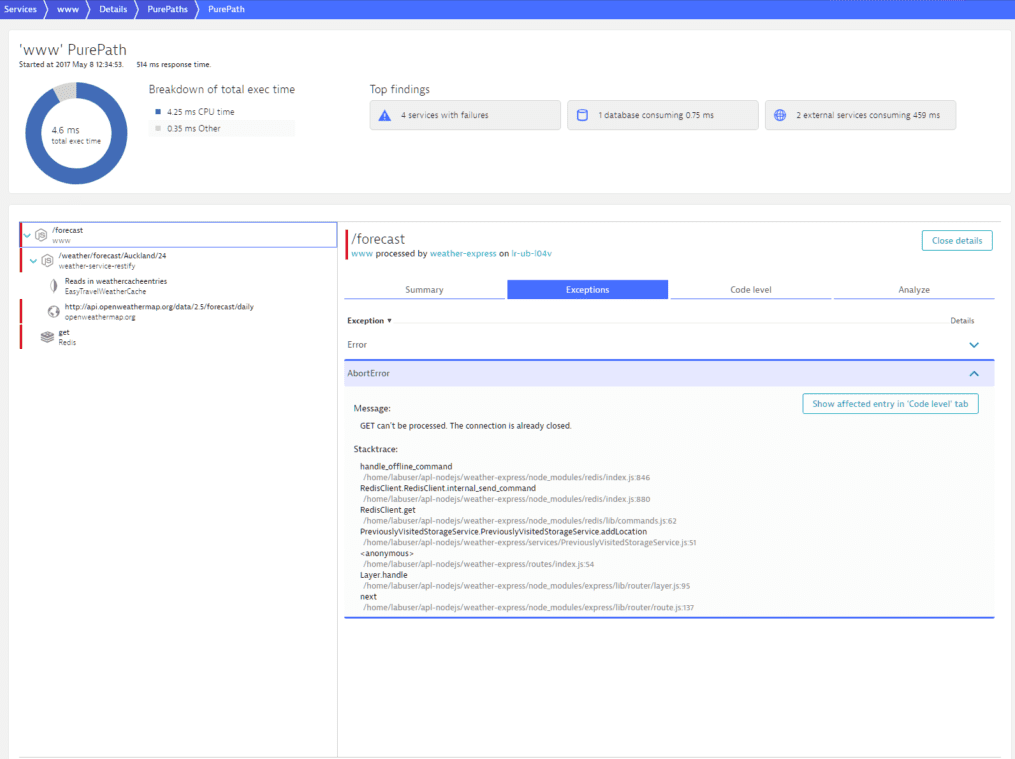
Each distributed trace shows a unique set of parameters leading up to the error. With this approach to analysis, the distributed traces view can be very useful in helping you understand why certain exceptions occurred.