Create USQL custom metrics for mobile applications
With USQL metric events, you can extract business-level KPI metrics from your user session and user action data and store these metrics as time series. You can then use the stored metrics in custom charts, alerting mechanisms, or Metrics API.
USQL metric events are available as:
- User session metric events. These metrics are abbreviated as USCMs and have the
uscm.prefix. - User action metric events. These metrics are abbreviated as UACMs and start with the
uacm.prefix.
User action metric events are available since Dynatrace version 1.260.
USQL metric events can help you answer questions such as:
How is the user experience index for my website changing over time?
How is the Apdex index for a given type of user actions changing over time?
How is the revenue generated by my users changing over time?
How many users are coming to my website and what browsers are they using?
What is the average session duration for my web application?
What is the average user action duration for my mobile application?
You can create and manage USQL metric events using either the Dynatrace web UI or the Dynatrace Settings API.
Configure metrics via UI
You can create and manage USQL metric events using the Dynatrace web UI.
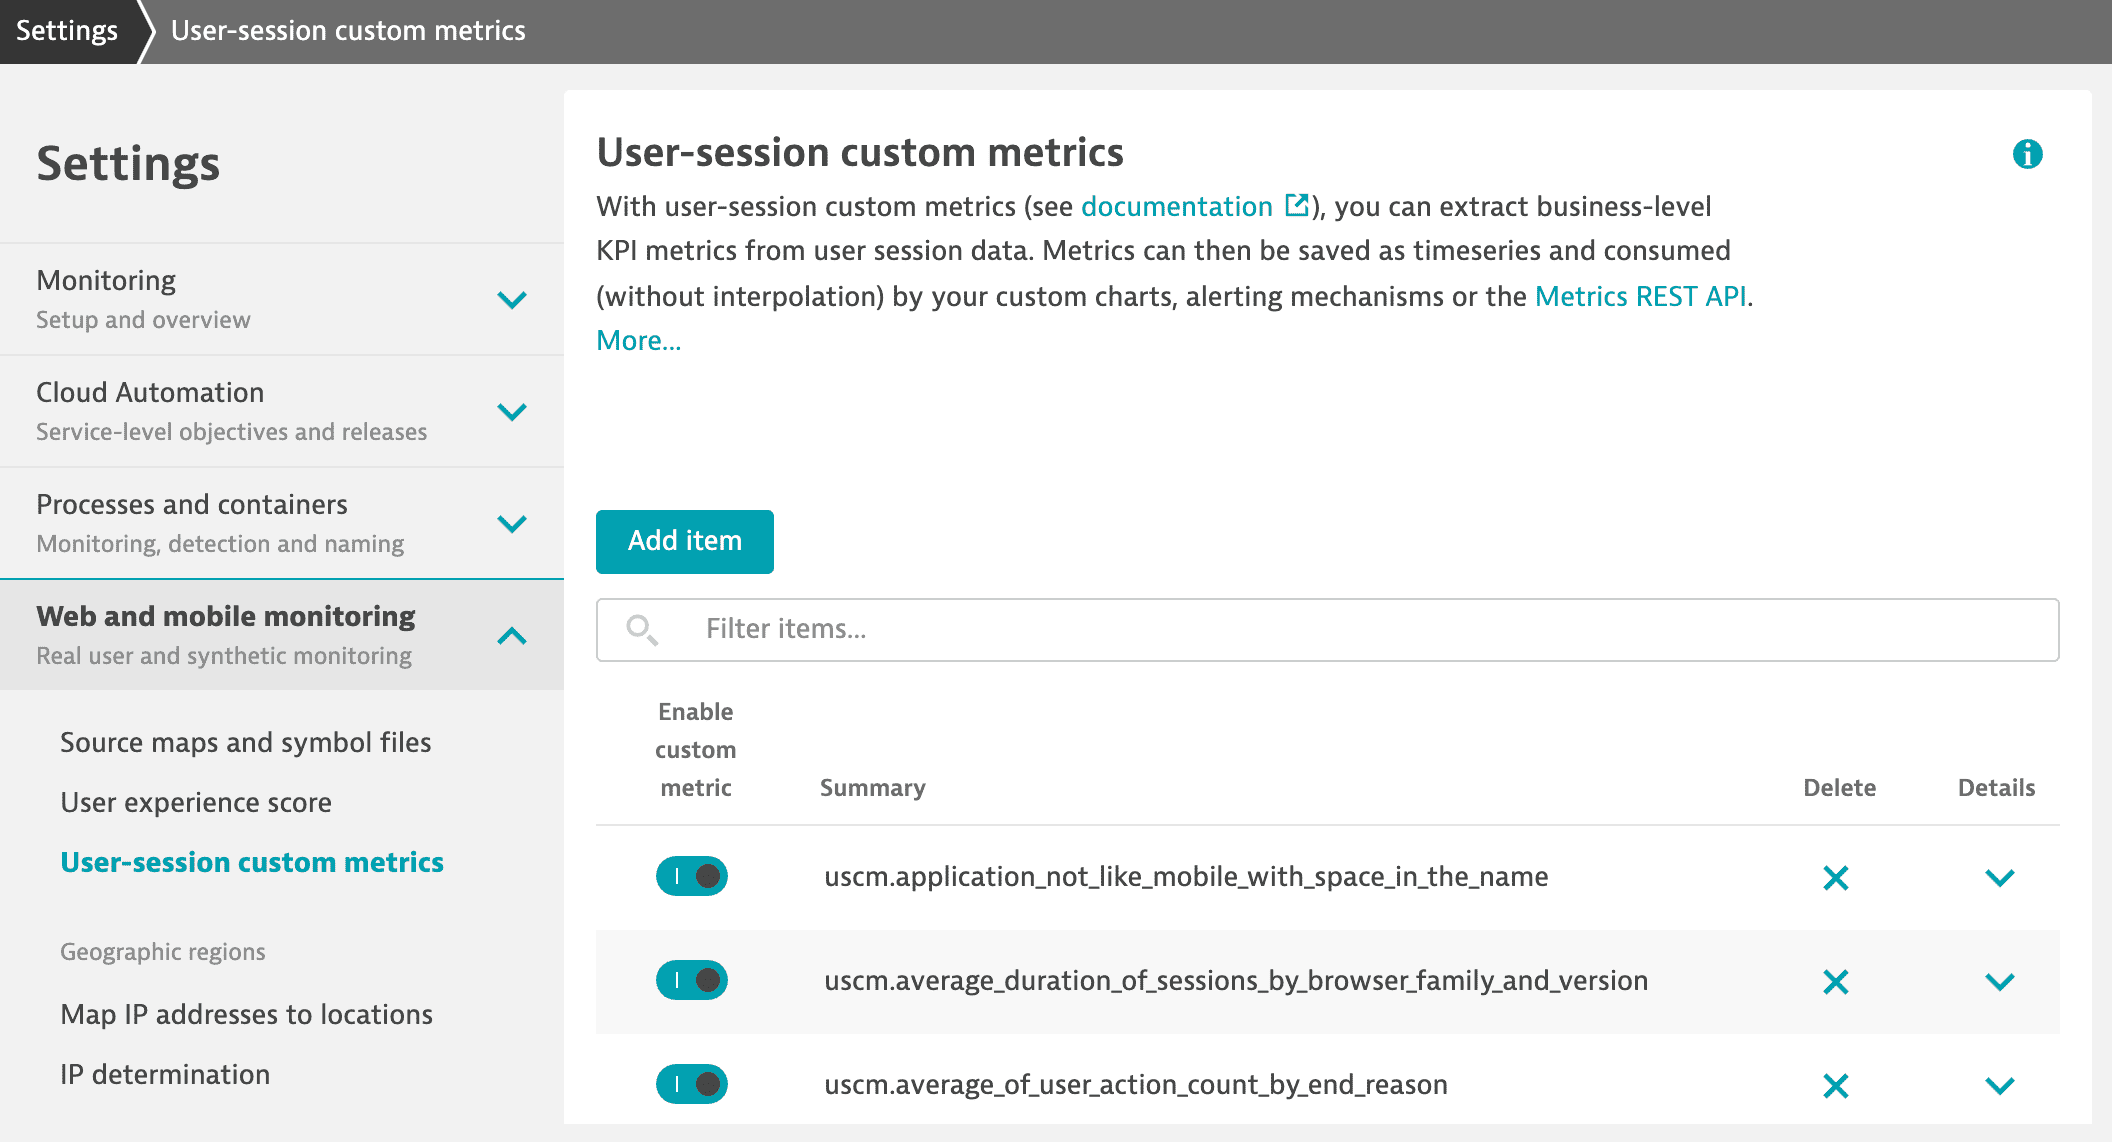
- Go to Settings > Web and mobile monitoring > User session metric events or User action metric events.
- Select Add item.
- Enter the Metric key that should be used when ingesting the metric. You'll use this key when requesting the metric data via Data Explorer.
- For user session metric events, start the metric key with the
uscm.prefix. - For user action metric events, start the metric key with the
uacm.prefix.
- For user session metric events, start the metric key with the
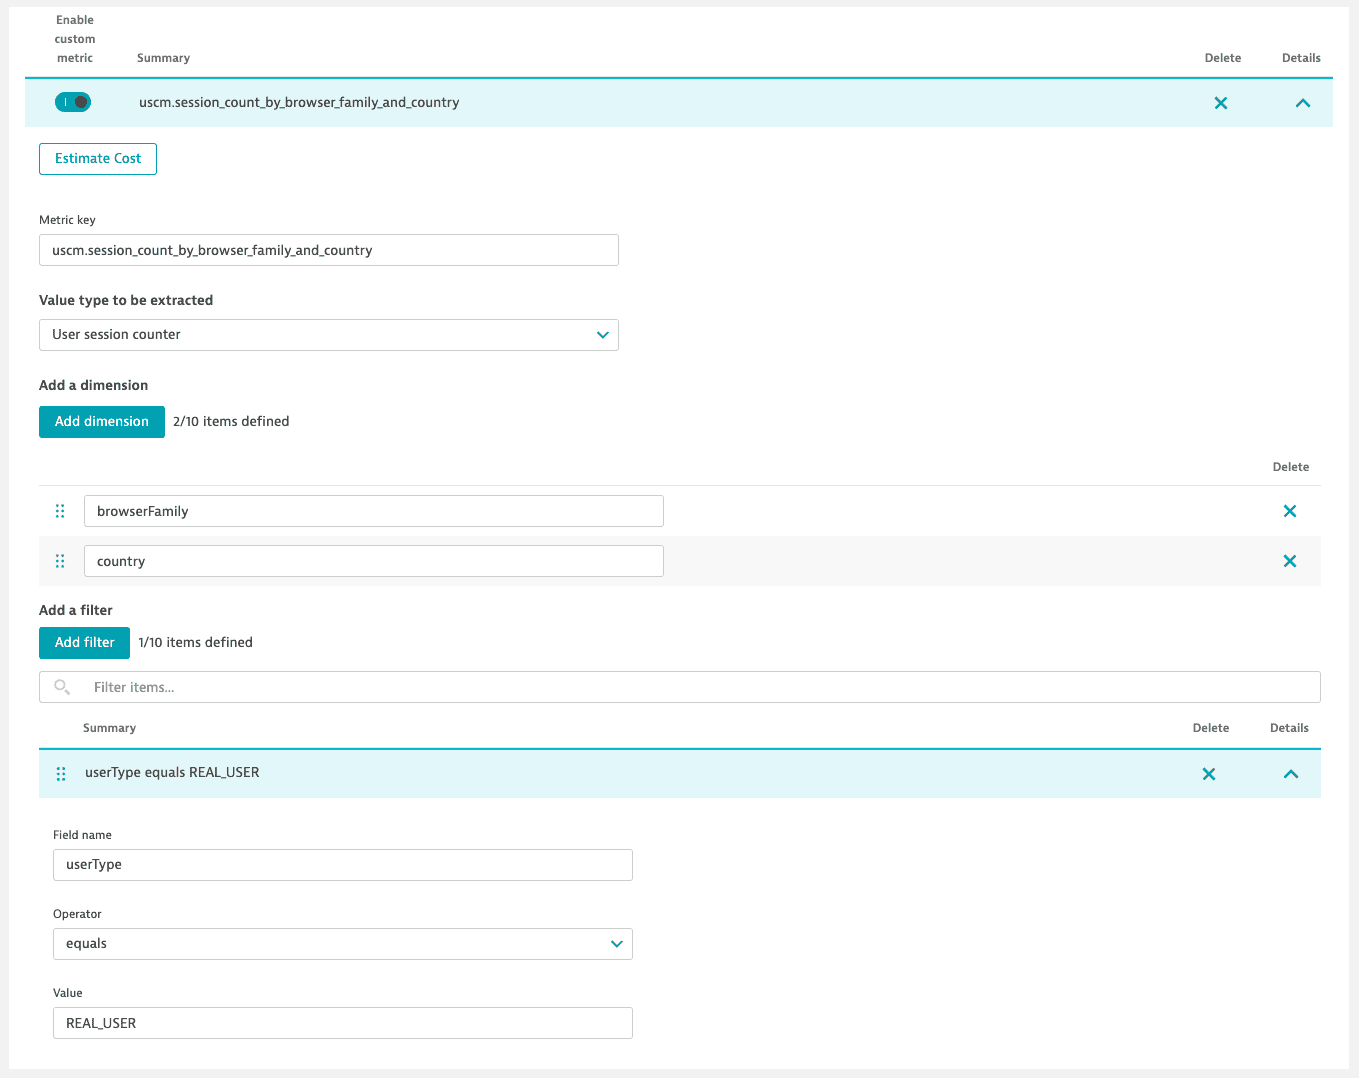
- Under Value type to be extracted, select one of the following options.
- For user session metric events:
- User session counter to count the number of user sessions, which is similar to
COUNT(*)when using USQL. - User session field value to extract a value of a user session field. Also, specify the Field name. For possible values, see Values for user session metric events.
- User session counter to count the number of user sessions, which is similar to
- For user action metric events:
- User action counter to count the number of user actions, which is similar to
COUNT(*)when using USQL. - User action field value to extract a value of a user action field. Also, specify the Field name. For possible values, see Values for user action metric events.
- User action counter to count the number of user actions, which is similar to
- For user session metric events:
- Under Add a dimension, specify fields that should be used as dimensions. For possible values, see Dimensions for user session metric events and Dimensions for user action metric events.
- Under Add a filter, include the required filters.
- Enter the Field name. For possible values, see Filters for user session metric events or Filters for user action metric events.
- Select the Operator.
- If you've selected one of the binary operators, for example, equals or greater than, also provide the second argument in the Value text field.
Alternatively, you can use USQL to create USQL metric events.
Configure metrics via API
You can also use the Settings API to configure USQL metric events.
-
Create an access token with the Write settings (
settings.write) and Read settings (settings.read) permissions. -
Use the GET a schema endpoint to learn the JSON format required to post your configuration.
-
Use the POST an object endpoint to send your configuration.
The table below explains all configuration properties required to create or update a USQL custom metric via API.
| Property | Description | Possible values |
|---|---|---|
| Defines if the USQL custom metric is enabled or not. Set to |
|
| The metric key used when ingesting the metric. Use this key when requesting the metric data via Data Explorer.
| |
| The source of the metric value. | |
|
|
|
| If | See Values for user session metric events and Values for user action metric events. |
| Lists the fields used as dimensions. | See Dimensions for user session metric events and Dimensions for user action metric events. |
| Specifies filters. | |
| Specifies the name of the filter field. | See Filters for user session metric events and Filters for user action metric events. |
| Specifies the operator. |
|
| Provides the second argument for binary operators (such as |
Supported values, dimensions, and filters
Check the sections below to view the lists of supported values, dimensions, and filters for user session metric events.
Only user session fields are supported as a value. User action fields are not supported as a value.
All field names must match the USQL field names.
- The
usersession.prefix in the field name is optional. For example,usersession.durationanddurationmean the same thing. - When a configured field contains
null, the metric is ignored, but Dynatrace uses self-monitoring to identify those cases.
User session fields supported as values
duration
numberOfRageClicks
numberOfRageTaps
totalErrorCount
totalLicenseCreditCount
userActionCount
longProperties.*1
doubleProperties.*1
Any custom long or double property, for example, longProperties.outerwidth or doubleProperties.revenue
- Both user session and user action fields are supported as dimensions. User action fields are supported starting with Dynatrace version 1.234.
All field names must match the USQL field names.
- For a user session field name, the
usersession.prefix is optional. For example,usersession.countryandcountrymean the same thing. When ingesting the metric, theusersession.prefix is dropped, for example,usersession.countrybecomescountry. - For a user action field name, the
useraction.prefix is mandatory. When ingesting the metric, theuseraction.prefix persists. You can add up to 10 dimensions to a single user session custom metric.
- When a field configured as a dimension contains
null, Dynatrace uses thenullstring as a dimension value. - When you use
useraction.applicationas a dimension and a user session spans multiple applications, the value of the user session custom metric is recorded for each application. To avoid the value appearing as double-counted, split the metric by application.
User session fields supported as dimensions
appVersion
applicationType
bounce
browserFamily
browserMajorVersion
browserType
carrier
region
continent
country
connectionType
device
displayResolution
endReason
hasCrash
hasError
hasSessionReplay
manufacturer
networkTechnology
newUser
osFamily
osVersion
reasonForNoSessionReplay
reasonForNoSessionReplayMobile
rootedOrJailbroken
screenHeight
screenOrientation
screenWidth
userExperienceScore
userType
stringProperties.*1
Any custom string property, for example, stringProperties.author. Use fields with low cardinality to avoid creating too many dimension values.
User action fields supported as dimensions
useraction.application1
Supported starting with Dynatrace version 1.234
Both user session and user action fields are supported as filters.
All field names must match the USQL field names.
- For a user session field name, the
usersession.prefix is optional. For example,usersession.countryandcountrymean the same thing. - For a user action field name, the
useraction.prefix is mandatory. - When you add multiple filters, all of them have to match—filters are combined using
AND. - Filters that use a user action field require at least one user action to match. User actions are matched using
ANY. You can set up to 10 filters for a single user session custom metric.
User session fields supported as filters
appVersion
applicationType
bounce
browserFamily
browserMajorVersion
browserMonitorName
browserType
carrier
city
region
continent
country
connectionType
device
displayResolution
duration
endReason
hasCrash
hasError
hasSessionReplay
ip
isp
manufacturer
networkTechnology
newUser
numberOfRageClicks
osFamily
osVersion
reasonForNoSessionReplay
reasonForNoSessionReplayMobile
rootedOrJailbroken
screenHeight
screenOrientation
screenWidth
totalErrorCount
totalLicenseCreditCount
userActionCount
userExperienceScore
userId
userType
longProperties.*1
doubleProperties.*1
stringProperties.*1
Any custom long, double, or string property, for example, longProperties.outerwidth, doubleProperties.revenue, or stringProperties.author
User action fields supported as fields
useraction.apdexCategory
useraction.application
useraction.cdnBusyTime
useraction.cdnResources
useraction.customErrorCount
useraction.domCompleteTime
useraction.domContentLoadedTime
useraction.documentInteractiveTime
useraction.domain
useraction.duration
useraction.firstInputDelay
useraction.firstPartyBusyTime
useraction.firstPartyResources
useraction.frontendTime
useraction.hasCrash
useraction.internalApplicationId
useraction.internalKeyUserActionId
useraction.javascriptErrorCount
useraction.keyUserAction
useraction.largestContentfulPaint
useraction.name
useraction.networkTime
useraction.requestErrorCount
useraction.serverTime
useraction.speedIndex
useraction.targetUrl
useraction.thirdPartyBusyTime
useraction.thirdPartyResources
useraction.type
useraction.visuallyCompleteTime
Expand the sections below to explore supported values, dimensions, and filters for user action metric events.
Both user session and user action fields are supported as values.
All field names must match the USQL field names.
- For user action fields, the
useraction.prefix is optional. For example,useraction.typeandtypemean the same thing. - For user session fields, the
usersession.prefix is required. - When a configured field contains
null, the metric is ignored, but Dynatrace uses self-monitoring to identify those cases.
User action fields supported as values
speedIndex
duration
networkTime
serverTime
frontendTime
documentInteractiveTime
firstPartyResources
firstPartyBusyTime
thirdPartyResources
thirdPartyBusyTime
cdnResources
cdnBusyTime
domCompleteTime
domContentLoadedTime
loadEventStart
loadEventEnd
visuallyCompleteTime
requestStart
responseStart
responseEnd
userActionPropertyCount
customErrorCount
javascriptErrorCount
requestErrorCount
largestContentfulPaint
firstInputDelay
totalBlockingTime
cumulativeLayoutShift
longProperties.*1
doubleProperties.*1
Any custom long or double property
User session fields supported as values
usersession.duration
usersession.numberOfRageClicks
usersession.numberOfRageTaps
usersession.totalErrorCount
usersession.totalLicenseCreditCount
usersession.userActionCount
usersession.longProperties.*1
usersession.doubleProperties.*1
Any custom long or double property, for example, usersession.longProperties.outerwidth or usersession.doubleProperties.revenue
Both user session and user action fields are supported.
All field names must match the USQL field names.
- For user action fields, the
useraction.prefix is optional. For example,useraction.typeandtypemean the same thing. When ingesting the metric, theuseraction.prefix is dropped, for example,useraction.typebecomestype. - For user session fields, the
usersession.prefix is required. When ingesting the metric, theusersession.prefix persists. You can specify up to 4 dimensions for a user action custom metric, but only 2 of them can be high-cardinality dimensions.
- When a field configured as a dimension contains
null, Dynatrace uses thenullstring as a dimension value. In the list below, dimensions in bold are high-cardinality dimensions.
User action fields supported as dimensions
application
hasCrash
type
apdexCategory
internalApplicationId
internalKeyUserActionId
keyUserAction
isEntryAction
isExitAction
stringProperties.*1
Any custom string property. Use fields with low cardinality to avoid creating too many dimension values.
User session fields supported as dimensions
usersession.appVersion
usersession.applicationType
usersession.bounce
usersession.browserFamily
usersession.browserMajorVersion
usersession.browserType
usersession.carrier
usersession.region
usersession.continent
usersession.country
usersession.connectionType
usersession.device
usersession.displayResolution
usersession.endReason
usersession.hasCrash
usersession.hasError
usersession.hasSessionReplay
usersession.manufacturer
usersession.networkTechnology
usersession.newUser
usersession.osFamily
usersession.osVersion
usersession.reasonForNoSessionReplay
usersession.reasonForNoSessionReplayMobile
usersession.rootedOrJailbroken
usersession.screenHeight
usersession.screenOrientation
usersession.screenWidth
usersession.userExperienceScore
usersession.userType
usersession.stringProperties.*1
Any custom string property, for example, usersession.stringProperties.author. Use fields with low cardinality to avoid creating too many dimension values.
Both user session and user action fields are supported as filters.
All field names must match the USQL field names.
- For user action fields, the
useraction.prefix is optional. For example,useraction.typeandtypemean the same thing. - For user session fields, the
usersession.prefix is required. - When you add multiple filters, all of them have to match—filters are combined using
AND. You can set up to 10 filters for a single user action custom metric.
User action fields supported as filters
apdexCategory
application
cdnBusyTime
cdnResources
customErrorCount
cumulativeLayoutShift
domCompleteTime
domContentLoadedTime
documentInteractiveTime
domain
duration
firstInputDelay
firstPartyBusyTime
firstPartyResources
frontendTime
hasCrash
internalApplicationId
internalKeyUserActionId
isEntryAction
isExitAction
javascriptErrorCount
keyUserAction
largestContentfulPaint
loadEventStart
loadEventEnd
name
networkTime
requestErrorCount
requestStart
responseStart
responseEnd
serverTime
speedIndex
targetUrl
thirdPartyBusyTime
thirdPartyResources
totalBlockingTime
type
userActionPropertyCount
visuallyCompleteTime
syntheticEvent
longProperties.*1
doubleProperties.*1
stringProperties.*1
Any custom long, double, or string property
User session fields supported as filters
usersession.appVersion
usersession.applicationType
usersession.bounce
usersession.browserFamily
usersession.browserMajorVersion
usersession.browserMonitorName
usersession.browserType
usersession.carrier
usersession.city
usersession.region
usersession.continent
usersession.country
usersession.connectionType
usersession.device
usersession.displayResolution
usersession.duration
usersession.endReason
usersession.hasCrash
usersession.hasError
usersession.hasSessionReplay
usersession.ip
usersession.isp
usersession.manufacturer
usersession.networkTechnology
usersession.newUser
usersession.numberOfRageClicks
usersession.numberOfRageTaps
usersession.osFamily
usersession.osVersion
usersession.reasonForNoSessionReplay
usersession.reasonForNoSessionReplayMobile
usersession.rootedOrJailbroken
usersession.screenHeight
usersession.screenOrientation
usersession.screenWidth
usersession.totalErrorCount
usersession.totalLicenseCreditCount
usersession.userActionCount
usersession.userExperienceScore
usersession.userId
usersession.userType
usersession.longProperties.*1
usersession.doubleProperties.*1
usersession.stringProperties.*1
Any custom long, double, or string property, for example, usersession.longProperties.outerwidth, usersession.doubleProperties.revenue, or usersession.stringProperties.author
Known limitations
We've identified the following limitations for USQL metric events:
You can create up to 500 user session custom metrics per environment.
You can create up to 100 user action custom metrics per environment.
Synthetic user session data is not factored into values of USQL metric events; only real-user data is included.
Dynatrace updates USQL metric events each time a session closes. This means that live session data is not factored into USQL custom metric values; only closed session data is included.
- The
DISTINCTkeyword used in USQL is not supported. If you have a query likeSELECT COUNT(DISTINCT country) from usersession, it is not possible to create an equivalent USQL custom metric.
Tutorial
To better understand how USQL metric events work, you can follow the tutorial for user session metric events below.
Create a metric

Create and pin a chart

Create an alert

Using the Dynatrace web UI, let's create an Average session duration user session custom metric (USCM) based on the session data of real users. The metric will include two dimensions for segmentation of session data by browser family and major browser version. Using this metric, we will then create a chart for the metric, pin the chart to a dashboard, and create a custom event for the metric so that you can receive alerts when the metric value exceeds a specified threshold.
- Go to Settings > Web and mobile monitoring > User session metric events.
- Select Add item.
- Enter
uscm.average_duration_of_sessions_by_browser_family_and_versionas Metric key. - Under Value type to be extracted, select User session field value. Also, set Field name to
duration. - Select Add dimension, and add the
browserMajorVersionandbrowserFamilydimensions. - Under Add a filter, include the following filters:
userType=REAL_USER(Field name isuserType, Operator isequals, and Value isREAL_USER)useraction.application=www.easytravel.com(Field name isuseraction.application, Operator isequals, and Value iswww.easytravel.com). Instead of using thewww.easytravel.comvalue, you can use the name of your own application.
- Select Save changes.
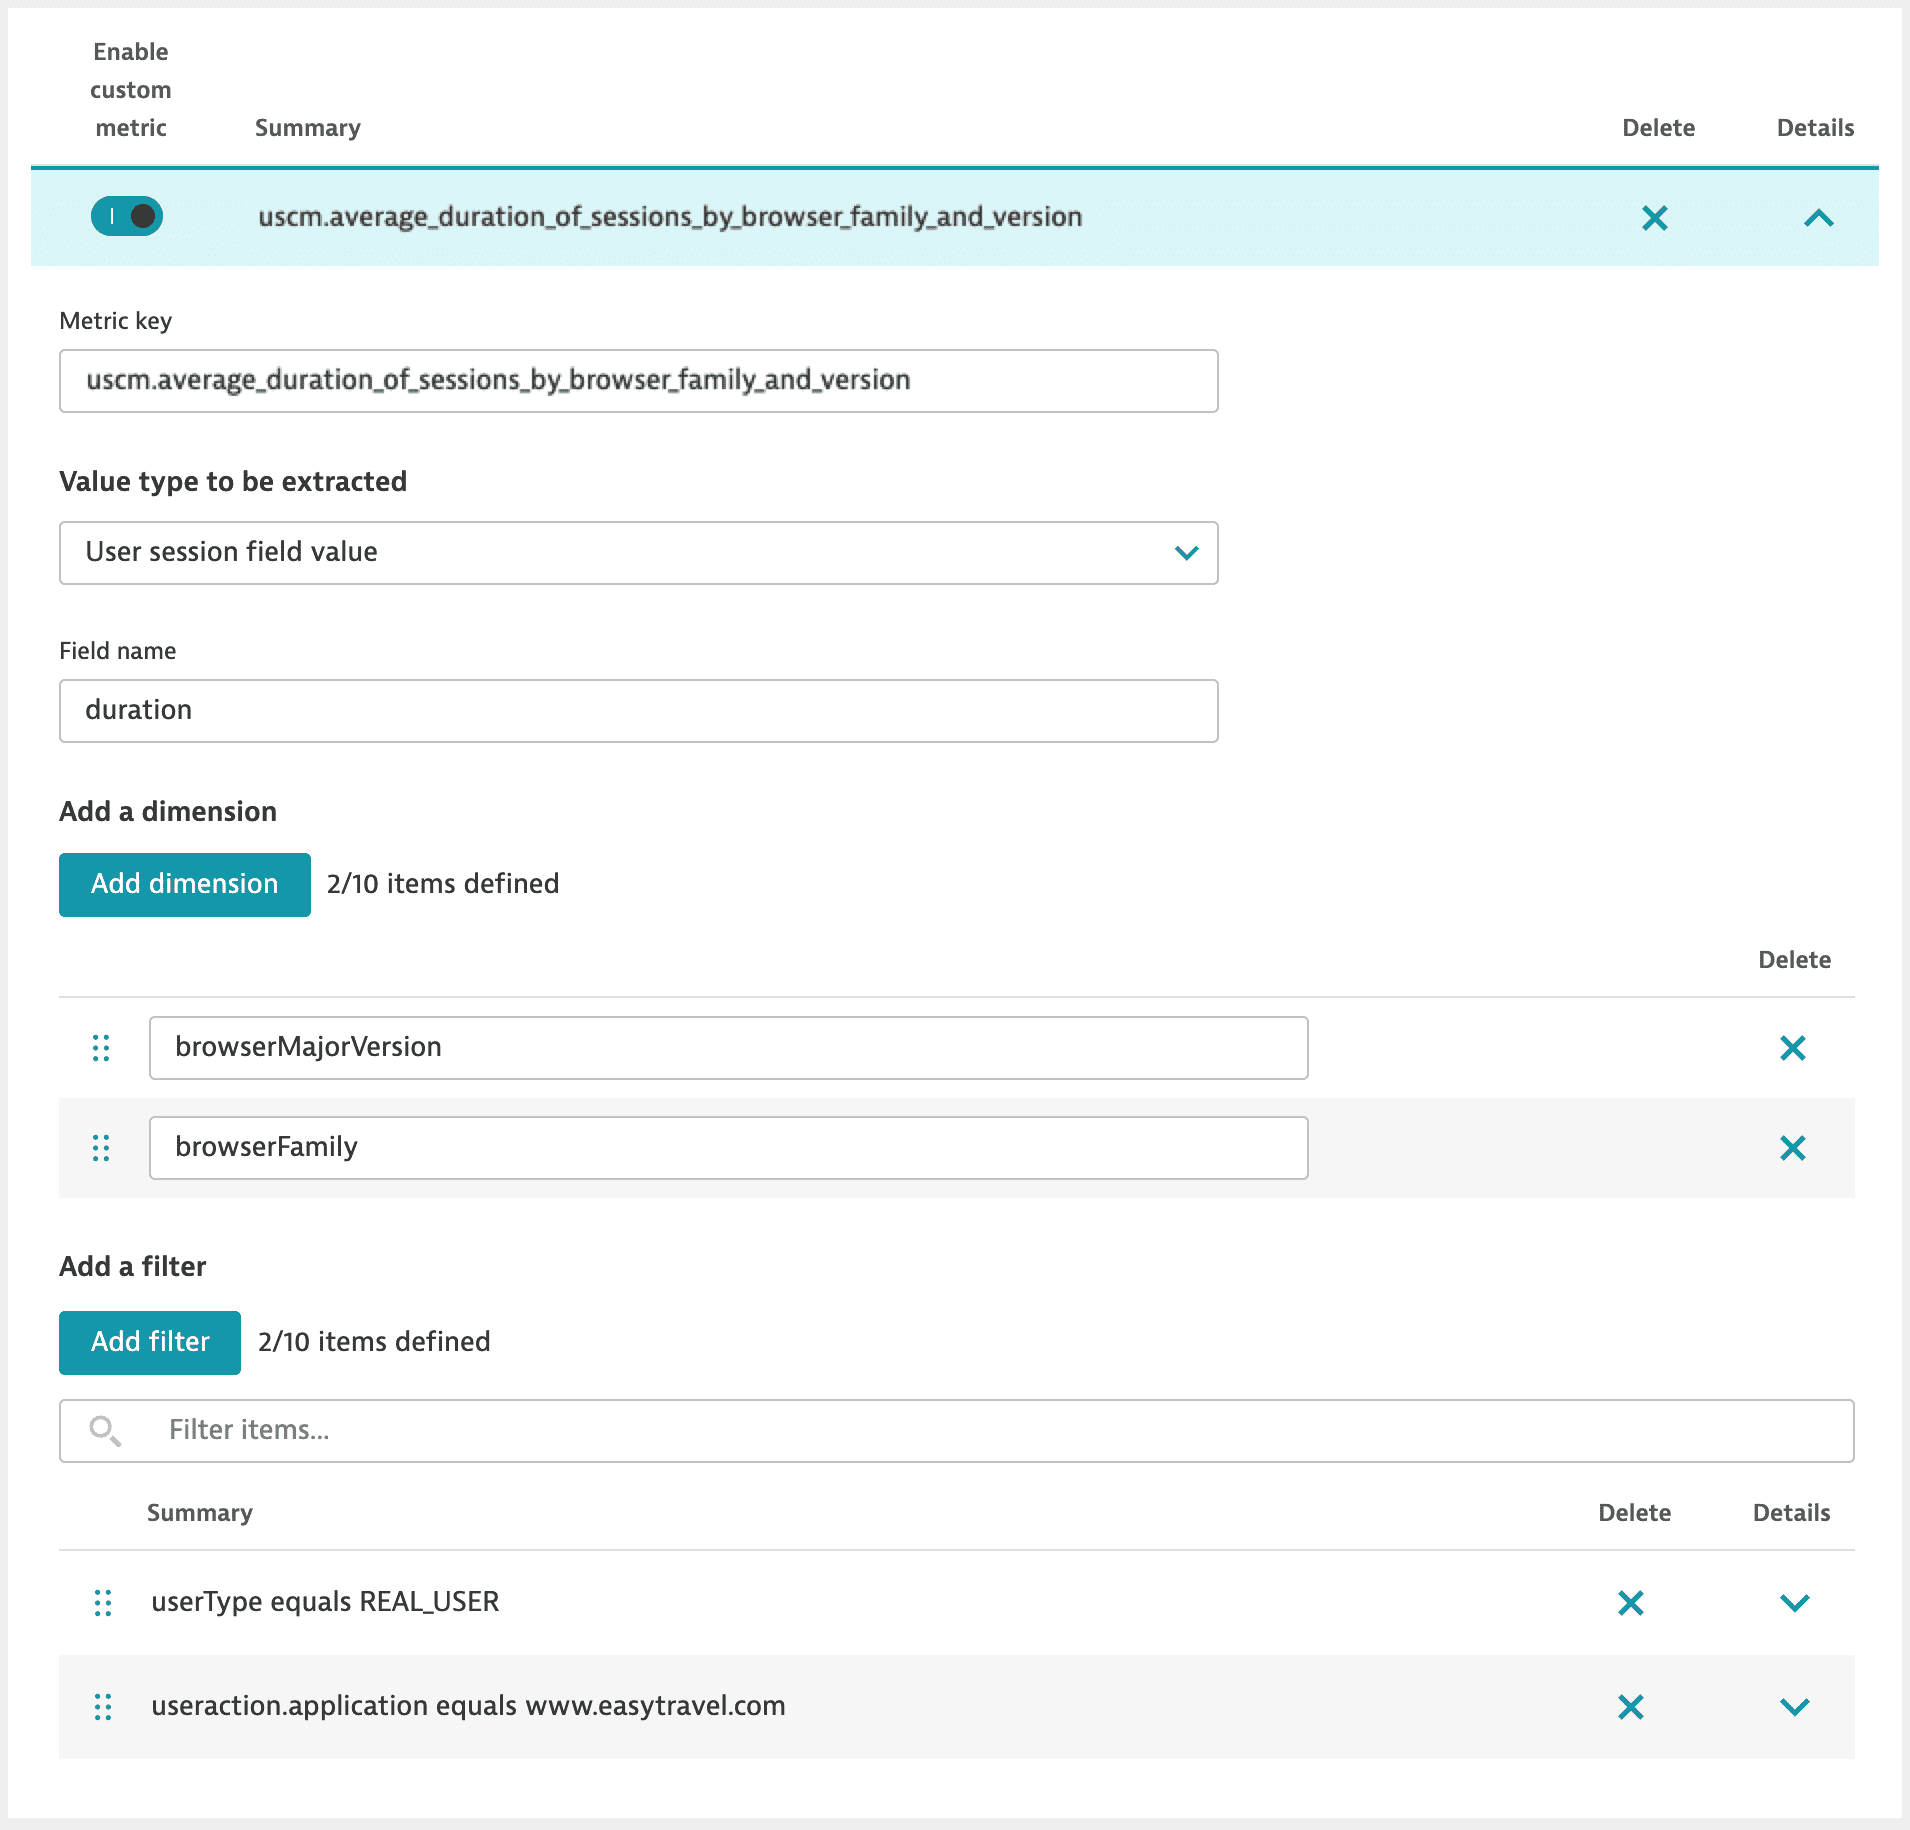
Now you have a user session custom metric that is extracted as a field (duration) only when useraction.application equals www.easytravel.com (filtering for a specific application) and userType is REAL_USER (filtering for real users only). Additionally, you have added two dimensions that allow you to split data based on the browser family or major browser version.
Once the user session data is received and the metric is populated, you can chart this metric, pin the chart to a dashboard, and even create an alert based on the metric.
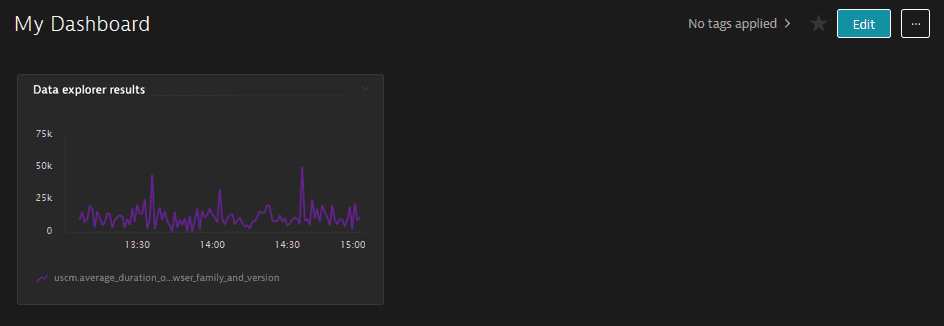
Now let's create a chart based on the uscm.average_duration_of_sessions_by_browser_family_and_version metric and pin this chart to one of your dashboards.
-
Go to Data Explorer.
-
Select the
uscm.average_duration_of_sessions_by_browser_family_and_versionmetric, and select Run query.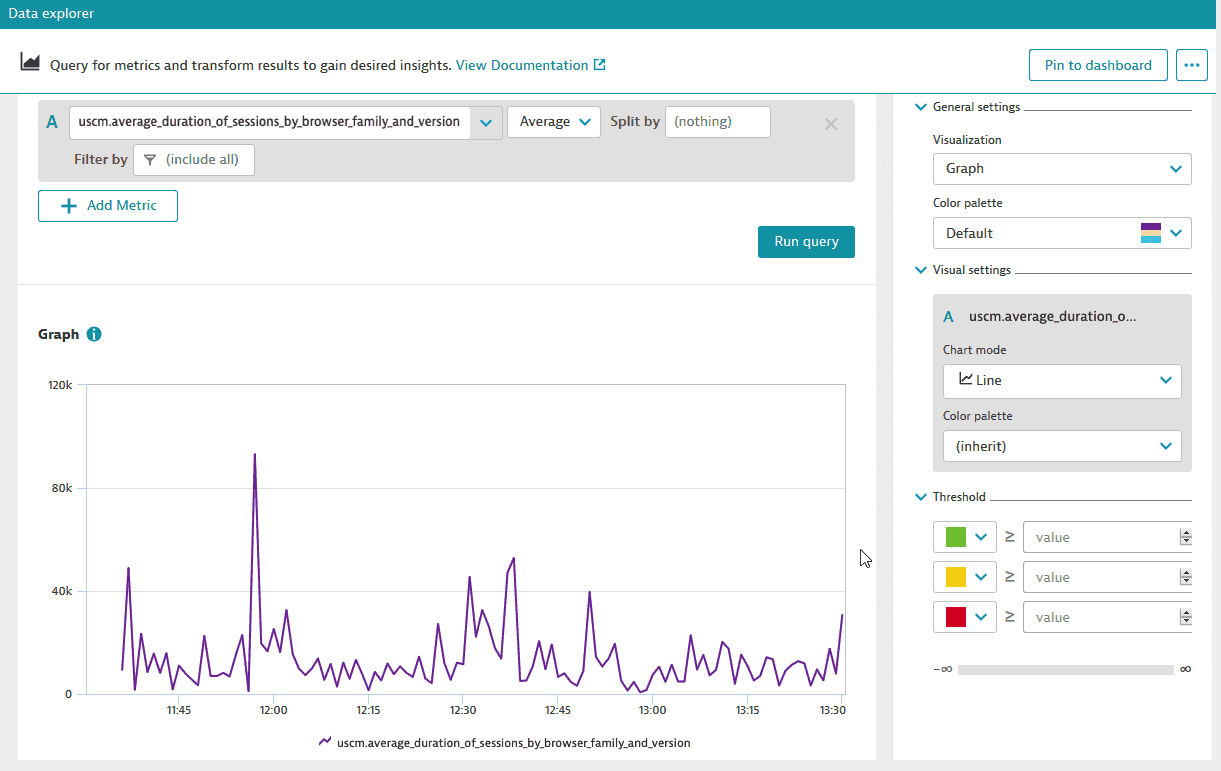
-
Using Data Explorer, split the collected data to see the user session data partitioned based on
browserMajorVersion,browserFamily, or both. -
Filter user session data based on
browserMajorVersionorbrowserFamilyto focus on the user session data that interests you. -
Once you create a chart presenting your data, you can pin the chart to a classic dashboard: select Pin to dashboard, select one of your dashboards, and enter the tile name.
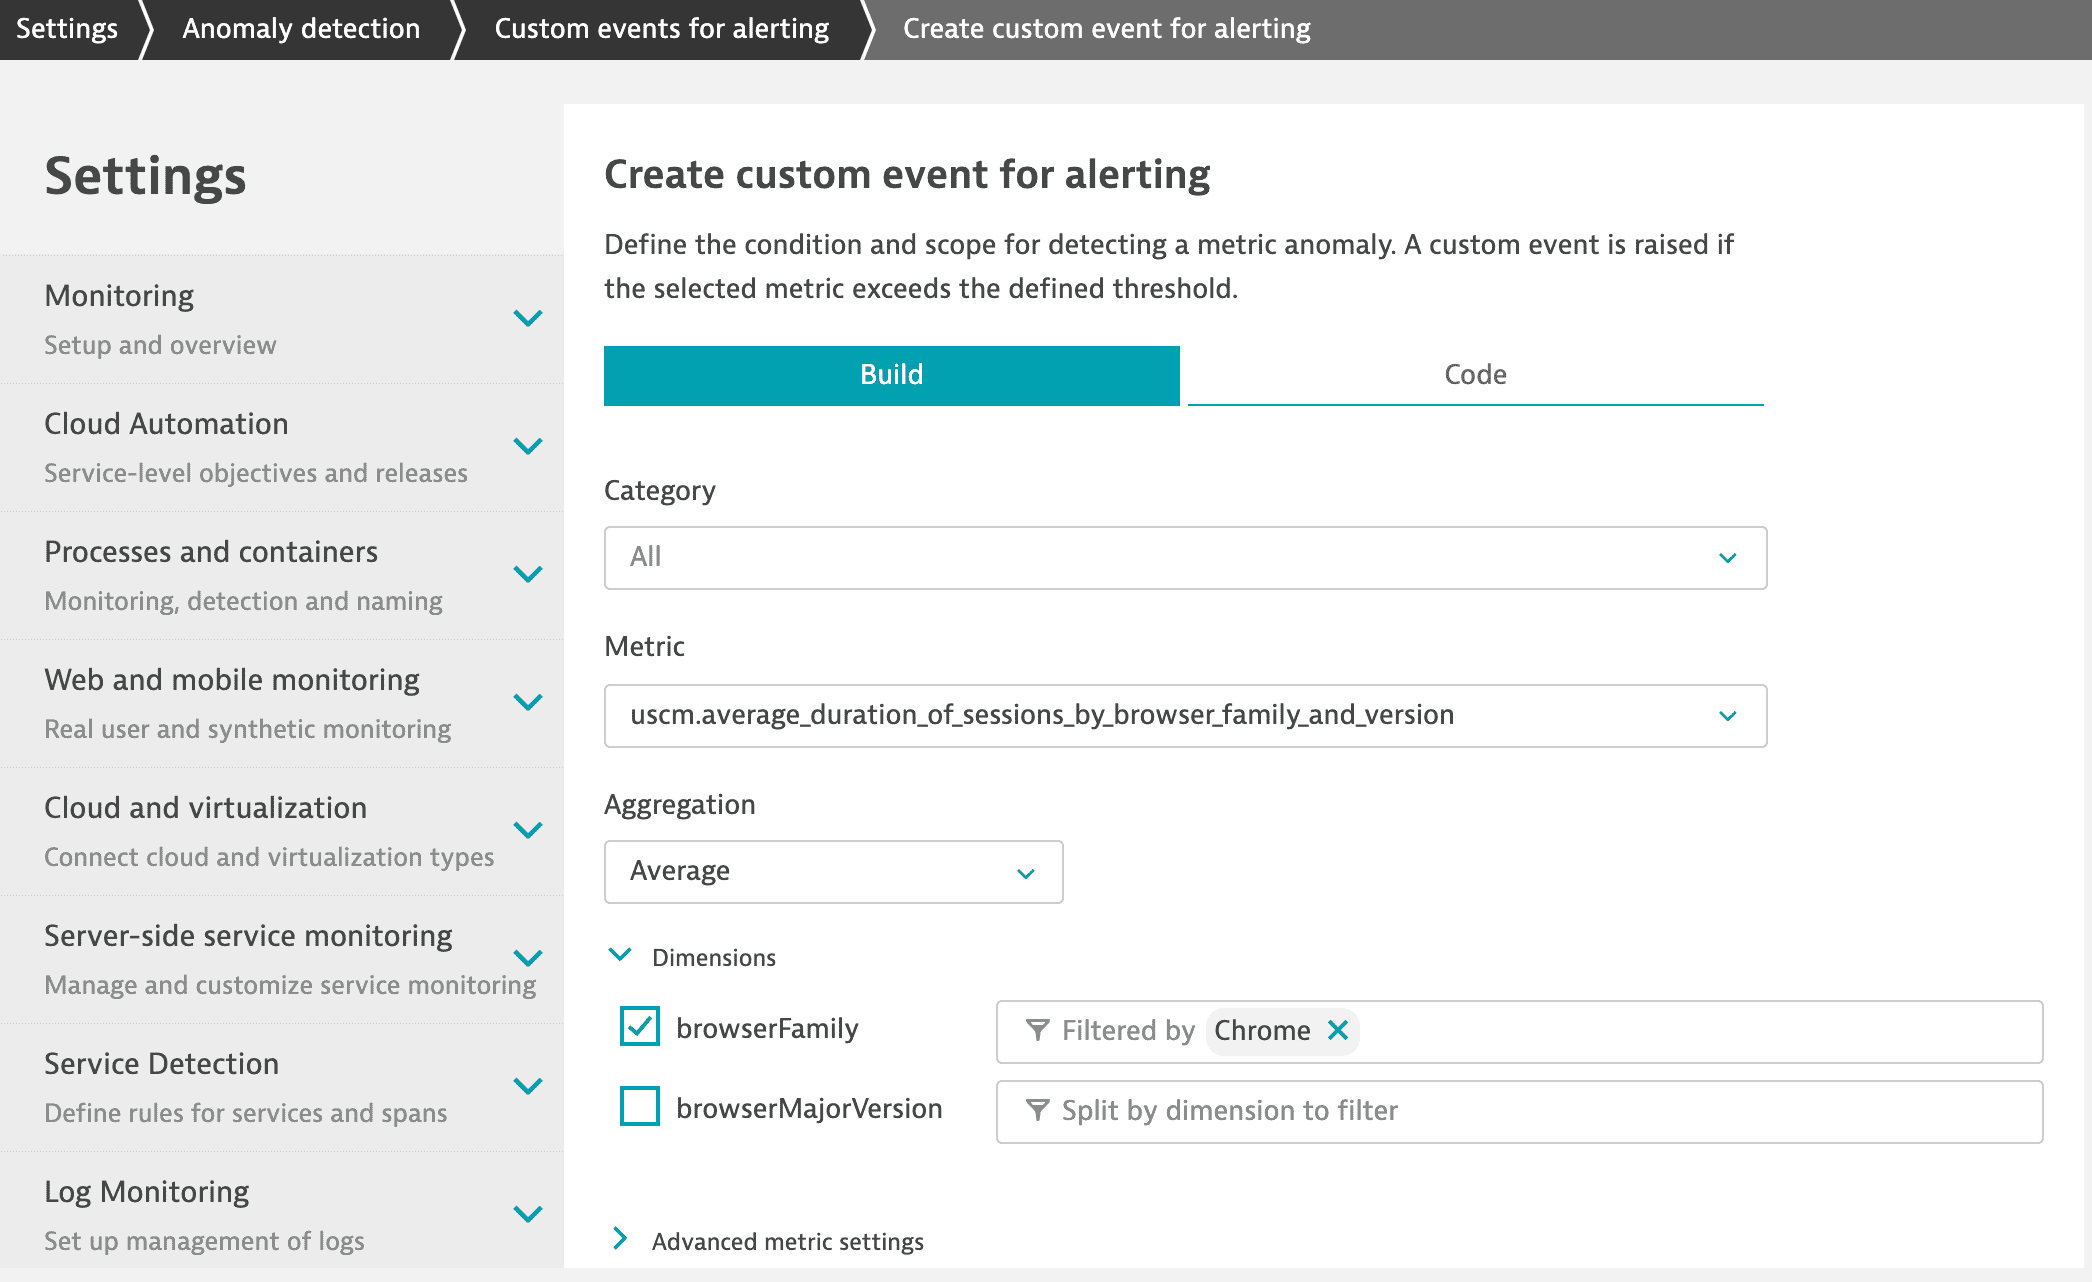
As the last part of this example, we'll create an alert based on the user session metric events.
To create an alert
- Go to Settings > Anomaly detection > Metric events.
- Select Add metric event.
- Create a metric event based on
uscm.average_duration_of_sessions_by_browser_family_and_versionmetric. For details, see Metric events.
Frequently asked questions
Make sure the user session is not live. Dynatrace extracts and stores metric data to time series only after a user session is closed.
As sessions are closed in applications, they are pushed to the queue for later processing. A number of background workers then extract metric data from the user sessions to prepare the data for metric ingestion.
Synthetic user session data is not factored into USQL metric events.
Exclude synthetic sessions from your query. Also, check that the same timeframe is applied to the query and metric.
Starting with Dynatrace 1.232, USQL metric events are subject to the Davis data unit (DDU) licensing. These metrics are billed as regular schemaless metrics.
To estimate the cost per metric, the sessions for the last 7 days are evaluated and the cost in DDUs per metric is calculated according to the expected ingestion per minute. For details, see How do we calculate DDU consumption for metric events?.
The Dynatrace metric-data persistence follows a data-retention strategy that aggregates metrics over time. The data-retention strategy applied to USQL metric events is identical to the data-retention strategy used for built-in time series metrics.
For details, see Data retention periods > Metrics