Manage code-level vulnerabilities
After you enable and configure Dynatrace Runtime Vulnerability Analytics, Dynatrace starts inspecting your libraries and first-party code to detect code-level vulnerabilities. A code-level vulnerability is a security problem based on a flaw in your application code. For more information on the mechanism to detect vulnerabilities and assess risk, see Vulnerability evaluation.
Code-level vulnerabilities list
To see the list of detected code-level vulnerabilities in your environment, go to Code-Level Vulnerabilities. The following information is displayed.
Vulnerabilities detected
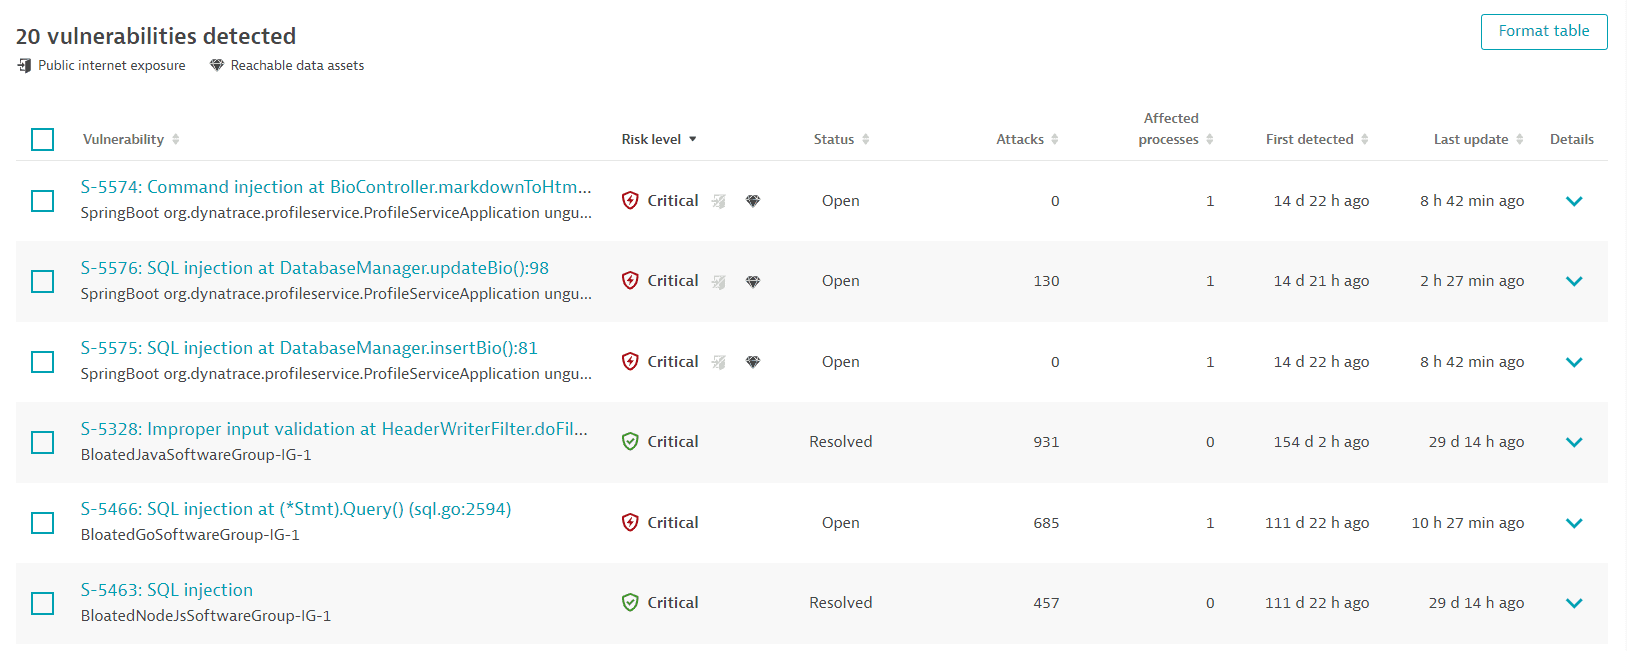
A list of detected code-level vulnerabilities in your environment. For optimized performance, a maximum of 500 vulnerabilities are displayed at a time. You can narrow down the results by applying filters. To sort the list by any item, select the corresponding column heading. To add or remove column headings, select Format table.
Vulnerabilities
- The vulnerability ID provided by Dynatrace (example:
S-3694) - The type of code-level vulnerability and the matching code location where it was detected (for example,
SQL injection at DatabaseManager.updateBio():82) - The vulnerable component (the affected process group name, for example:
launch.Main).
Risk level
- The vulnerability risk level (typically
Critical), indicating the severity of the vulnerability, and the symbol associated with it. - The public internet exposure symbol, if the vulnerability affects at least one process that is exposed to the internet. This is analyzed based on the traffic that hits the process directly, via source IP, or indirectly, via a header set by an intermediary service such as
_X-Forwarded-For_). If the symbol is grayed out and crossed out, no public internet exposure was found. If the symbol isn't present, no data is available. - The reachable data symbol, if the vulnerability affects a process that has database access, based on the Dynatrace entity model (Smartscape). If the symbol is grayed out and crossed out, there are no reachable data assets within range. If the symbol isn't present, no data is available.
Status
-
Open: The code-level vulnerability is currently present.
-
Resolved: The code-level vulnerability has been automatically resolved because the root cause (the vulnerable code location) is not present anymore.
-
Muted: The code-level vulnerability has been muted by request.
A muted vulnerability that has been automatically resolved doesn't change its status to
Resolved.
Attacks
The number of attacks related to this code-level vulnerability, based on the last 365 days. The same vulnerability can be exploited by multiple attacks.
This column is displayed only if Dynatrace Runtime Application Protection is activated.
Affected processes
The number of processes affected by the code-level vulnerability. Each affected process runs a code where this vulnerability was detected.
First detected
When Dynatrace first detected the code-level vulnerability.
Last update
Timestamp of the last status change of the code-level vulnerability. A status change can be when:
The vulnerability is resolved or reopened
The vulnerability is muted or unmuted
The risk assessment has changed
New attacks on the vulnerability have been detected
For details, see FAQ: What does "last update" refer to?.
To display this column, select Format table and add Last update to the list.
Details
Expand ![]() vulnerability rows for details, or to perform the following actions:
vulnerability rows for details, or to perform the following actions:
- Select Change status to mute, unmute, or mute again the vulnerability with a different reason or comment.
- Select View vulnerability details to navigate to the details page of a vulnerability.
Code-level vulnerability details
To see details about a code-level vulnerability, go to Code-Level Vulnerabilities and select a vulnerability. The following information is displayed.
Vulnerability title
Example title:
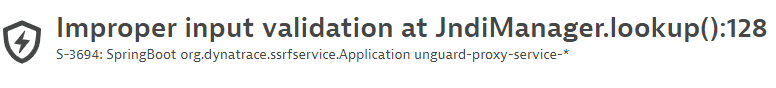
- The type of code-level vulnerability and the matching code location where it was detected (example:
SQL injection at DatabaseManager.updateBio():82) - The vulnerability ID provided by Dynatrace (example:
S-3694) - The affected entity (example:
SpringBoot org.dynatrace.ssrfservice.Application unguard-proxy-service-*)
Infographic of the key features
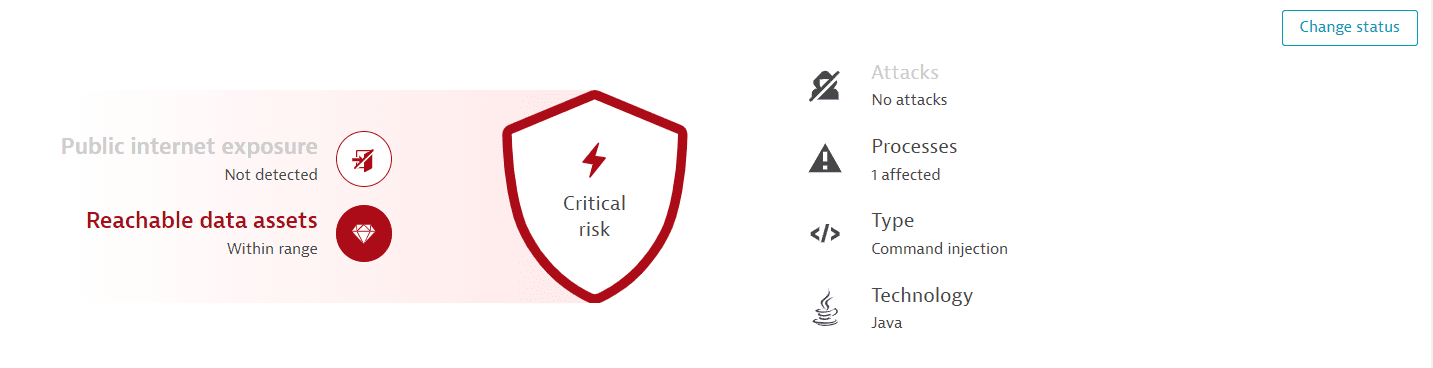
-
Risk level: A code-level vulnerability has a
Criticalrisk level. Once the vulnerability has been muted, the risk level symbol is grayed out. -
Public internet exposure: If there's any public internet exposure. Possible states are:
- Public network: There is public internet exposure.
- Not detected: No public internet exposure was found.
- Not available: Data isn't available, because the related hosts are running in Infrastructure Monitoring mode. For details, see Monitoring modes.
-
Reachable data assets: If there are any reachable data assets affected. Possible states are:
- Within range: There are reachable data assets affected.
- None within range: There are no reachable data assets within range.
- Not available: Data isn't available, because the related hosts are running in Infrastructure Monitoring mode. For details, see Monitoring modes.
-
Attacks: The number of attacks detected on the code location from different source IP addresses.
This feature is displayed only if Runtime Application Protection is activated.
-
Processes: The number of processes affected by the vulnerability.
-
Type: The type of exploit (SQL injection, command injection, or improper input validation).
To change the status of the vulnerability, select Change status in the upper-right corner of the page.
Context and details
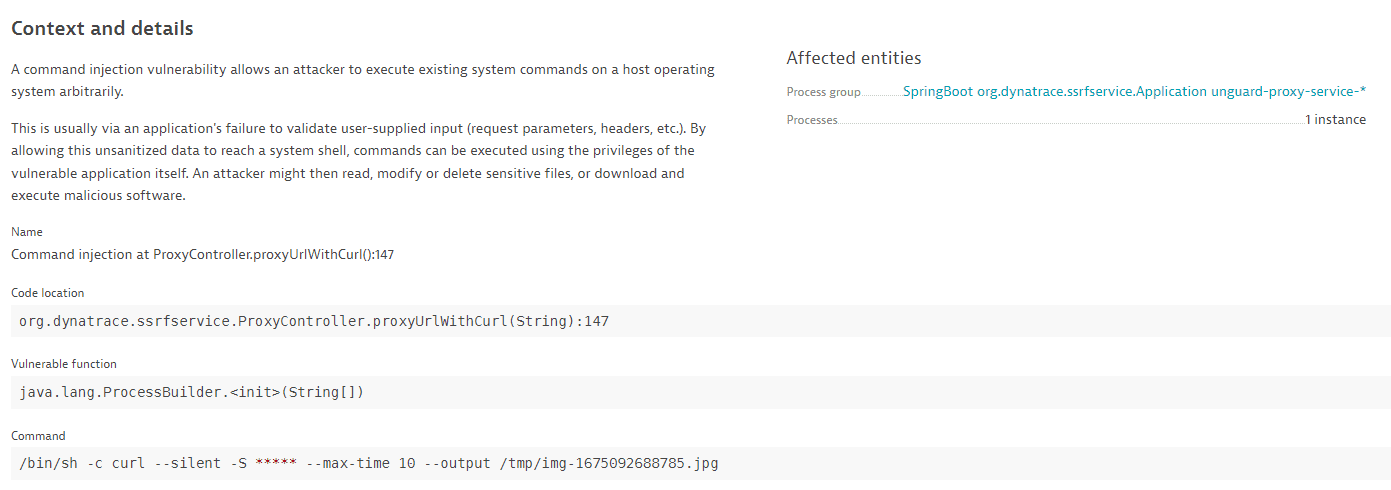
-
A description of the vulnerability type.
-
The exact code location.
-
The vulnerable function.
-
The SQL statement (in the case of SQL injection), the command (in the case of command injection), or the JNDI lookup name (in the case of improper input validation). The user-controlled input is highlighted.
For data protection, asterisks (
*****) are displayed instead of user information. -
Affected entities:
The process group where the vulnerability was detected.
The number of affected processes.
Select a process group name to navigate to the respective process group details page.
Entry points
OneAgent version 1.267+
Use case: Go to the source of a code-level vulnerability to determine exactly what is needed to resolve it.
An entry point is a point in the code where an attacker could enter the application and exploit a vulnerability, for example, by passing user input fields to the application (such as a login form or search bar).
In the example below, the entry point information shows that the vulnerability could be exploited by using a malicious payload in the HTTP parameters name and password.
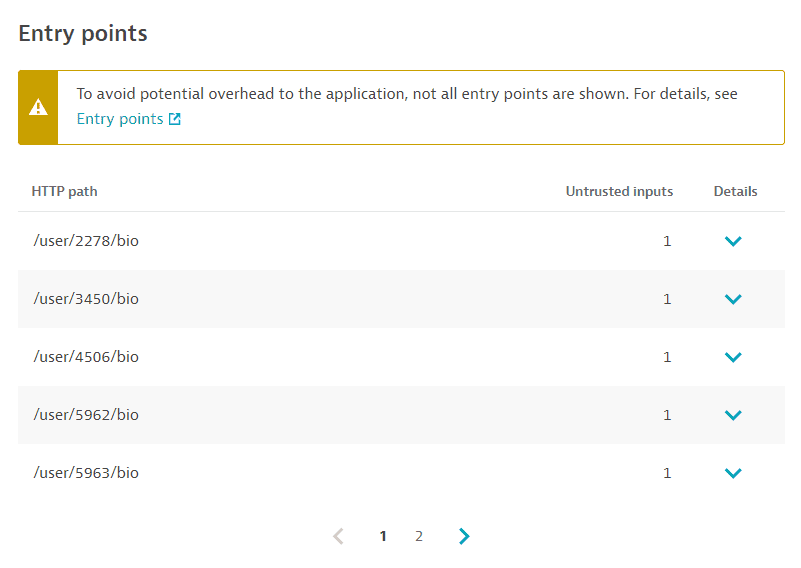
To evaluate a code-level vulnerability, the following entry point information is provided:
-
HTTP path: The path used in the HTTP request to reach and potentially exploit the vulnerability.
-
Untrusted inputs: The number of inputs that are passed to the usage.
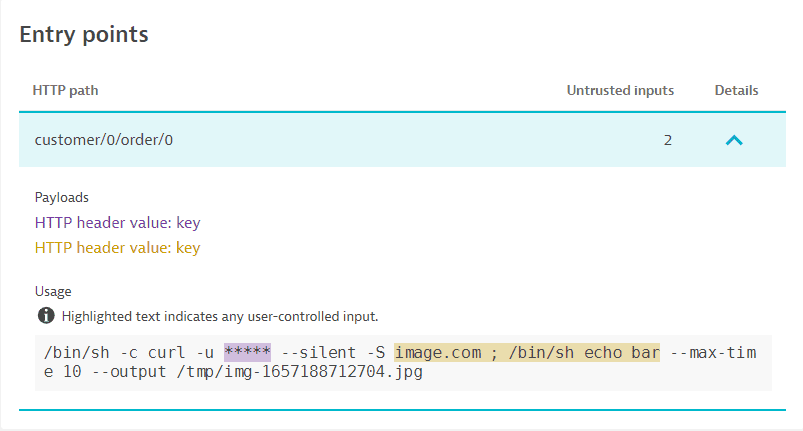
Select Details for additional information:
- Payloads: The user-controlled inputs that could be used to exploit the vulnerability. If there's a key for the payload (for example, an HTTP parameter name or an HTTP header name), it's displayed after the colon.
- Usage: The actual usage of the untrusted inputs, for example in an SQL statement the positions in which the parameters were used in the vulnerable code.
If the same vulnerability is reachable by multiple HTTP paths, multiple entry point entries are listed. To save memory and network traffic, a limited number of entries is displayed.
If a code-level vulnerability is resolved or is about to be resolved in the next 30 minutes, the entry points are no longer open (vulnerable).
Attack paths
This section is displayed only if
- Runtime Application Protection is activated.
There are fewer than 500 attacks for an affected vulnerability.
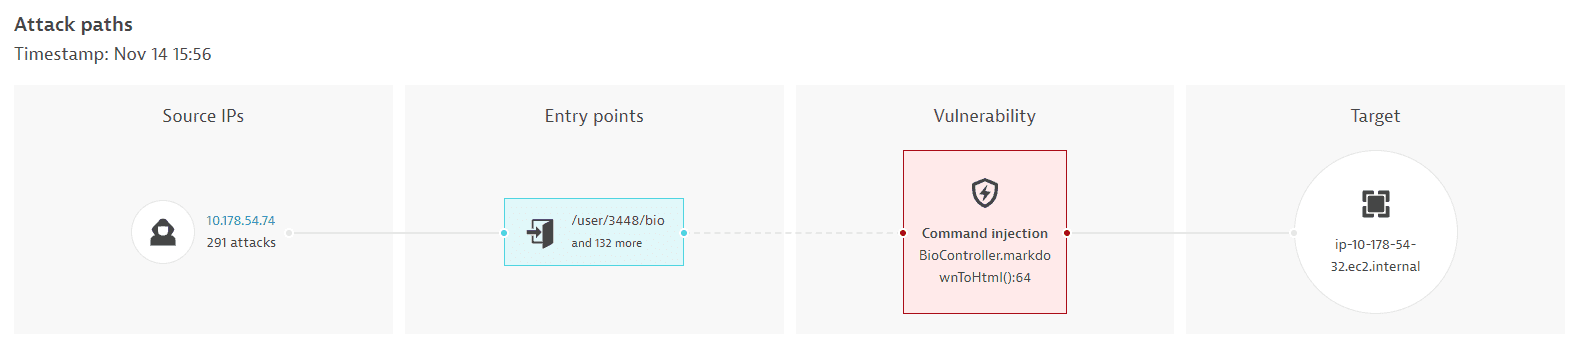
A visual representation of the attack paths, with information about the attack source IPs, entry points, affected vulnerability, and target name.
Attacks detected
This section is displayed only if Runtime Application Protection is activated.
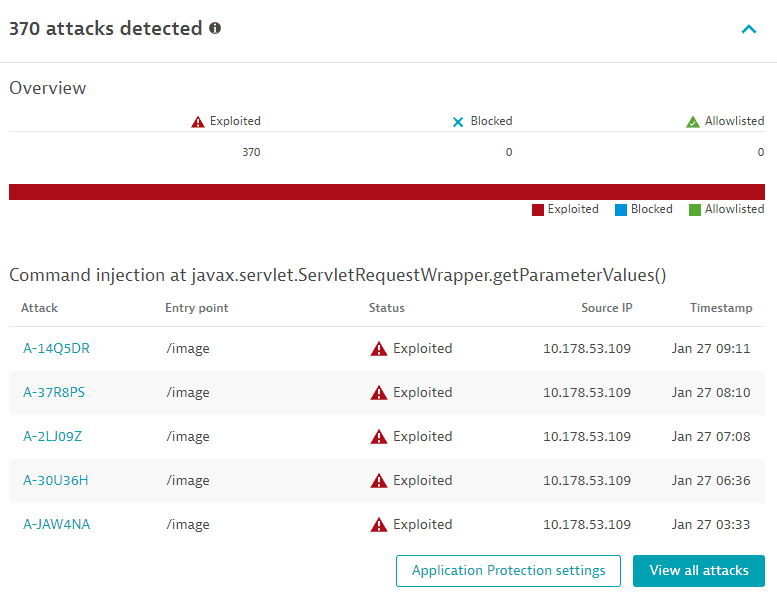
Identifies how many attacks were detected on the same vulnerability, and evaluates them by type (how many have been exploited, blocked, and allowlisted, out of the total number of attacks).
Lists the last five attacks that happened during the last 365 days, with details such as attack identifier (and a link to the respective attack details page, entry point, status (exploited, blocked, allowlisted), source IP, and timestamp.
- Select Application Protection settings to navigate to Application Protection: General settings.
- Select View all attacks to go to Attacks filtered by the vulnerability ID.
Related entities
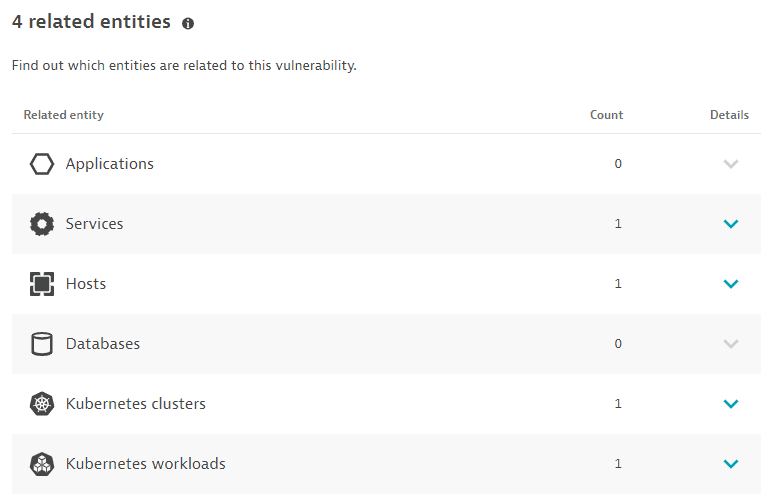
The number of applications, services, hosts, and databases that are somehow connected to the identified code-level vulnerability, based on the last hour, with links to the details page of the related entities:
- Applications: Applications that call a vulnerable service, or applications that call a non-vulnerable service that calls a vulnerable service.
Limitations: When determining related applications, the Dynatrace PurePath® distributed traces are not analyzed.
- Services: Services that directly run on a vulnerable process group instance.
- Hosts: Hosts on which the vulnerable process runs.
- Databases: Databases that run on the vulnerable process.
- Kubernetes workloads: In Kubernetes environments, the workloads to which the vulnerable process belongs.
- Kubernetes clusters: In Kubernetes environments, the clusters to which the vulnerable process belongs.
The Kubernetes workloads and Kubernetes clusters sections are displayed only if Kubernetes workloads or clusters are detected.
Vulnerability evolution
Use case: Have a better understanding of the evolution of a vulnerability over time.
The Vulnerability evolution section displays the following information.
Status
The current status of the vulnerability.
-
For open vulnerabilities, the current risk level and the time when the vulnerability was open, the current risk assessment, the number of affected processes, and a count of attacks that happened on this vulnerability during the last 365 days.
Example:
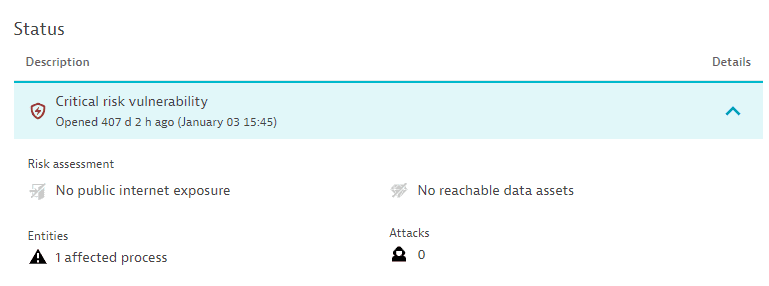
Attacks are displayed only if Runtime Application Protection is activated.
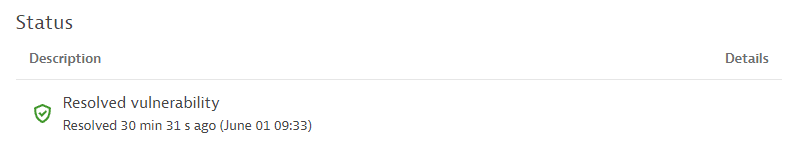
-
For resolved vulnerabilities, the current status and the time when it was resolved.
Latest events
The last 10 vulnerability status changes over the last 365 days.
If there are no status change events for over 365 days, this section is empty.
Possible status change events:
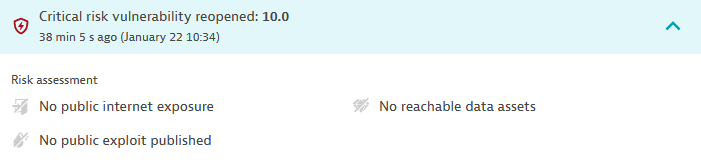
-
A vulnerability is open, resolved, or reopened. Displays the status change and the time when the change happened. For reopened vulnerabilities, select Details to see the risk assessment.
Example event:
-
A vulnerability is muted or unmuted. Displays the user who performed the change, the reason for the change, any comments, and the time when the change was performed.
Example event:

-
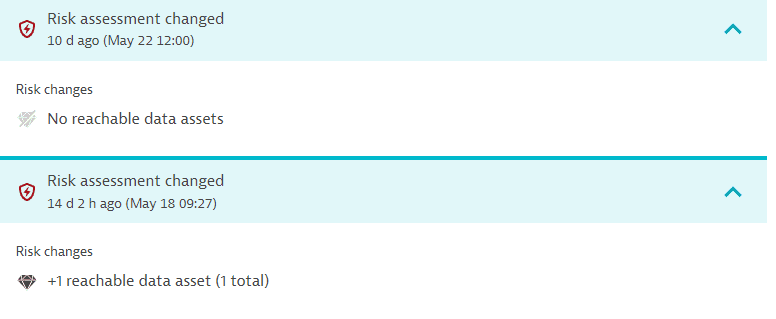
The vulnerability risk assessment has changed. Displays the time when the change happened and the risk change. Select Details to see the risk change. You can find out, for example, when a vulnerability that used to be exposed to the public internet is no longer exposed.
Example event:
-
A new attack is detected. Displays the time when this change happened.
Example event:

This event is displayed only if Runtime Application Protection is activated.
Reachable data assets
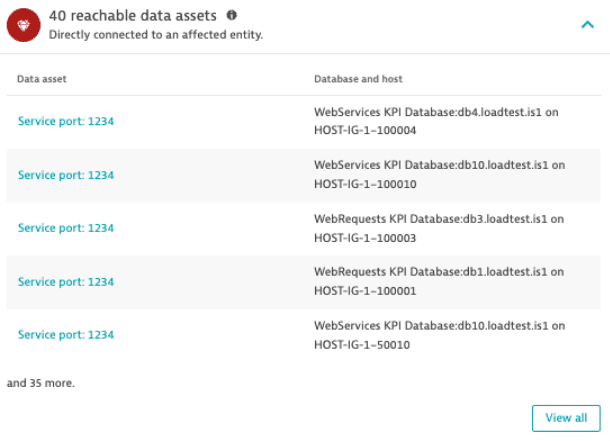
Lists reachable data assets exposed via the attack on the code-level vulnerability, based on the last hour (only applicable for SQL-injection types).
Select the database name to navigate to the respective database details page.