What is Dynatrace
Dynatrace is a revolutionary platform that delivers analytics and automation for unified observability and security.
- Answers and intelligent automation—Dynatrace uses causal AI to automate DevSecOps at scale and deliver the precise answers teams need to innovate and thrive in the modern cloud.
- Empowerment—Dynatrace breaks down team silos and proactively prevents issues before they affect end users.
- Solutions—Dynatrace solves critical digital challenges with all your observability, security, analytics, and automation solutions in one place.
The Dynatrace platform approach helps you solve a multitude of use case areas, and it will grow and adapt to solve new challenges while already enriching many areas of any organization. Our solutions in observability, security, analytics, and automation address the broadest range of use cases. And because our platform powers it all, you can create any unique use case, customized to ever-changing needs.
What you can do with Dynatrace
Dynatrace is an all-in-one platform that's purpose-built for a wide range of use cases.
-
Get automatic and intelligent observability across cloud and hybrid environments with continuous auto-discovery of hosts, VMs, serverless, cloud services, containers and Kubernetes, networks, devices, logs, events and more—all in context, with precise, AI-powered answers.
-
Get best-in-class APM from the category leader. Automatic and intelligent observability at scale for cloud-native workloads and enterprise applications helps you ensure end-to-end hybrid cloud distributed tracing, optimize service performance, innovate faster, collaborate efficiently, and deliver more value with less effort.
-
Empower DevSecOps at scale with a unique approach to securing cloud-native applications at runtime combined with intelligent automation.
-
Detect and block common attacks on application-layer vulnerabilities like SQL injection, command injection, and JNDI attacks. Protect against some critical zero-day attack types, like those for Log4Shell, while the vulnerability is being remediated.
-
Reduce the cost of investigating logs related to a current or suspected security incident like an application attack. Quickly and confidently verify what happened, leverage observability context to analyze, and take proactive action to strengthen defenses.
-
-
Improve user experiences with best-in-class digital experience monitoring. Ensure every application is available, functional, fast, and efficient across every channel, including mobile, web, IoT, and APIs.
-
Make data-driven decisions and improve business outcomes with precise analytics that deliver real-time business observability.
-
Accelerate digital transformation with simple yet powerful automations driven by observability and security insights.
-
Custom Solutions
-
Dynatrace is open, extensible, and can easily integrate with all major cloud platforms and solutions.
-
Unlock the full potential of Dynatrace by finding, activating, and running apps and extensions that address your specific observability needs. Dynatrace Hub is the central place to explore and activate all Dynatrace capabilities.
-
Use the Dynatrace App Toolkit from the command line to create, develop, and deploy Dynatrace Apps.
-
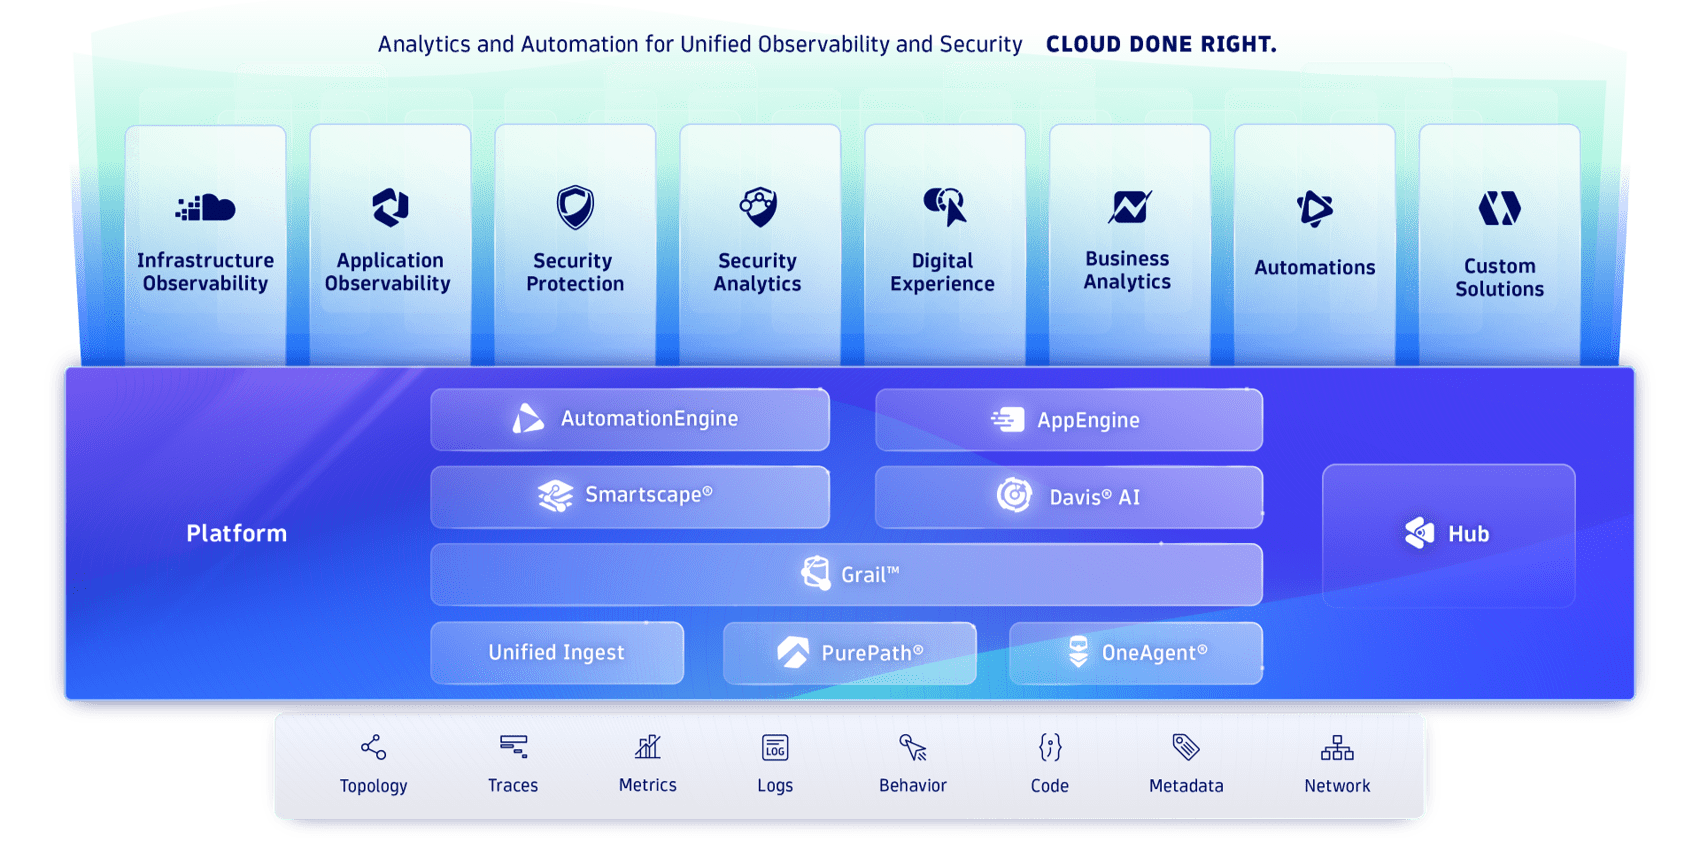
How Dynatrace works
Powerful core technologies combine to enable Dynatrace to deliver analytics and automation for unified observability and security in a fully extensible and adaptable environment.
AppEngine
Create and share custom apps that leverage insights from all your observability, security, and business data.

AutomationEngine
Accelerate digital transformation with simple yet powerful automations driven by observability and security insights.

Davis AI
Dynatrace Davis® uniquely combines predictive AI, causal AI, and generative AI for observability, security, and business use cases.

Grail
Grail™ is a causational data lakehouse with a massively parallel processing (MPP) analytics engine that leverages Dynatrace Query Language (DQL) for instant, AI-powered, context-rich analytics.

OneAgent
OneAgent® services automatically discover, activate, and instrument applications, microservices, infrastructure, and any dependencies in modern cloud environments.

Smartscape
Smartscape® dynamic environment-topology mapping visualizes the dynamic relationships among all application components across every tier.

Dynatrace architecture
Dynatrace is built for the cloud to be highly scalable, available, and secure.
Built for the cloud to monitor at hyperscale
Dynatrace is the only solution on the market architected with dynamic, web-scale cloud-native technologies.
Running on public clouds, Dynatrace is built on an elastic grid architecture that scales to 100,000+ hosts easily. We use the most robust enterprise-proven cloud technologies to provide a monitoring solution as resilient and available as the systems it monitors.
Cloud-native computing
Cloud-native block and object storage
Automated load balancing
Cassandra-based Hypercube storage
Elasticsearch-based search engine
Designed for always-on availability
Dynatrace runs across several AWS, Azure, and Google Cloud regions, operating in at least three availability zones for each region.
Automatic scaling and load balancing capabilities ensure that new computing instances spin up automatically to meet spikes in demand and/or traffic.
Real-time failover redundancy is built into all system components.
Automated management layer detects faulty components and replaces them immediately.
One-third of excess capacity in our clusters is always reserved for real-time failover and the ability to cope with peak loads in real time.
Guaranteed ≥ 99.5% uptime
Secure by design
Dynatrace has been designed on industry best practices such as encrypted transmissions, cross-site scripting prevention, firewalls, regular security updates, security scans, and vulnerability assessments to ensure the security of your data. Auditing, access restrictions, and secure decommissioning of data storage complement the design.
Because Dynatrace is hosted in the cloud, it benefits from world-class data centers, which are certified for ISO 27001, PCI-DSS Level 1, and SOC 1 / SSAE 16.
Dynatrace has received SOC 2 Type II certification for security and availability.
Part of your enterprise cloud ecosystem
Dynatrace is integrated with key components of your enterprise cloud ecosystem to support dynamic cloud orchestration on AWS, Azure, Google Cloud, VMware Tanzu Application Service, Red Hat OpenShift, Kubernetes, and others. In these environments, Dynatrace automatically launches and monitors the full cloud stack and all the applications and containers running within the stack, including applications and workloads that may traverse multiple cloud and hybrid environments.
Our close integration with cloud platforms helps you simplify development and operations, increase visibility, and improve situational awareness across hybrid, multicloud environments.
![]()