Categorical charts
Latest Dynatrace
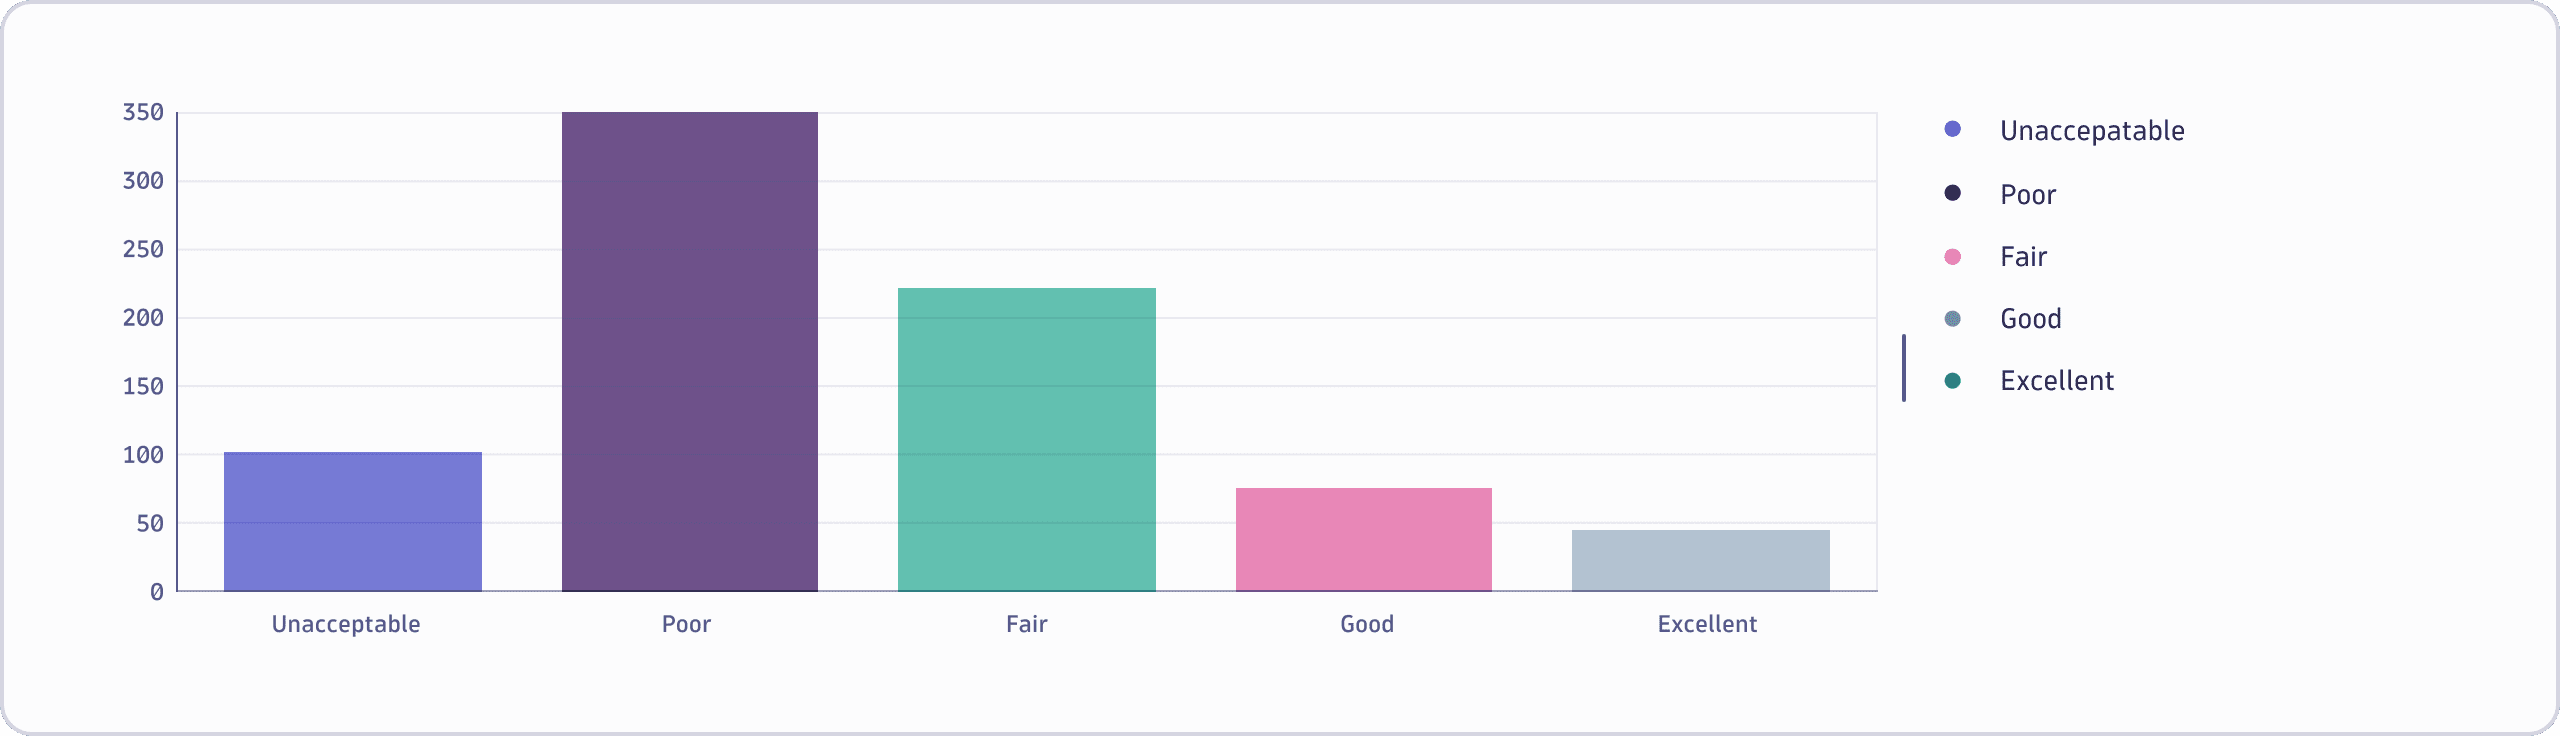
Categorical data has no time dimension. Instead, the data is grouped into categories and sub-categories. This chart type displays one axis of continuous numerical values and another axis that shows the categories.
Categorical chart variants
Dynatrace visualizations provide two categorical chart types
Pie/Donut chart
- Bar chart, including:
Stacked bar chart vertical
Stacked bar chart horizontal
Grouped bar chart vertical
Grouped bar chart horizontal