Metric events anomaly detection API - GET an event
This API is deprecated. Use the Settings API instead. Look for the Metric events (builtin:anomaly-detection.metric-events) schema.
Gets parameters of the specified metric event rule.
The request produces an application/json payload.
| GET | ManagedDynatrace for Government | https://{your-domain}/e/{your-environment-id}/api/config/v1/anomalyDetection/metricEvents/{id} |
| SaaS | https://{your-environment-id}.live.dynatrace.com/api/config/v1/anomalyDetection/metricEvents/{id} | |
| Environment ActiveGate | https://{your-activegate-domain}:9999/e/{your-environment-id}/api/config/v1/anomalyDetection/metricEvents/{id} |
Authentication
To execute this request, you need an access token with ReadConfig scope.
To learn how to obtain and use it, see Tokens and authentication.
Parameters
| Parameter | Type | Description | In | Required |
|---|---|---|---|---|
| id | string | The ID of the required metric event. | path | required |
Response
To find all JSON models that depend on the type of the model, refer to JSON models.
Response codes
| Code | Type | Description |
|---|---|---|
| 200 | MetricEvent | Success |
Response body objects
The MetricEvent object
The configuration of the metric event.
| Element | Type | Description |
|---|---|---|
| aggregationType | string | How the metric data points are aggregated for the evaluation. The timeseries must support this aggregation.
|
| alertingScope | MetricEventAlertingScope[] | Defines the scope of the metric event. Only one filter is allowed per filter type, except for tags, where up to 3 are allowed. The filters are combined by conjunction. |
| description | string | The description of the metric event. |
| disabledReason | string | The reason of automatic disabling. The
|
| enabled | boolean | The metric event is enabled ( |
| id | string | The ID of the metric event. |
| metadata | ConfigurationMetadata | Metadata useful for debugging |
| metricDimensions | MetricEventDimensions[] | Defines the dimensions of the metric to alert on. The filters are combined by conjunction. |
| metricId | string | The ID of the metric evaluated by the metric event. |
| metricSelector | string | The metric selector that should be executed. |
| monitoringStrategy | MetricEventMonitoringStrategy | A monitoring strategy for a metric event config. This is the base version of the monitoring strategy, depending on the type, the actual JSON may contain additional fields. |
| name | string | The name of the metric event displayed in the UI. |
| primaryDimensionKey | string | Defines which dimension key should be used for the alertingScope. |
| queryOffset | integer | Defines the query offset to adapt the evaluation timeframe for known metric latency. |
| severity | string | The type of the event to trigger on the threshold violation. The
|
| warningReason | string | The reason of a warning set on the config. The
|
The MetricEventAlertingScope object
A single filter for the alerting scope.
The actual set of fields depends on type of the filter. Find the list of actual objects in the description of the filterType field or see Metric events anomaly detection API - JSON models.
| Element | Type | Description |
|---|---|---|
| filterType | string | Defines the actual set of fields depending on the value. See one of the following objects:
|
The ConfigurationMetadata object
Metadata useful for debugging
| Element | Type | Description |
|---|---|---|
| clusterVersion | string | Dynatrace version. |
| configurationVersions | integer[] | A sorted list of the version numbers of the configuration. |
| currentConfigurationVersions | string[] | A sorted list of version numbers of the configuration. |
The MetricEventDimensions object
A single filter for the metrics dimensions.
The actual set of fields depends on type of the filter. Find the list of actual objects in the description of the filterType field or see Metric events anomaly detection API - JSON models.
| Element | Type | Description |
|---|---|---|
| filterType | string | Defines the actual set of fields depending on the value. See one of the following objects:
|
| key | string | The dimensions key on the metric. |
The MetricEventMonitoringStrategy object
A monitoring strategy for a metric event config.
This is the base version of the monitoring strategy, depending on the type, the actual JSON may contain additional fields.
| Element | Type | Description |
|---|---|---|
| type | string | Defines the actual set of fields depending on the value. See one of the following objects:
|
Response body JSON model
{"aggregationType": "AVG","alertingScope": [{"entityId": "HOST-000000000001E240","filterType": "ENTITY_ID"},{"filterType": "TAG","tagFilter": {"context": "CONTEXTLESS","key": "someKey","value": "someValue"}}],"description": "This is the description for my metric event.","disabledReason": "NONE","enabled": true,"metadata": {"clusterVersion": "Mock version","configurationVersions": [4,2]},"metricDimensions": [{"filterType": "ENTITY","key": "dt.entity.disk","nameFilter": {"operator": "EQUALS","value": "diskName"}}],"metricId": "com.dynatrace.builtin:host.disk.bytesread","monitoringStrategy": {"alertCondition": "ABOVE","dealertingSamples": 5,"samples": 5,"threshold": 80,"type": "STATIC_THRESHOLD","unit": "KILO_BYTE_PER_SECOND","violatingSamples": 3},"name": "My metric event","severity": "CUSTOM_ALERT","warningReason": "NONE"}
Example
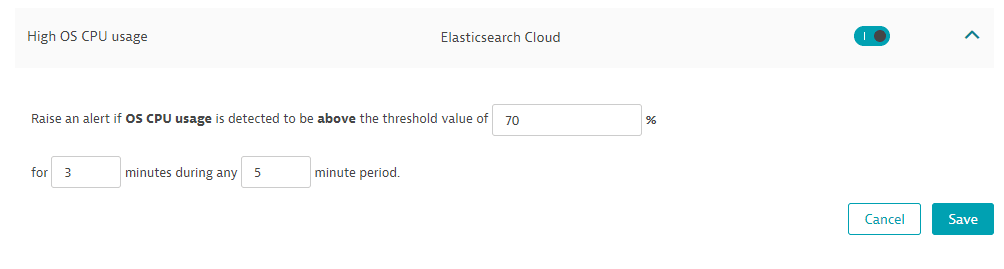
In this example, the request lists the parameters of the High OS CPU usage custom metric event rule.
The API token is passed in the Authorization header.
The rule has the following parameters:
Curl
curl -X GET \https://mySampleEnv.live.dynatrace.com/api/config/v1/anomalyDetection/metricEvents/dynatrace.remote.python.elasticsearch:node.os.cpu_percent:node.os.cpu_percent.high_usage \-H 'Authorization: Api-Token dt0c01.abc123.abcdefjhij1234567890'
Request URL
https://mySampleEnv.live.dynatrace.com/api/config/v1/anomalyDetection/metricEvents/dynatrace.remote.python.elasticsearch:node.os.cpu_percent:node.os.cpu_percent.high_usage
Response body
{"metadata": {"clusterVersion": "1.164.0.20190211-085949","configurationVersions": [2]},"id": "dynatrace.remote.python.elasticsearch:node.os.cpu_percent:node.os.cpu_percent.high_usage","metricId": "dynatrace.remote.python.elasticsearch:node.os.cpu_percent","name": "High OS CPU usage","description": "The OS CPU usage is {alert_condition} the threshold of {threshold}","aggregationType": "AVG","eventType": "PERFORMANCE","alertCondition": "ABOVE","samples": 5,"violatingSamples": 3,"dealertingSamples": 5,"threshold": 70,"enabled": true,"tagFilters": []}
Response code
200