
Anticipatory management of cloud resources within highly dynamic IT systems is a critical success factor for modern companies. Operators need to closely observe business-critical resources such as storage, CPU, and memory to avoid outages that are driven by resource shortages.
| >> Scroll down to see Davis Forecasting in action |
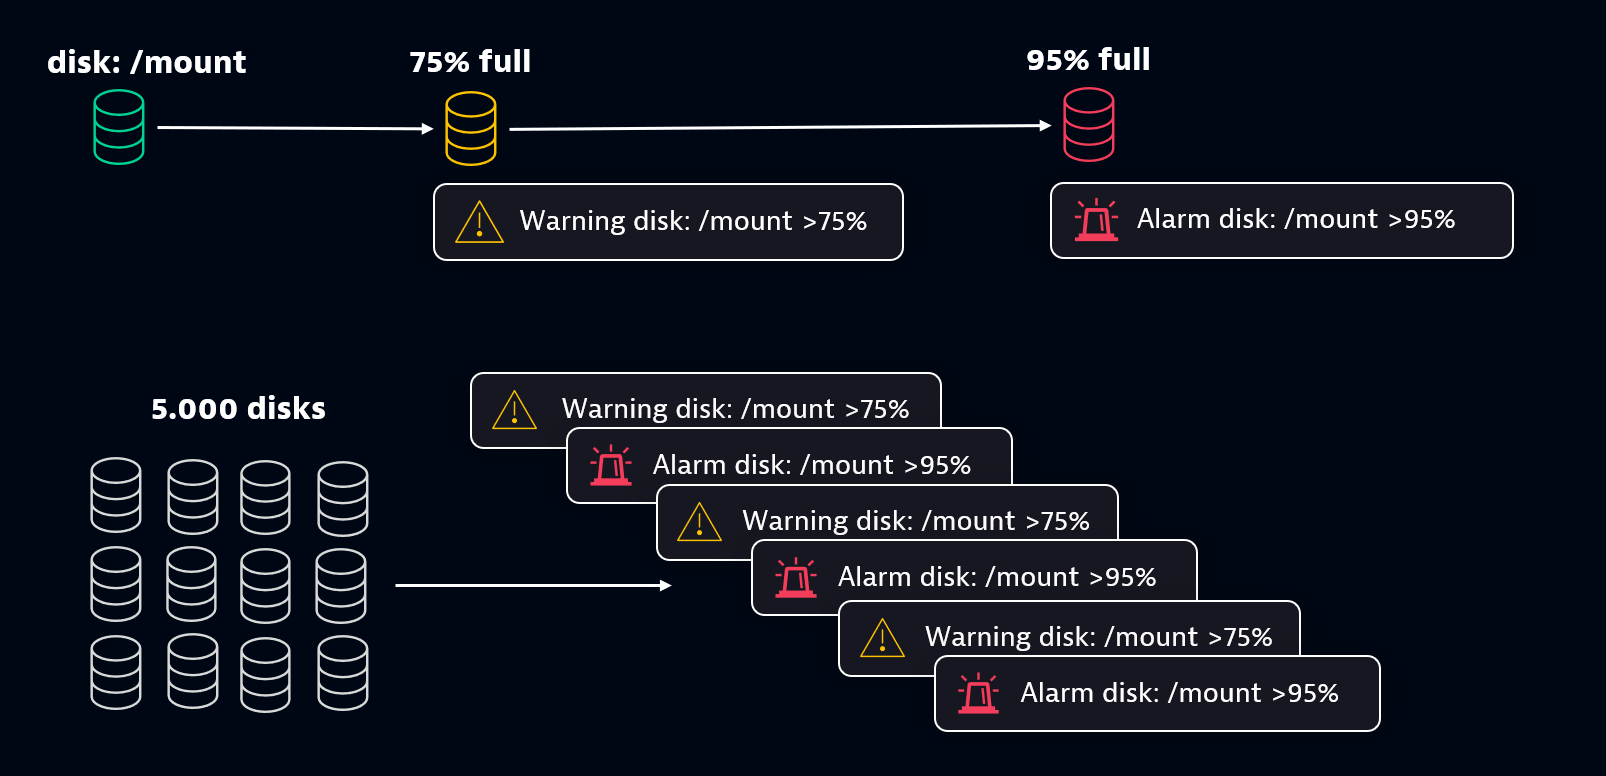
Traditionally, cloud-resource management is done by collecting telemetry data for critical-capacity resources and configuring multi-level reactive alerting (warnings, errors, and critical errors) for those resources.
While the traditional approach to cloud-resource management might have been acceptable in the past, it doesn’t scale up to address the requirements of modern cloud environments. Highly dynamic services are deployed to the cloud globally, where resources are requested and deployed on demand. The end result of this global scale is that—without the right tools—operators are completely lost in alert storms.
Some of our customers run tens of thousands of storage disks in parallel, all needing continuous resizing. This can lead to hundreds of warnings and errors every week. The most annoying aspect of this, according to the operations teams, is that alerts are often sent after business hours, including on weekends.
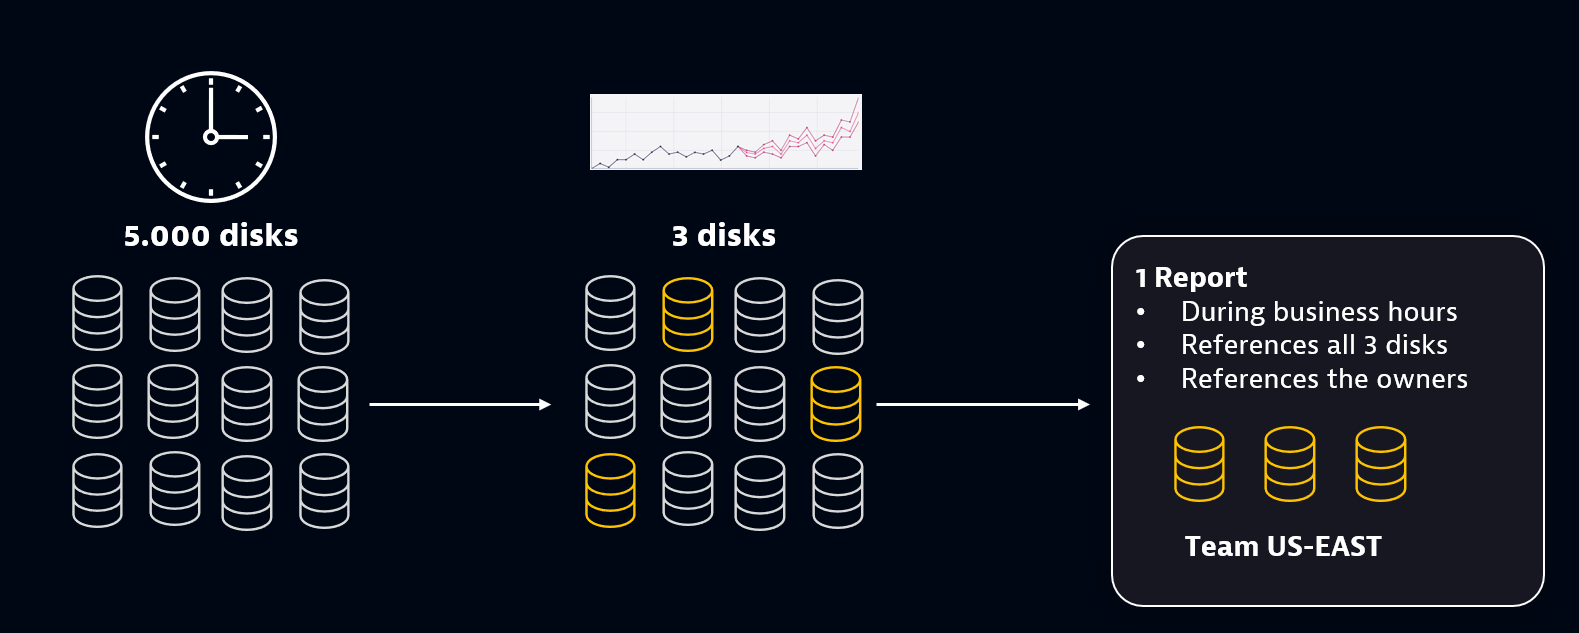
One effective capacity-management strategy is to switch from a reactive approach to an anticipative approach: all necessary capacity resources are measured, and those measurements are used to train a prediction model that forecasts future demand.
The example below shows how the reactive approach can be transformed into a scheduled, predictive capacity management model. With this approach, when available capacity of a critical resource is forecast to soon fall below acceptable levels, the operations team is notified with a single report, sent during business hours, well in advance of the resource actually experiencing a resource shortage.
Use Grail and Davis to predict capacity demands
The Dynatrace Query Language (DQL) allows you to analyze all data that’s stored for your environment within the Dynatrace Grail™ data lakehouse. With the newly introduced Notebooks, you can use DQL for exploratory analysis of any capacity-related telemetry.
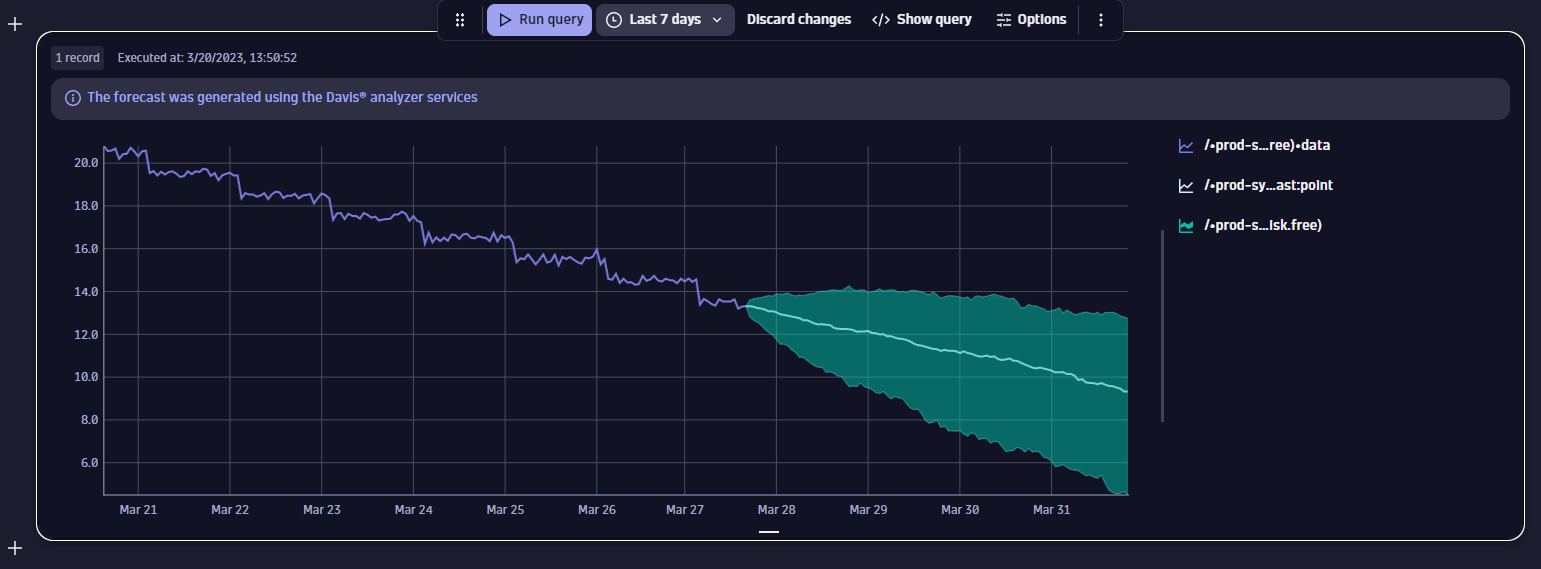
The screenshot below shows a section of an example notebook that plots the average percentage of free disk space over the last 7 days.
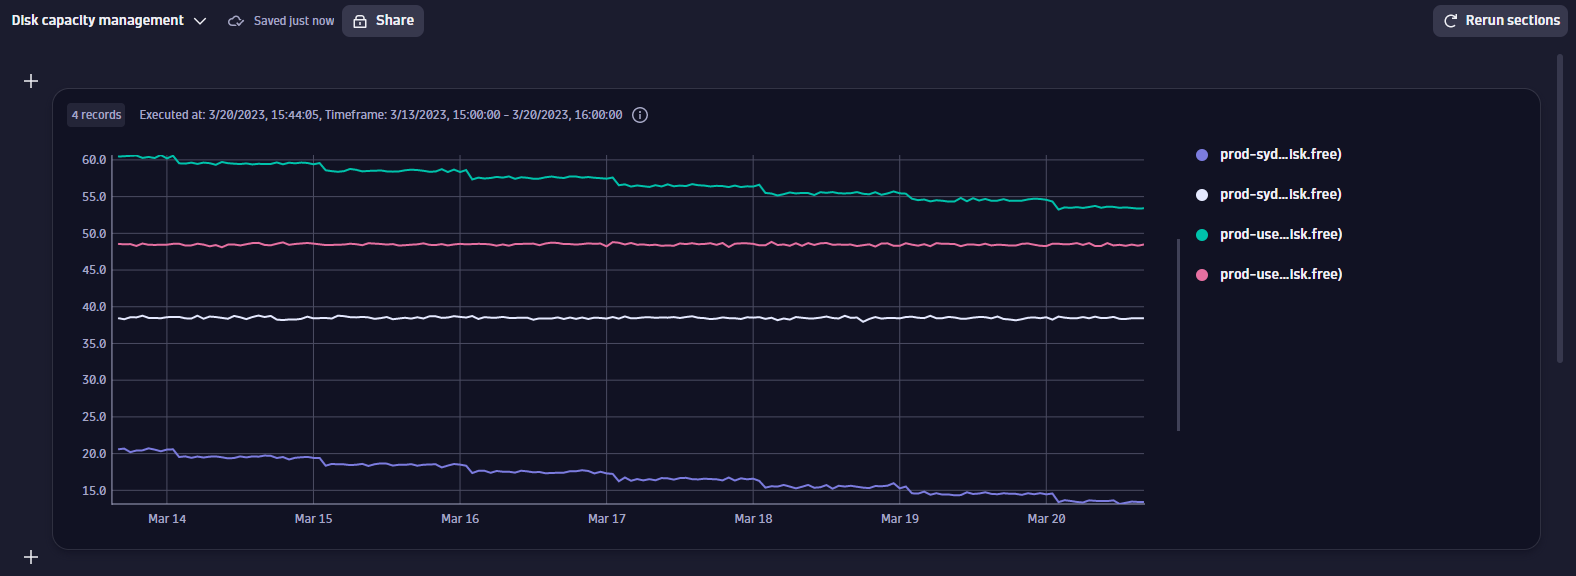
Select any line in the chart to display the available actions for that line. For example, you can request that Davis AI forecast the future of any given time series.
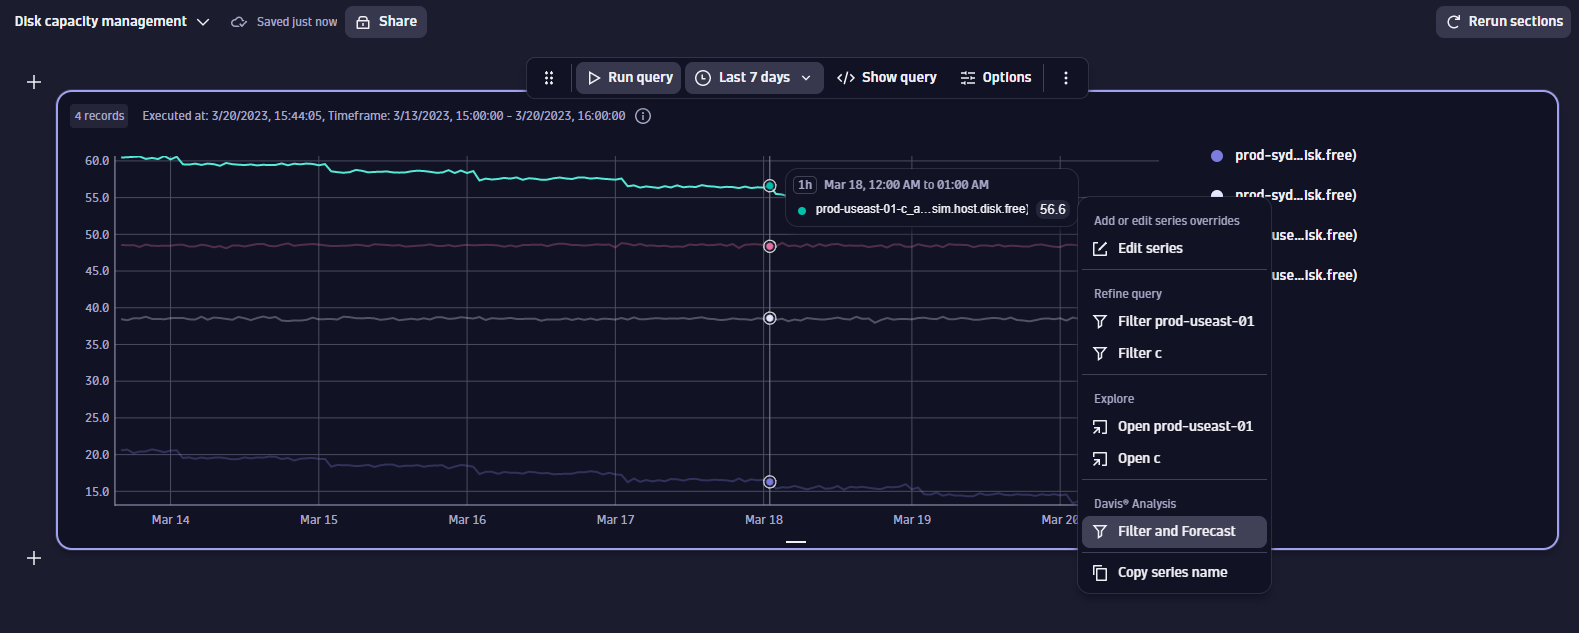
Davis AI analyzes the selected time series, automatically chooses the best prediction model based on the characteristics of the time series, and then trains a prediction model. After the training is finished, the notebook chart shows a probabilistic forecast of the given time series with upper and lower bounds as well as the predicted value.
The example result of the trained prediction model on this disk capacity measurement shows that the lower bound of the prediction (worst case scenario) will fall below 6% free disk capacity in early April.
Given this information, the operations team can anticipate that they need to resize this disk before early April (during business hours, of course).
While this notebook focuses on only one disk, Davis Forecast can learn and predict the future capacity needs of thousands of individual disks in parallel. For example, in our own cloud infrastructure at Dynatrace, we track over 8,000 disks that require periodic resizing. By running a scheduled, weekly forecast, our cloud automation teams avoid reactive alerts sent outside of business hours.
Reactive alerts as last line of defense
Of course, unexpected things still happen and a weekly forecast can’t, for example, anticipate a customer onboarding 5,000 OneAgents on a Sunday morning. Therefore, reactive alert conditions remain in place, to ensure that alerts are still sent if needed during unexpected events. Scheduled forecasts do not replace these reactive alerts, rather they serve as a last line of defense for unforeseen situations.
AutoML detects seasonality and chooses the best prediction model
Dynatrace invested significantly into simplifying prediction and forecasting for you. You can use any DQL query that yields a time series to train a prediction model. This AutoML approach analyzes the statistical characteristics of any time series (variance, seasonality, trend, and noise) to determine the best prediction model.
The AutoML approach also helps when you need to automate your forecasts and the underlying metric characteristics change over time. Please see Davis Forecast analysis documentation to learn more about our AutoML approach and which algorithms are used within the Davis Forecast service.
So far, we’ve only discussed resource consumption measurements, which by nature show more linear changes than seasonal characteristics. Now let’s see how the AutoML approach selects the best suitable method for a time series that has seasonal behavior. The example below shows that Davis Forecast automatically detects any given seasonality, independent of the noise level, and correctly returns a probabilistic forecast.
Automate your Davis capacity forecasts
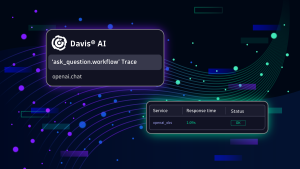
While the operations team could regularly check this notebook, see what Davis Forecast anticipates as the upcoming capacity need, and then proactively resize all disks that will run out of space the following week, the better option is to use the newly introduced AutomationEngine to schedule an automated weekly Davis prediction workflow. With this approach, an automated workflow can automatically run a forecast for all disks, check against a critical capacity limit, and notify the operations team with a list of the disks that need their attention. Below is an example of such a workflow that includes a Davis Forecast action and a notification email action. The new forecasting capabilities together with Dynatrace AutomationEngine and the Workflows app, allow you to automate any predictive analytics in a few simple steps.
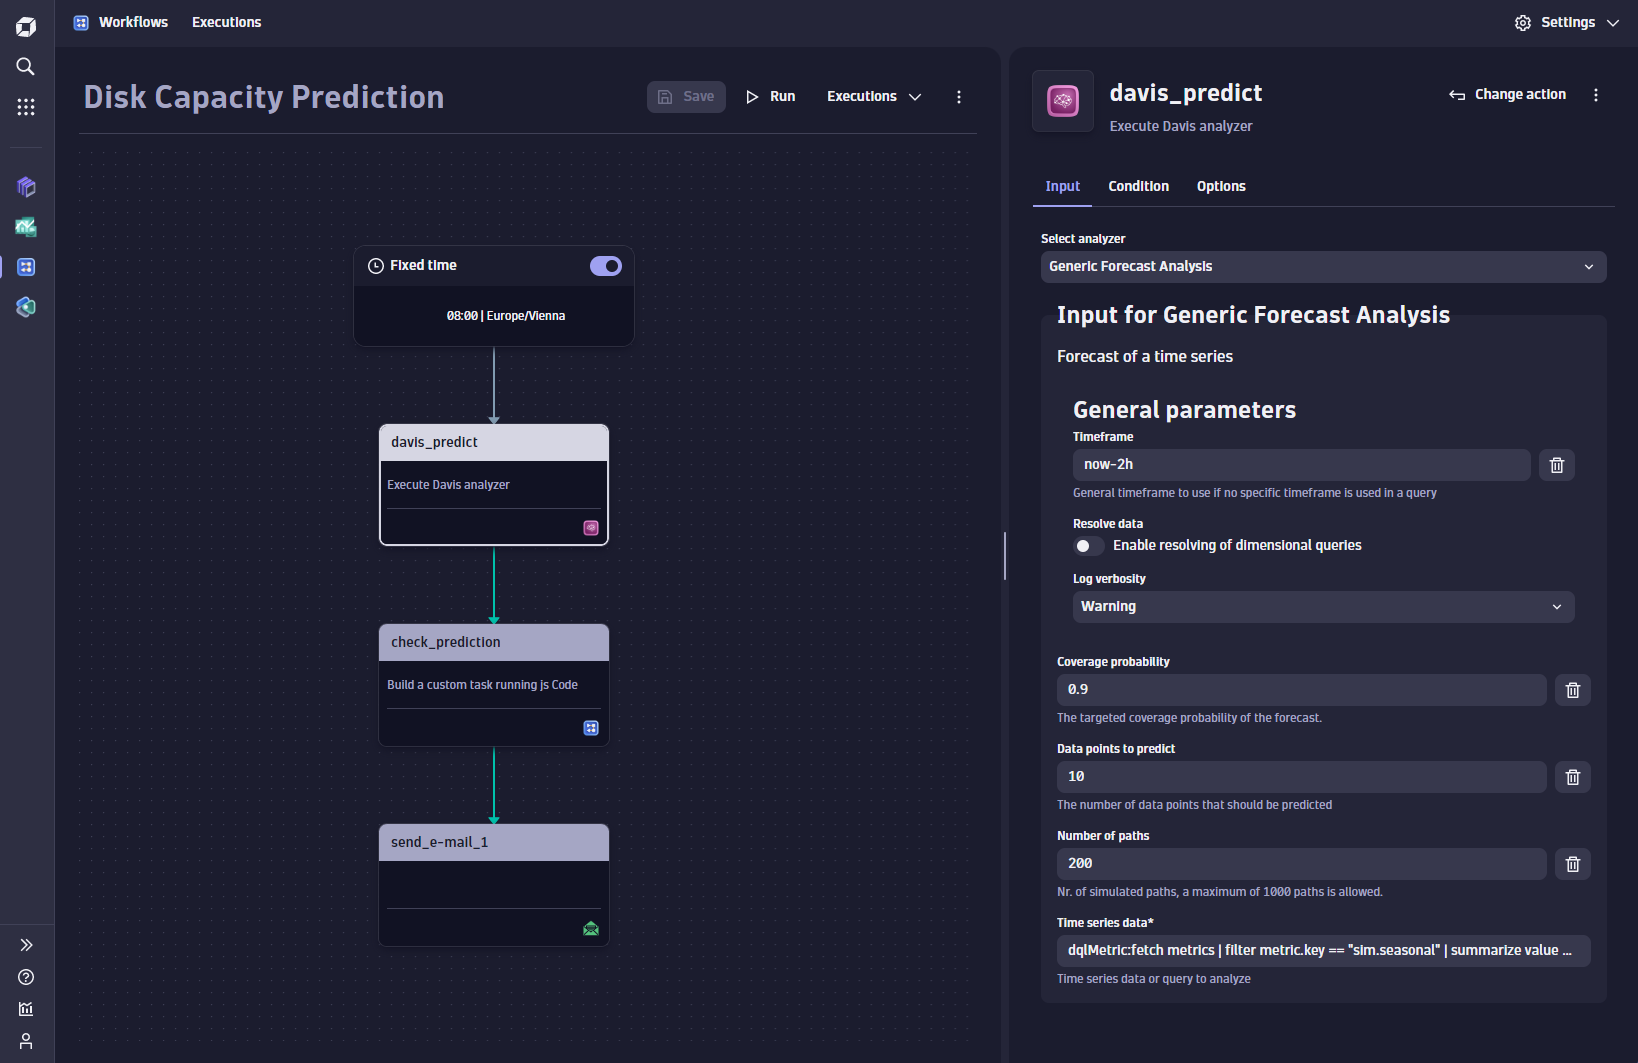
This use case can be spun even further: so far, we’ve automated the forecast and introduced reporting for the disks that need to be resized. Once the operations team becomes familiar with the anticipatory approach, full automation can easily be configured by adding additional action steps within the existing workflow, for example, automated provisioning of new disk space.
Summary
Davis Forecast provides a powerful mechanism on top of the Grail data lakehouse that enables organizations to switch from reactive strategies to more proactive anticipative strategies. Such predictive approaches help avoid outages and reactive alert storms outside business hours.
By offering a standard forecast mechanism on top of the powerful DQL query language, Dynatrace opens predictive analytics for any kind of anticipative use cases, including the business-critical topic of predictive capacity management. These new analytics capabilities can be used as part of your exploratory analytics in Notebooks, as a step within workflows, or as part of your custom app–addressing your specific business needs with Dynatrace AppEngine.
See Davis Forecasting in action
Check out the “Forecasting with Dynatrace” Observability Clinic, where Linda Gratzer, Andreas Grabner, and Bernhard Kepplinger dig deeper into the topic of forecasting and the data science behind it, and also share a live demonstration.
For further details, have a look at our Davis AI Forecast Analytics documentation, or watch the recording of my Perform breakout session, Easy forecasting and predictive analytics with Davis AI.
We are of course highly interested in your feedback! We encourage you to try out Davis Forecasting and then head over to the Dynatrace Community and share your suggestions and product ideas, to help us continuously improve the Dynatrace platform.


Looking for answers?
Start a new discussion or ask for help in our Q&A forum.
Go to forum