Microsoft SQL Server monitoring
This extension documentation is now deprecated and will no longer be updated. We recommend using the new Microsoft SQL Server extension for improved functionality and support.
Monitor a Microsoft SQL Server instance remotely using the ActiveGate extension.
Prerequisites
- Microsoft SQL Server with mainstream or extended support by Microsoft. Check the Microsoft documentation for end-of-life details.
ActiveGate version 1.242+
Database user permissions as described below
Database user permissions
The following permissions must be granted to the user with which the extension connects to a SQL Server instance:
- Permissions specified in the Microsoft documentation for
sys.dm_os_performance_countersare required. - System table
msdb.sys.backupsetis required for monitoring backups per database (optional). This table is present in almost every version of SQL Server except for Azure SQL (PaaS). - On SQL Server and SQL Managed Instance, requires
VIEW SERVER STATEpermission. On SQL Database Basic, S0, and S1 service objectives, and for databases in elastic pools, the server admin account or the Azure Active Directory admin account is required.
- On all other SQL Database service objectives, the
VIEW DATABASE STATEpermission is required in the database.
Windows Auth is not yet supported as a connection mechanism.
Extension activation
To install the extension
- In Dynatrace Hub, select and install the Microsoft SQL Server extension.
Configure monitoring as described below.
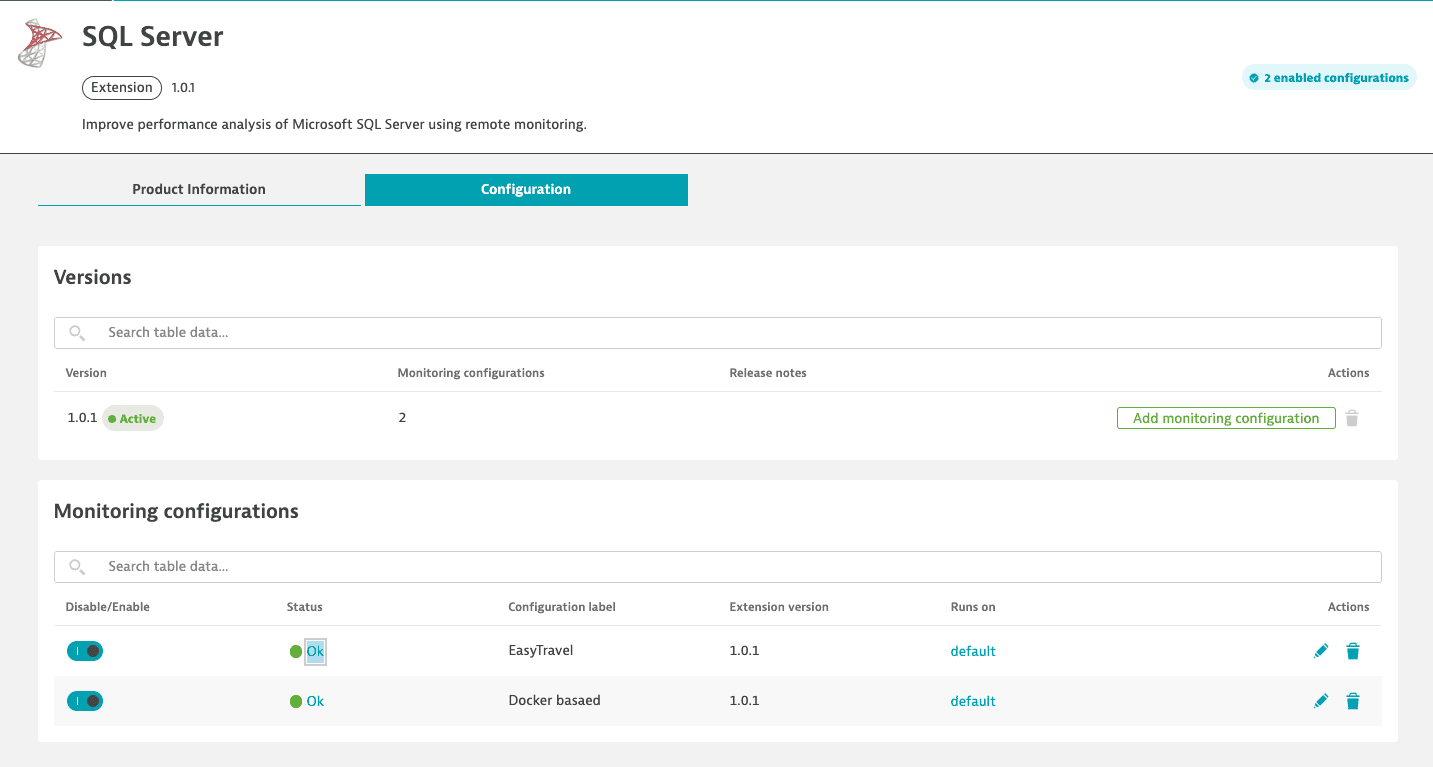
Monitoring configuration
The following steps describe how to configure a monitoring configuration endpoint.
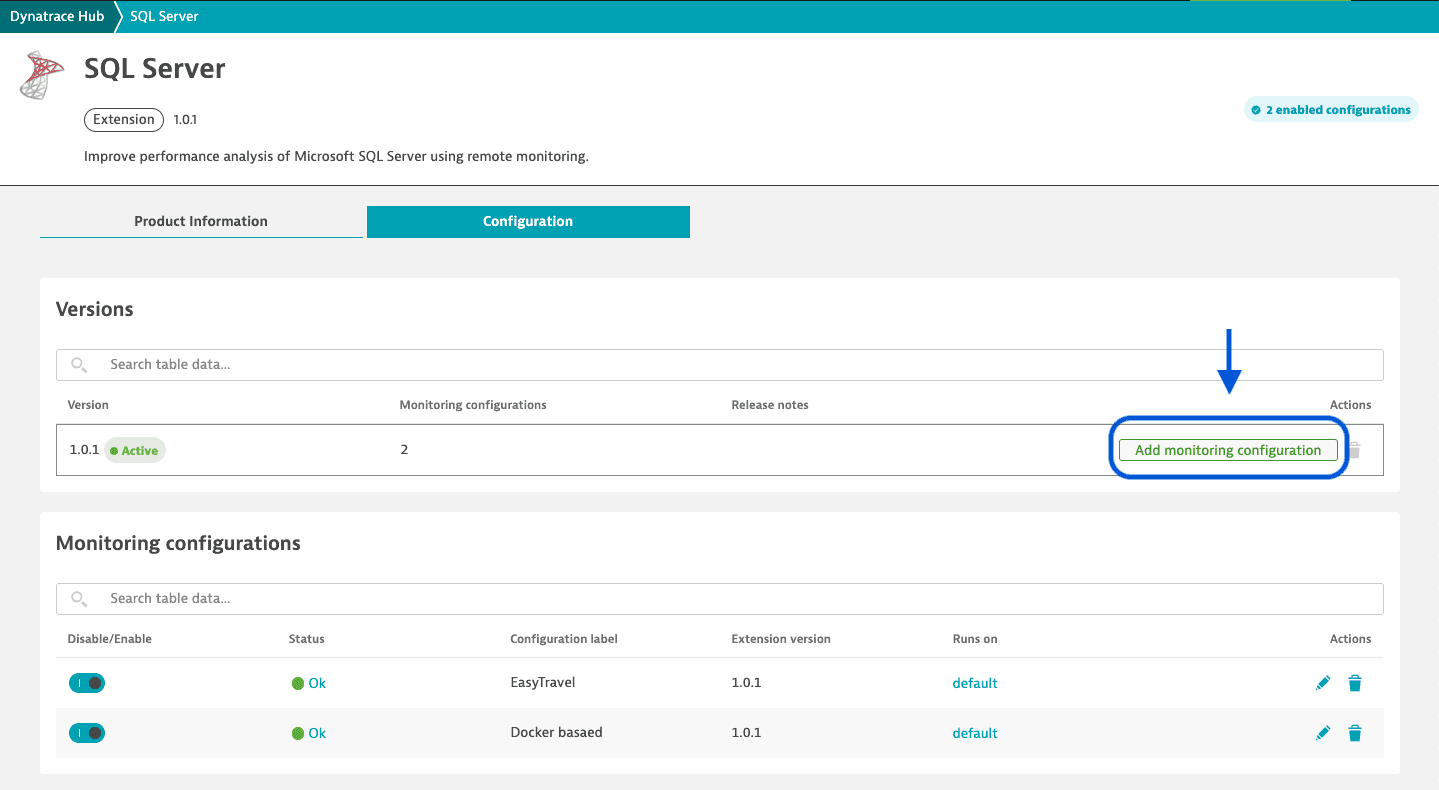
-
Select Add monitoring configuration.
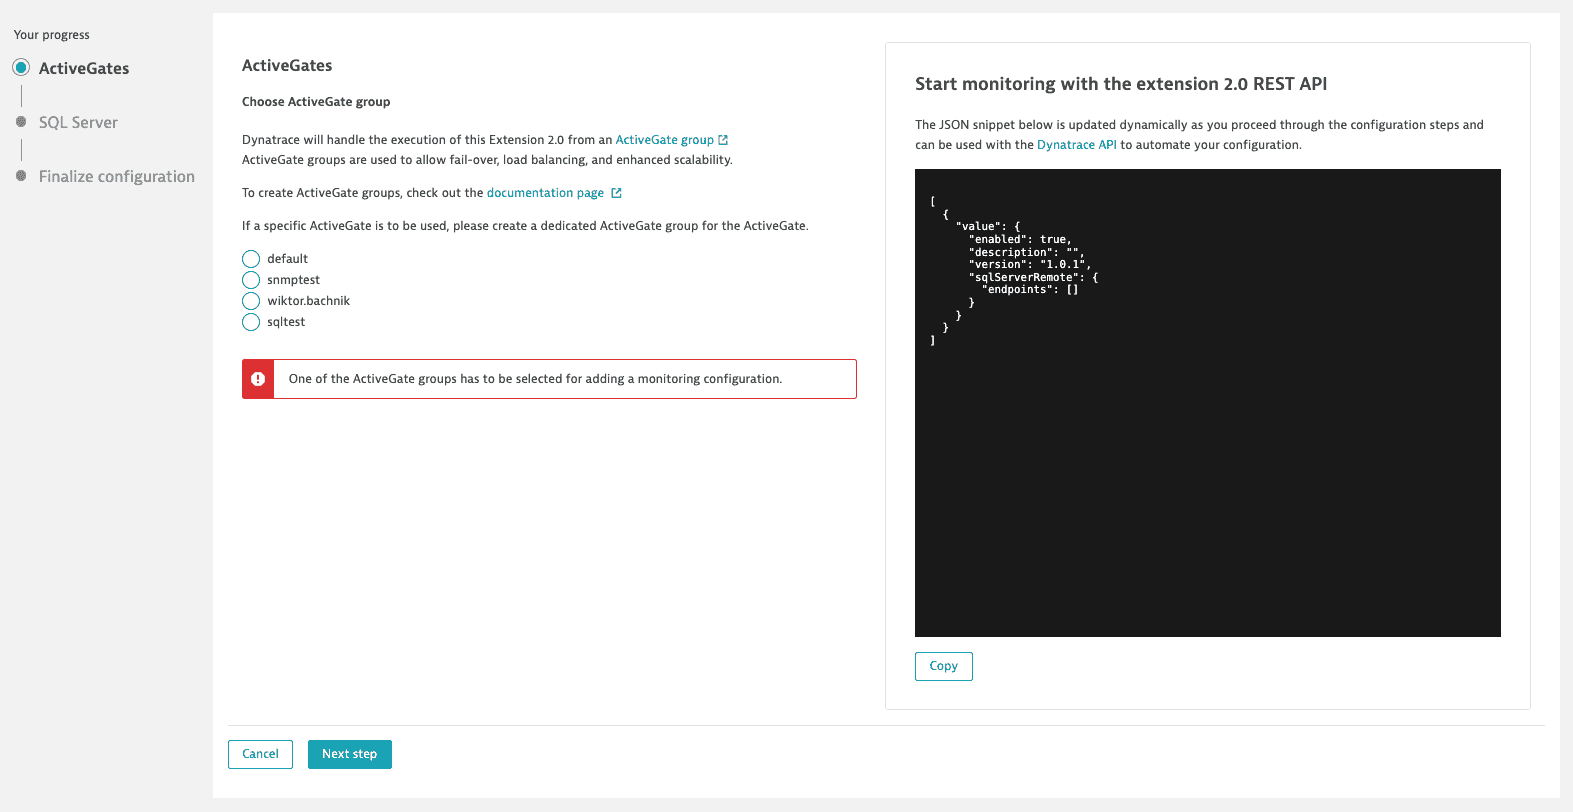
-
Choose ActiveGates that will run this monitoring configuration.
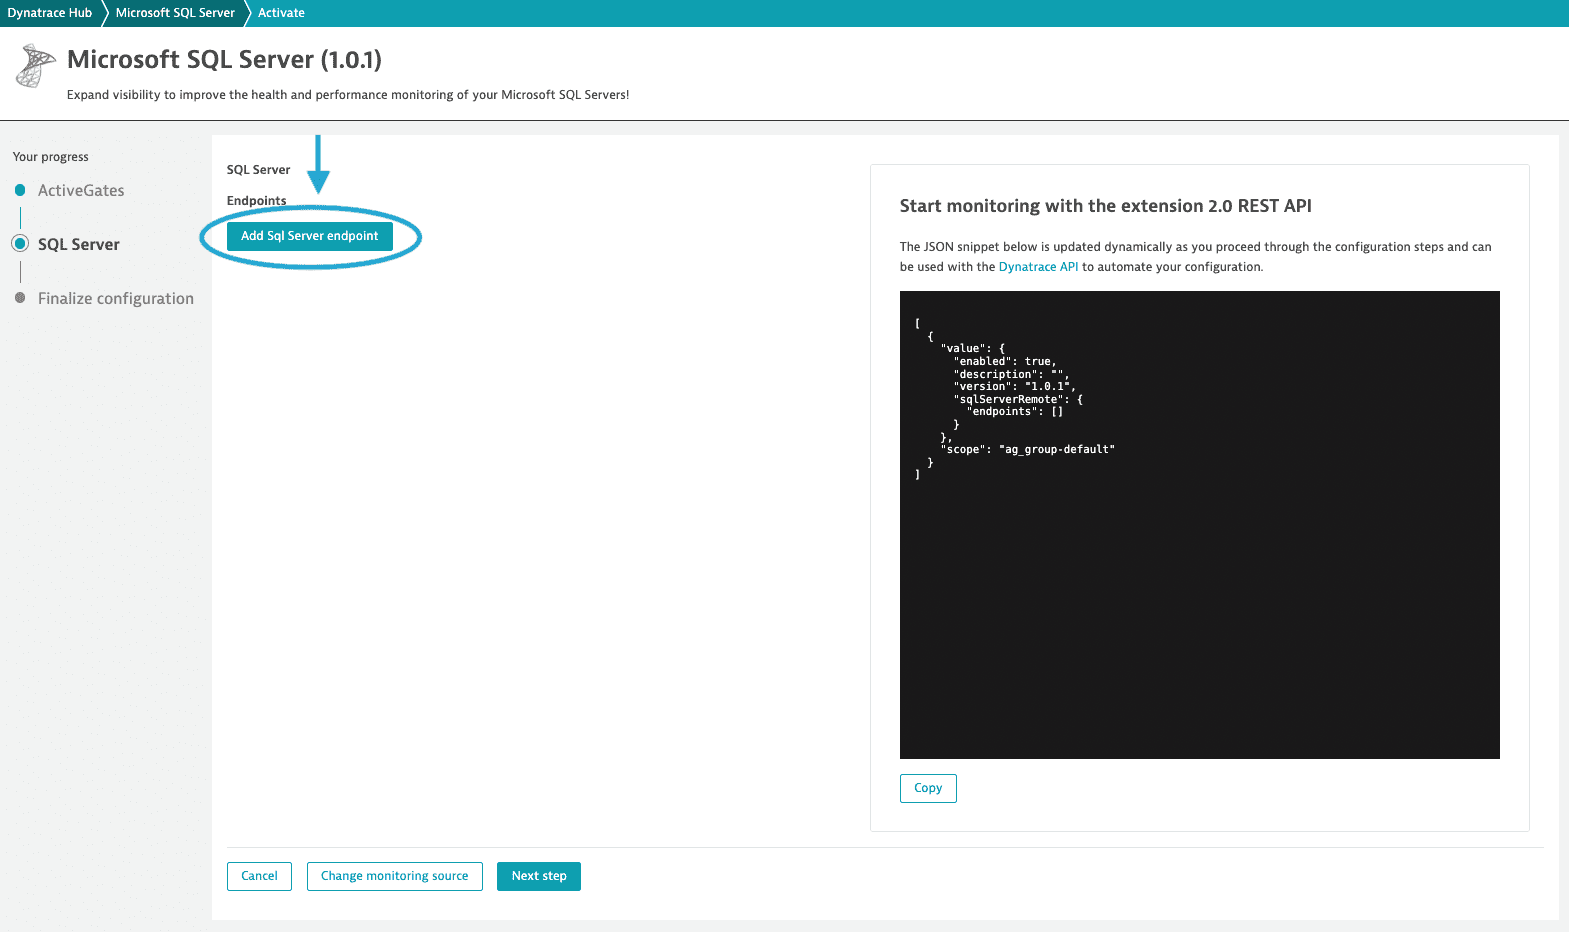
-
Select Add Sql Server endpoint.
Endpoints are automatically distributed between ActiveGates within a certain chosen group. This allows for High Availability (HA) and load balancing between several ActiveGate instances.
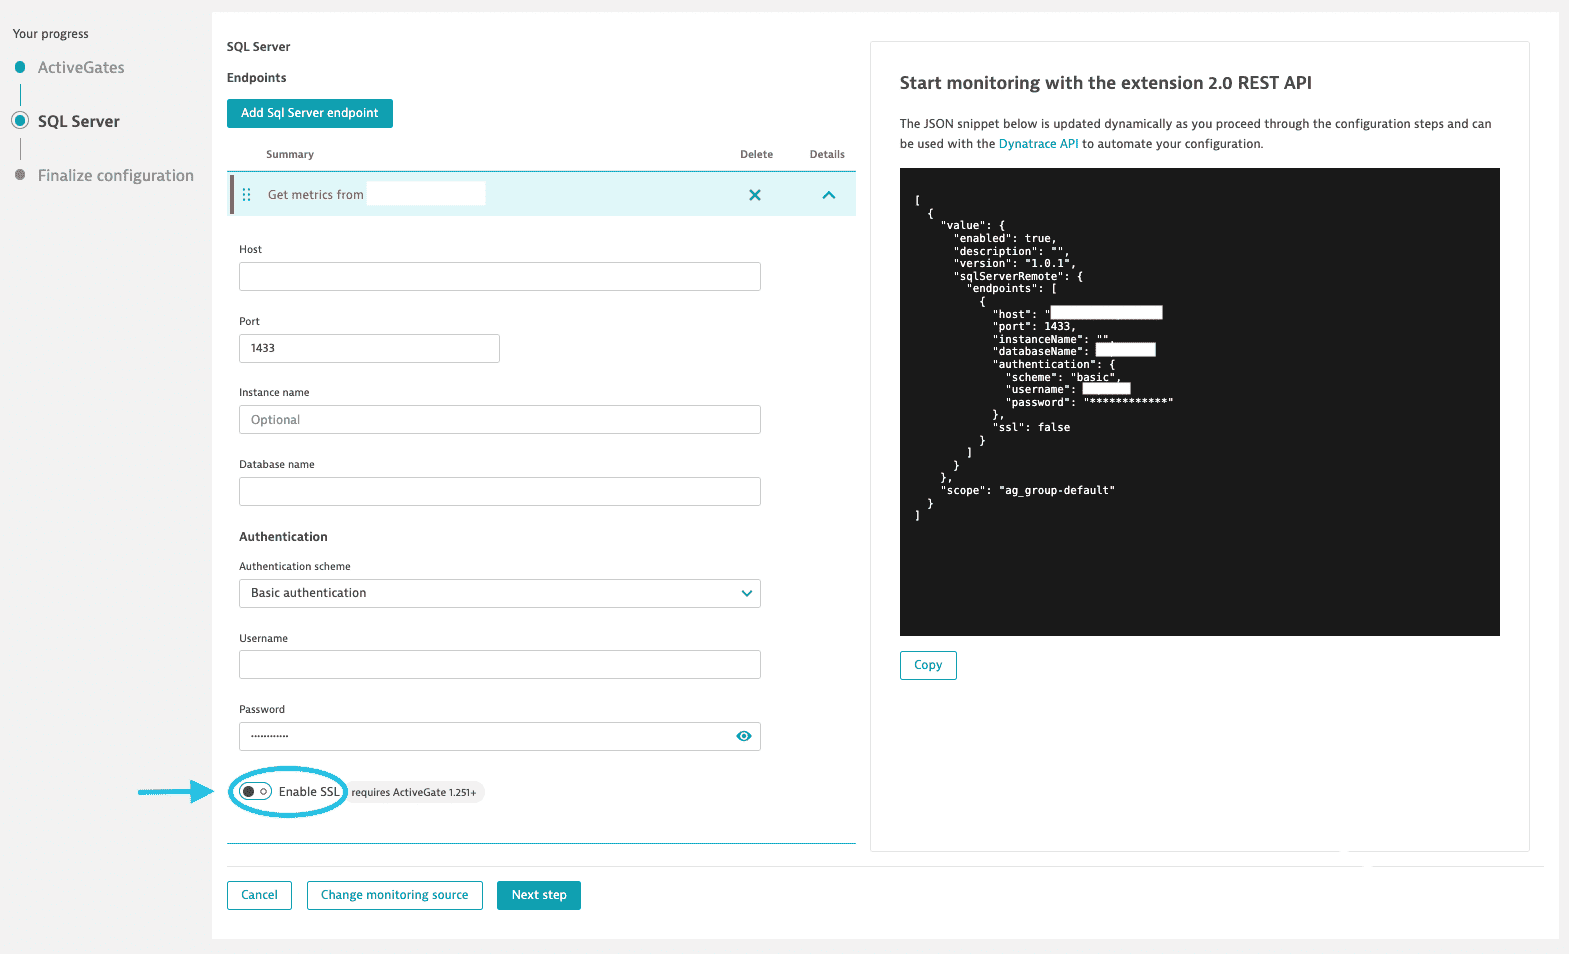
-
Specify connection parameters and credentials.
optional You can also enable SSL to make the data source verify the server certificate and use SSL encryption instead of native encryption.
-
Specify endpoint name.
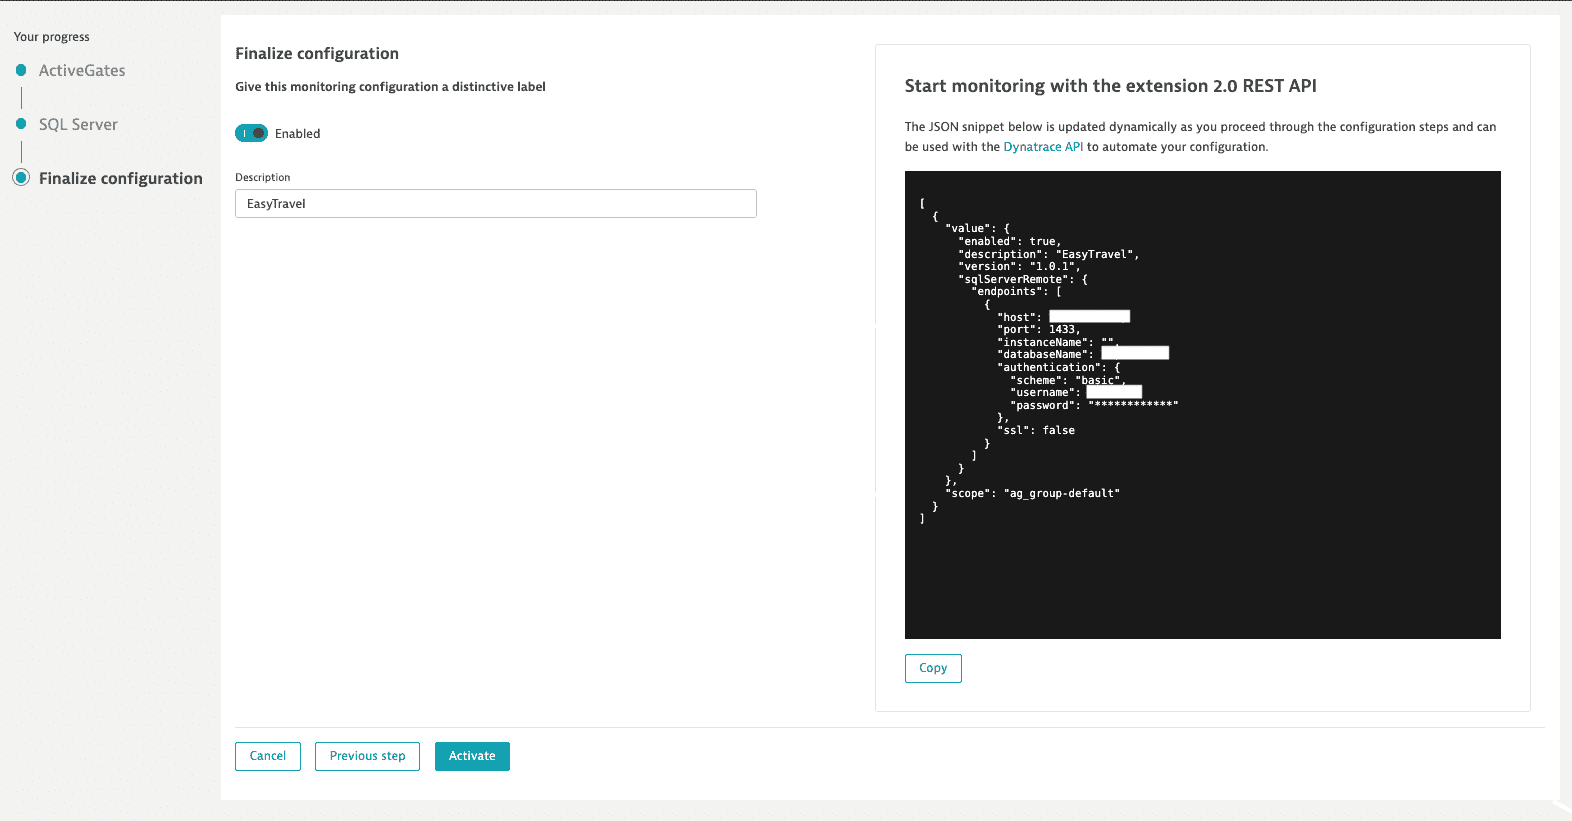
-
Select Activate.
After being activated, the newly created endpoint acquires Pending status, followed by Error status, which indicates that the tenant has not yet found an ActiveGate to run the endpoint on.
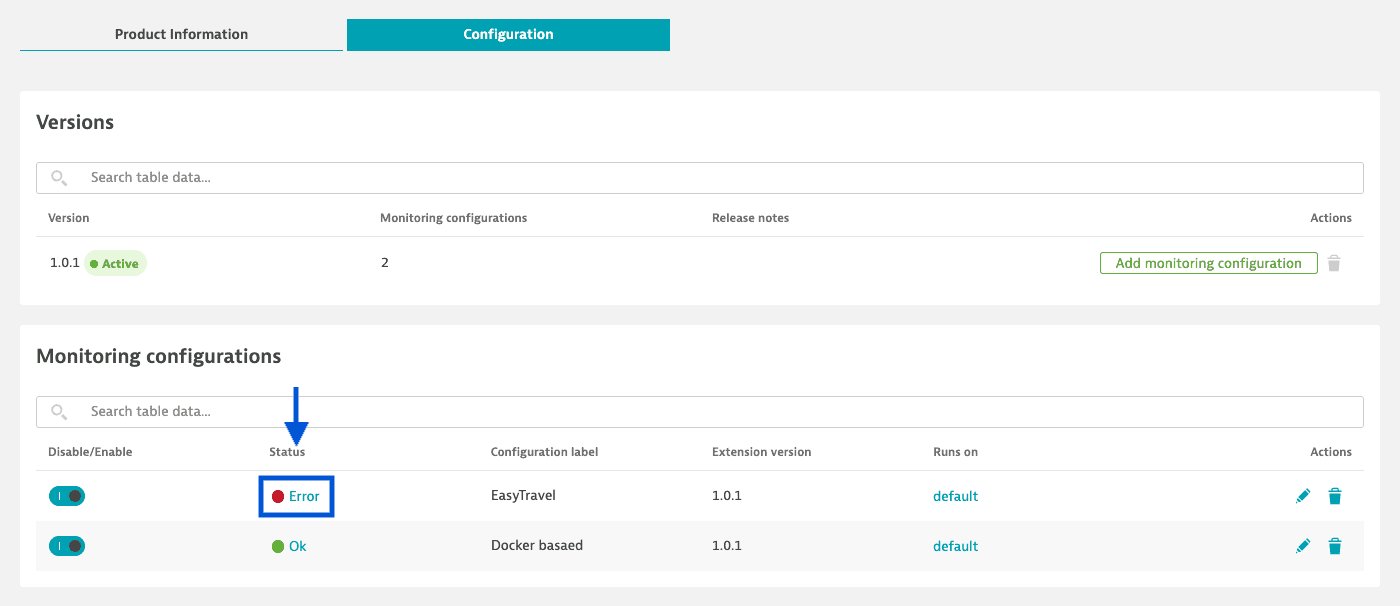
-
Open Log Viewer for the configuration endpoint.
To check what is happening with the configuration, select the status itself.
-
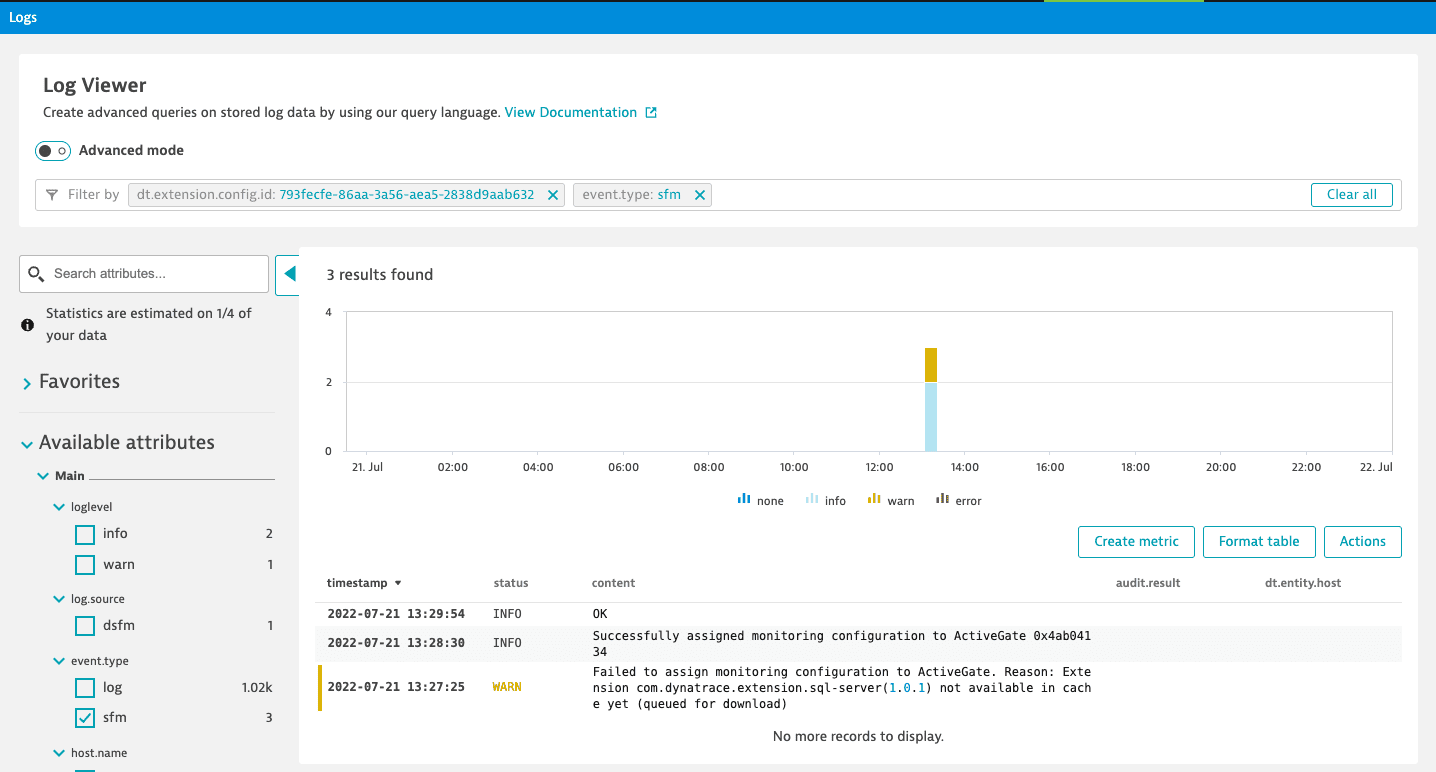
Check log records in the Log Viewer.
Within a few minutes, the tenant will find a suitable ActiveGate to run the configuration on.
- An
OKmessage is displayed in the logs to indicate a successful deployment. It might also have to download the extension sources and verify them. On a freshly created configuration, this could take ten minutes or more.
- An
-
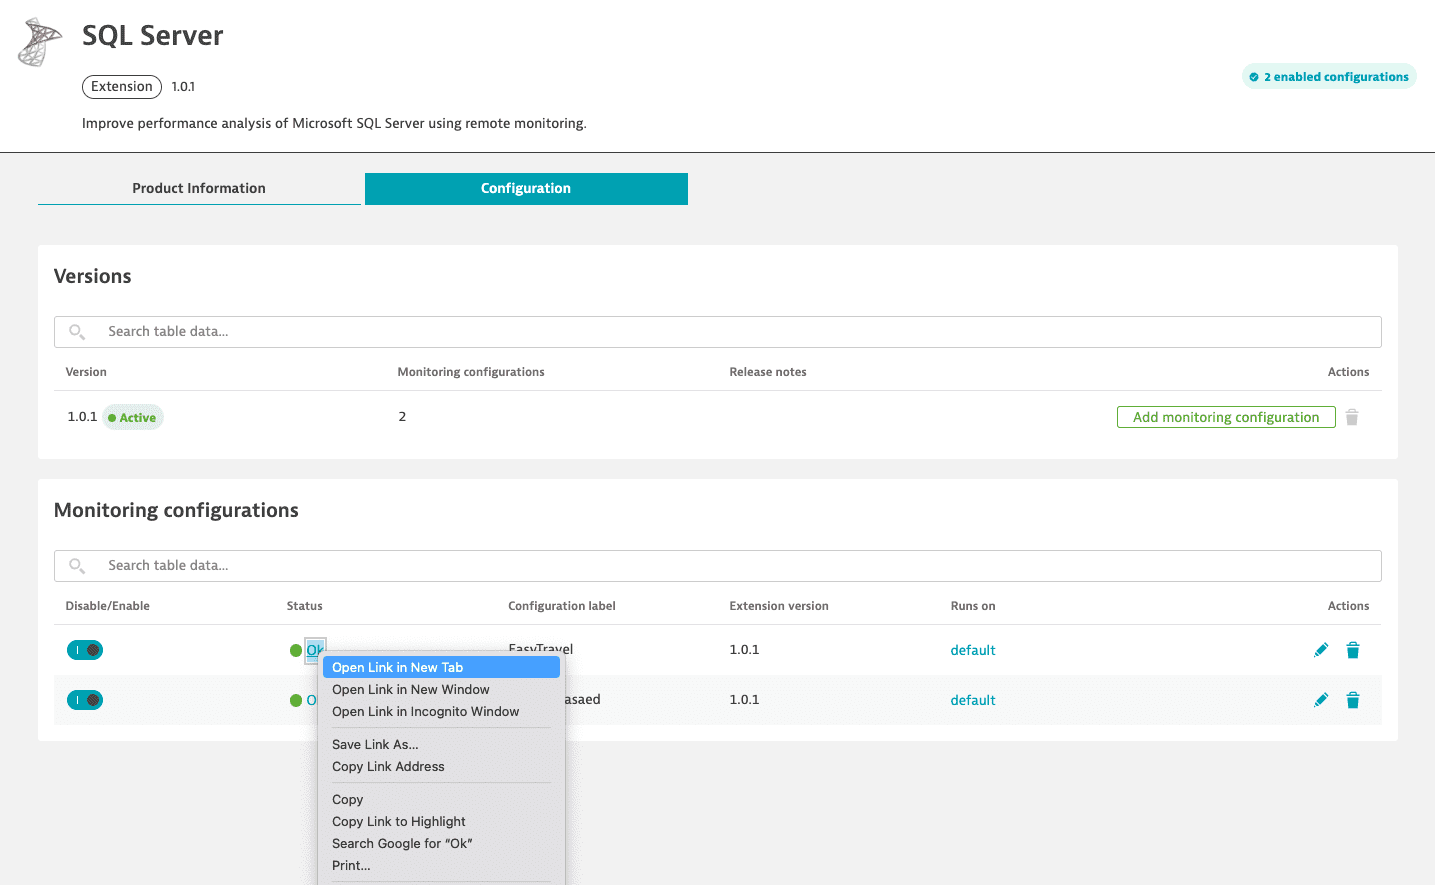
Check that the status of the configuration is Ok.
Status Ok indicates that the configuration has passed a Fastcheck stage, verifying that it has a connection to the database and collects metrics.
Connection parameter details
| Field | Details |
|---|---|
Endpoint name | A meaningful endpoint name. Example value: |
Connection host | The address of the Microsoft SQL Server host. Can be an IP address or a domain. Example values:
|
Connection port | Port on the host on which SQL Server is ready to accept connections from ActiveGate.
Example value: |
Database name | Name of the logical database to connect to. This can be any database to which the supplied database user can connect.
Only one logical database name can be specified here. Example value: |
Connection user | Database user whose credentials are going to be used to establish a connection to the database and query performance counters.
A good practice is to create a separate user for Dynatrace to query required views. |
User password | Password for the database user. |
Metrics
The following metrics are available.
Instance metrics
General
The SQLServer:General Statistics object provides counters to monitor general server-wide activity (log-ins, connections, blocked processes), which can be useful when there are many clients connecting and disconnecting from an instance of SQL Server.
Logins
User connections
Blocked processes
Memory Manager
The Memory Manager object provides counters to monitor overall server memory usage, which can help you to identify performance bottlenecks. Monitoring overall memory used by an instance of SQL Server can help determine if bottlenecks exist (from inadequate physical memory for storing frequently accessed data in cache) and if query performance can be improved (by adding more memory or by making more memory available to the data cache or SQL Server internal structures).
Metrics:
Target memory
Total memory
Connection memory
Memory grants outstanding
Memory grants pending
SQL
The SQLServer:SQL Statistics object provides counters to monitor compilation and the type of requests sent to an instance of SQL Server, which can give you an indication of query processing speed and query optimizer effectiveness.
Compilations
Re-compilations
Batch requests
Locks
The SQLServer:Locks object provides information about SQL Server locks on individual resource types. Minimizing locks can improve performance.
Deadlocks
Timeouts
Waits for lock
Wait time
Buffer manager
The Buffer Manager object provides counters to monitor how SQL Server uses memory to store data pages, physical I/O (as SQL Server reads and writes database pages), and buffer pool extension (to extend the buffer cache by using fast non-volatile storage). This can help you to determine if bottlenecks exist from inadequate physical memory, if query performance can be improved by adding more memory (or by making more memory available to the data cache or SQL Server internal structures), and how often SQL Server needs to read data from disk (which consumes a relatively large amount of time).
Metrics:
Cache hit ratio
Page reads
Page writes
Page life expectancy
Checkpoint pages
Free list stalls
Latches
The SQLServer:Latches object provides counters to monitor latches (internal SQL Server resource locks), which can help you to identify performance bottlenecks.
Average wait time
Waits
Database metrics
The SQLServer:Databases object provides counters to monitor bulk copy operations, backup and restore throughput, and transaction log activities, which you can use to determine how much user activity is occurring in the database and how full the transaction log is becoming.
General
Transactions
Hours since backup
Log
Log files size
Log files used size
Log files used percentage
Log growths
Log shrinks
Log truncations
Flush waits
Always On metrics
Availability groups
Automated backup preference
Primary recovery health
Secondary recovery health
Synchronization health
Availability replicas
Availability mode
Failover mode
Is replica local
Replica role
Operational state
Recovery health
Synchronization health
Connected state
Availability databases
Synchronization state
Synchronization health
Database state
Log send queue size
Log send rate
Redo queue size
Redo rate
Filestream send rate
Resource footprint
The Microsoft SQL Server remote extension has a low memory footprint, requiring a negligible number of MiB per endpoint on ActiveGate after the extension is initialized.
Each endpoint runs once per minute and performs 5-6 lightweight SQL queries to the monitored database to collect the metrics.
Troubleshoot
- Check logs using the Log Viewer by selecting the status of the monitoring configuration.
Create a Support Archive for involved ActiveGate instances and share it with Tech Support.
Limitations
| Topic | Limitation |
|---|---|
Query plans, top queries | The extension only collects metrics available in the performance counters views in the database. It does not analyze query plans or most frequent and slowest queries. However, applications monitored by full-stack OneAgents can capture queries and provide insights into query performance. |