
Anyone who’s concerned with developing, delivering, and operating software knows the importance of making software and the systems it runs on observable. That is, relying on metrics, logs, and traces to understand what software is doing and where it’s running into snags. When software runs in a monolithic stack on on-site servers, observability is manageable enough. But as more workloads are shifting to hundreds of separate cloud-based services running in containers across multiple platforms, observability has become exponentially more difficult. Especially if you have custom applications that rely on APIs to integrate with other services. OpenTelemetry, the open source observability tool, has emerged as an industry-standard solution for instrumenting application telemetry data to make it observable.
In this OpenTelemetry demo series, we’ll take an in-depth look at how to use OpenTelemetry to add observability to a distributed web application that originally didn’t know anything about tracing, telemetry, or observability.
But before we do that, let’s quickly go over a primer on what observability and OpenTelemetry are in the first place.
What is observability?
Observability may seem a fancy term, and it certainly does come with a fair share of complexity. But its underlying goal is quite humble and straightforward: It wants to enable you to observe an IT system (for example, a web application, infrastructure, or services) and gain insight into its behavior, such as performance, error rates, hot spots of executed instructions in code, and more. These observations and insights are all far beyond what classic logging typically provides.
While classic logging is an essential tool in debugging issues, it often lacks context and only provides snapshot information of one specific location in your code or application. Here, the observability concept of tracing offers a significantly wider scope and provides an end-to-end solution for tracing calls and service requests throughout your entire application and, most importantly, across application boundaries (for example, requests to other services).
In addition to tracing, observability also defines two other key concepts: Metrics and logs.
Metrics provide a unified and standardized definition to numerical data points over a period of time (for example, network throughput, CPU usage, number of active users, and error rates). Logs address traditional logging and allow you to handle logging information in an aggregated fashion.
What is OpenTelemetry?
OpenTelemetry is a free and open source take on observability. Based on the W3C open standard Trace Context, OpenTelemetry uses the concepts of traces, metrics, and logs to define a set of interfaces and protocols that enable IT systems to exchange observability data with each other. Additionally, OpenTelemetry provides SDKs, instrumentation libraries, and reference implementations for major programming languages, such as Java, .NET, JavaScript, and more so developers can build standardized observability telemetry into their systems.
Because OpenTelemetry is open source and has been adopted by major players in the field of observability, it also ensures a vendor-agnostic approach and allows you to integrate different and heterogeneous environments, with little to no adjustments necessary.
Why should I adopt observability?
With observability, you can get a better understanding of how your systems behave and what they do, especially in case of errors. Traditionally, organizations have relied solely on logging to monitor how applications perform, and that – generally – works fine in many cases. However, as software workloads have become more distributed, relying on logs alone is proving inadequate. By making your system observable and making use of the available tools and technologies (and logging is still one of them), you’ll be able to super-charge the information you can get from your runtime and spot issues and performance bottlenecks a lot easier.
With that in mind, it’s time to start our journey of adding observability using OpenTelemetry. To demonstrate how that can work, we’ve chosen a pristine web application without any observability and are going to make it observable step-by-step during the next few chapters of this article.
OpenTelemetry demo application: Distributed host/URL availability checker
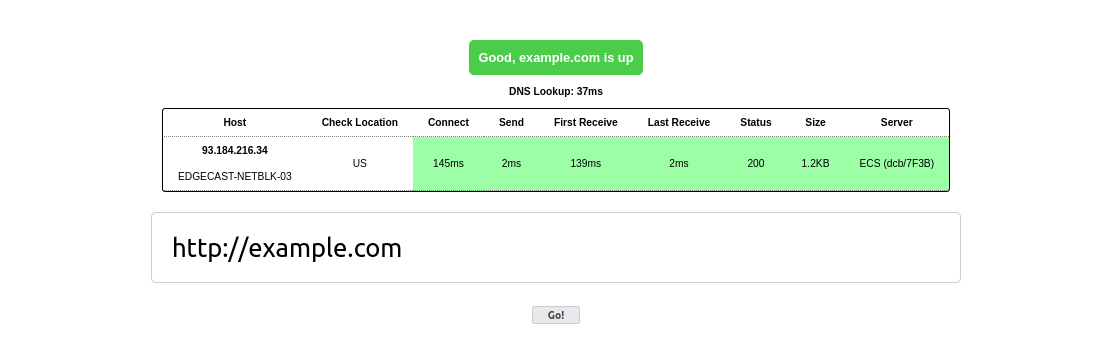
For our demo, we picked a web-based application whose core service is a distributed host/URL availability check. Basically, you enter a URL and the site tells you if that URL is—or is not—reachable from a number of different locations. For that purpose, the application consists of two main parts:
- a PHP front end
- a JavaScript agent running on Node.js
The web part is handled entirely by PHP and serves the main content and manages the connections to the agents. Once the user submits the form, this part establishes REST connections to the agents, which execute the network call appropriate for the provided URL and return all information they managed to gather to the central PHP service. OpenTelemetry then renders those connection details—such as connect, send, and receive times, connection status, and transmitted data size—back to the client.
On the technical side, our application uses PHP’s cURL library to execute the REST call and Node.js’ HTTPS library to receive and handle that call. These two bits are particularly important for context propagation, but more on that in just a second.
Here’s a high-level road map of the process:
- Identify traces and metrics using OpenTelemetry (part 1)
- Connect to a backend for analysis (part 1)
- Set up OpenTelemetry in each application (covered in part 2)
- Instrument the applications using OpenTelemetry (covered in part 2)
- Collect, instrument, and analyze telemetry data automatically with Dynatrace (covered in part 3)
Identify traces and metrics using OpenTelemetry
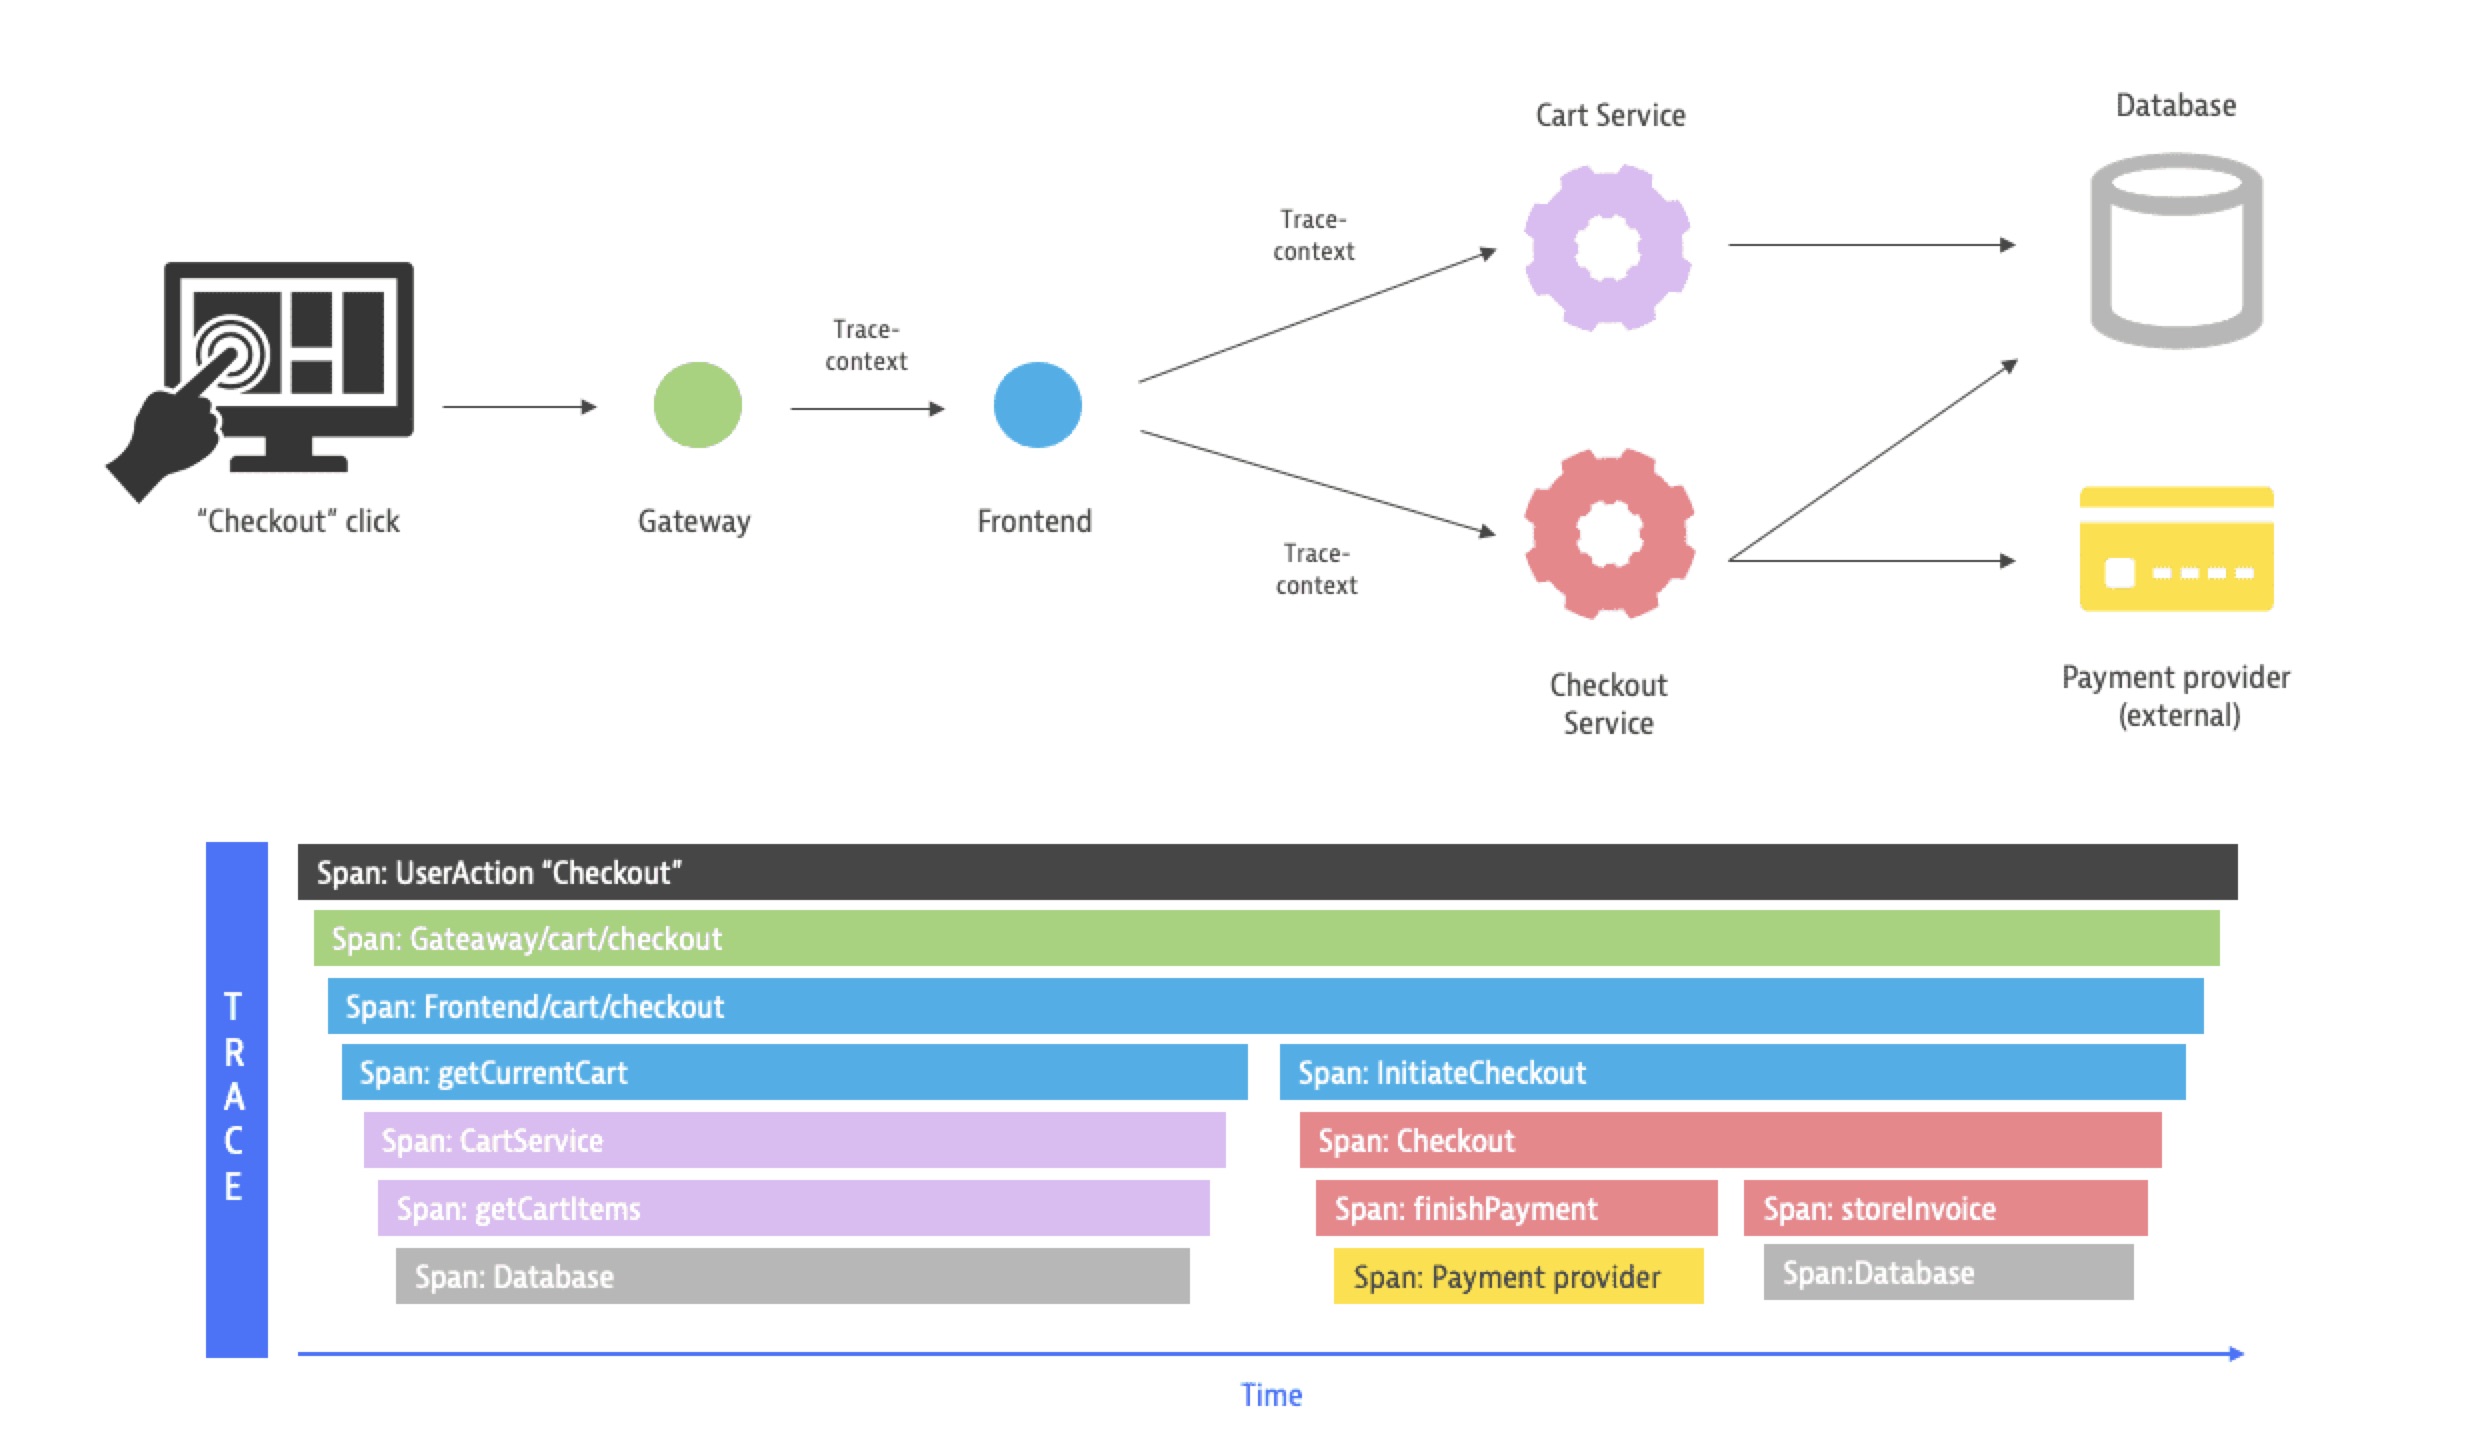
What is important to us is to get better insight into how the individual components of our application function at a given point and how they interact with each other. This is exactly where traces come in, as their distributed nature will enable us to follow a request execution flow from start to finish and across service boundaries.
OpenTelemetry also enables us to define and provide metrics, which allow us to record numeric data and parameters over a period of time and use that information to get an understanding of how our service is being used and spot potential performance bottlenecks well in advance.
As for logs, the OpenTelemetry group is currently still working on stable implementations. For that reason, our demo won’t have a strong focus on logs. However, once available, logs can serve as a great addition and will enrich the information we collect with traces and metrics, especially in the context of log aggregation and time correlation.
Traces
One of the key issues with traditional logging is following the execution flow of individual requests and their state from one end of a transaction to the other. Before adopting OpenTelemetry, we addressed this by issuing a unique identifier to each request and adding that to our logging information. This somewhat solved the issue of collating log lines. However, it was still scoped per application, and the agents each had separate identifiers from the front end. On top of that, all information was stored as text and in a distributed manner.
By implementing tracing with OpenTelemetry, we already start off in the frontend, where we initialize a trace for each incoming request, as well as a global parent span as a container for the subsequent child spans. These two components serve as global containers for all following spans, both within our demo service and across services (for example, context propagation).
At this point, we needed to logically compartmentalize our code and decide which parts of our code can be considered units on their own. Those are prime candidates for their own spans.
Wrapping these units into spans will tell us, first and foremost, how much time the execution of each span block took. Furthermore, it enables us to enrich the span with additional task-related details, such as error or status codes. This level of granularity, down to individual parts of our code, assists us when we troubleshoot code or performance issues and provides detailed insight.
Let’s take a sample request for `https://www.example.com`. When the client submits that to our service, we will perform the following actions:
- Purge expired entries from a
whoiscache - Perform some flood protection
- Parse the provided URL into its components
- Resolve the URL’s hostname into its IP addresses
- Run
whoisfor each address - Send a REST request to all our agents
Each of these steps is a great candidate for its own span. Additionally, we can store task-relevant (debug) information in the attributes of each span. For example:
- for the
whoiscache, we added an attribute indicating how many entries we have and how many have expired - when parsing the URL, we added the parsed object
- for DNS resolution, we indicated if we had to resolve at all (for example, an IP address was provided to begin with) and which IP addresses we resolved
Once we send the REST request to our agents, our global span is still active, and we pass the information about the trace and the current span on using context propagation. When we receive the request on the agent side, we will automatically have a context for our original trace, and we continue onwards with the following tasks:
- Establish a connection to `www.example.com`
- Start a TLS handshake
- Send the HTTP request for `www.example.com`
- Receive and parse the response
- Respond back to the PHP service
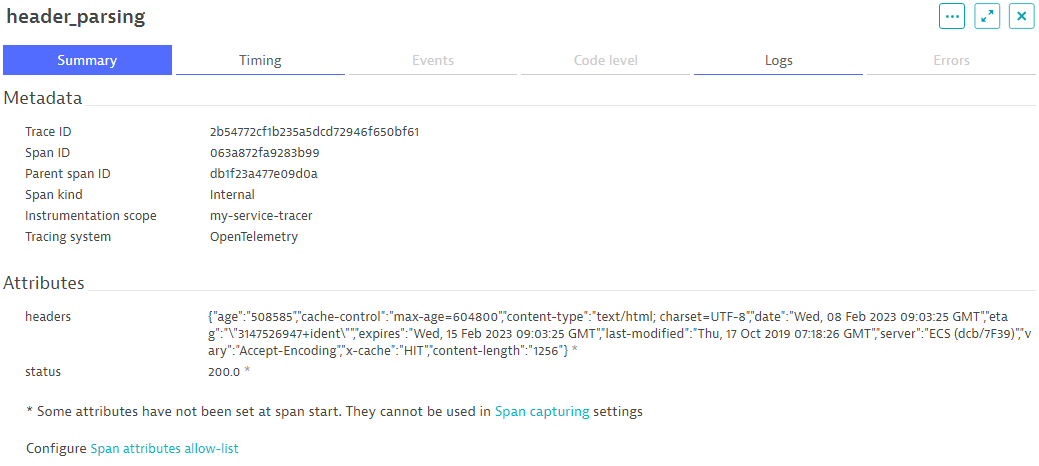
These steps are equally well suited to be represented by a span each, along with applicable attributes. For example, when establishing the connection, we store details of the connection in the attributes. For the HTTP request, we add the request headers we sent, as well as certain details from the response, such as the status code, the length of the response, and server information.
Metrics
Contrary to traces, metrics don’t focus on the execution flow but on providing snapshot information about specific numeric figures of our system.
In our case, we want to use them to track the following sets of information:
- Number of total requests, grouped by user agents
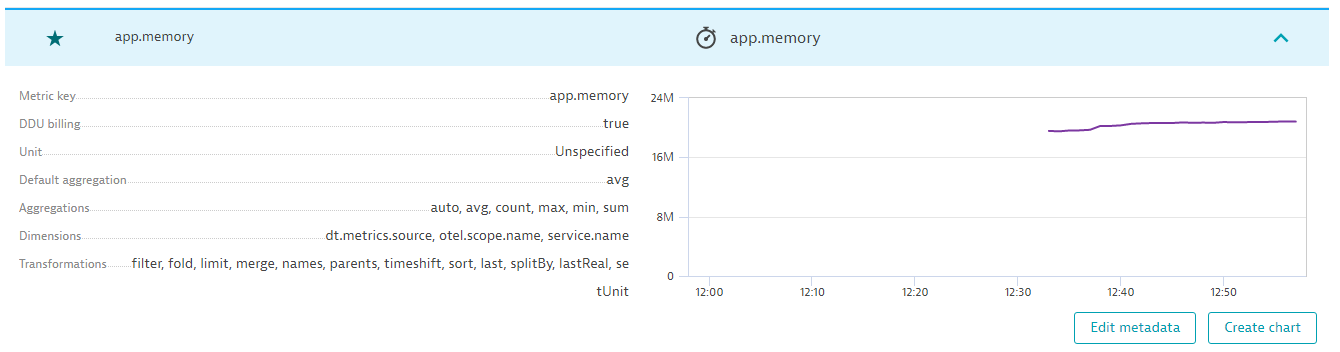
- Memory usage of the agents
- Cumulative incoming traffic by agent and domain
The number of total requests will be very similar to what we could also gather from a typical web server log, especially with the ability to group by user agents.
Memory usage will be a continuously monitored gauge instrument, which will provide us with live insight into how each agent is performing memory-wise.
Last but not least, the cumulative traffic will give us an overview of how much traffic we have in total, but also with the ability to drill down by agent and domain.
Connecting to a backend for analysis
Collecting data is all well and good, but if you don’t analyze and visualize it, its use may be rather limited.
Because OpenTelemetry is a set of protocols, definitions, and SDKs, it does not provide that ability, so it needs an analytics backend. A backend is where the OpenTelemetry libraries will upload all collected data and where you can then analyze and visualize it in detail.
There are a couple of open source backends, though many of them are limited to traces and, for example, don’t support metrics. Because Dynatrace offers a completely free 15-day trial and comes with native support for both traces and metrics, we’re going to use its platform and dashboard for our demo here.
Set up Dynatrace free trial
To set up Dynatrace, head over to /trial/ and sign up for your trial account. Once you have activated your account, you’ll need an API access token. Please remember your environment ID, as you’ll need it for the dashboard and API URLs we’re going to use.
Tip: The environment ID
Issue the access token
Once you have set up your Dynatrace account, you’ll also need an access token to grant your application access to your Dynatrace account. Imagine it like a unique and dedicated password with a restricted access scope.
- In the Dynatrace web UI, go to Manage > Access tokens
(https://[ENVIRONMENT_ID].live.dynatrace.com/ui/access-tokens) and select Generate new token. - In the Generate new token screen, enter a descriptive name and select the two required scopes:
- metrics.ingest
- openTelemetryTrace.ingest
- Select Generate token at the bottom of the page, and voilà, your token has been generated.
Tip: Copying the API key
Make sure to copy the API key, as it will be displayed only this one time.
The API endpoints
Dynatrace accepts OpenTelemetry requests on the following endpoints:
- Traces:
https://[ENVIRONMENT_ID].live.dynatrace.com/api/v2/otlp/v1/traces - Metrics:
https://[ENVIRONMENT_ID].live.dynatrace.com/api/v2/otlp/v1/metrics
One thing to keep in mind, we always need to send an Authorization header that contains the access token:
Authorization: Api-Token dt..........
Viewing the data
Once we have uploaded our first traces and metrics, you’ll be able to view the data on the following pages in the dashboard.
- Traces: Applications & Microservices > Distributed traces
- Metrics: Observe and explore > Metrics
In the second part of our three-part series, The road to observability with OpenTelemetry demo: Setting up OpenTelemetry and instrumenting applications, we’ll walk through how to configure our application for observability using OpenTelemetry.
Observability Clinic, OpenObservabilty without boundaries with Dynatrace
To learn more about how Dynatrace connects all of your observability data from any source, join us for the on-demand Observability Clinic with Dynatrace observability expert, Henrik Rexed.

Looking for answers?
Start a new discussion or ask for help in our Q&A forum.
Go to forum