
Modern observability brings data silos together, enabling teams to operate clouds more efficiently and innovate faster and more securely. Now, an analytics platform with exploratory analytics capabilities enables teams to make data-backed decisions that drive better business results.
As organizations adopt more cloud-based technologies, the increased volume and variety of data from these ecosystems drive complexity. This complexity creates silos that affect the ability of IT, development, security, and business teams to achieve the awareness they need to make data-driven decisions. To tame this complexity and optimize cloud operations, teams across the organization need to manage and explore their data effectively.
Therefore, teams need a unified, intuitive approach to data aggregation and analysis. A modern observability and analytics platform brings data silos together and facilitates collaboration and better decision-making among teams. Further, it presents data in intuitive, user-friendly ways to enable data gathering, analysis, and collaboration among far-flung teams.
Why teams struggle with the volume and variety of cloud data
Modern cloud-native environments can present compound problems that often hamper teams across the organization in meeting business objectives. Here are some examples:
- IT infrastructure and operations. Because events in cloud-native environments take place instantaneously, and there is so much data to digest, IT and operations teams often can’t identify problems before customers experience them.
- Development and DevOps. Likewise, developers can be blocked from developing software quickly and securely because they lack sufficient observability into disparate software development tools and environments, which is required to automate manual processes.
- Application security. Further, security teams struggle to identify, investigate, and prevent data breaches because it takes too long to collect, rehydrate, and correlate logs from many different data sources.
Indeed, IT operations, security, and DevOps teams feel the strain of ever-growing cloud environments and the increasing amounts and types of data they generate.
According to research, 71% of CIOs from the world’s largest organizations say all this data is beyond humans’ ability to manage. Furthermore, according to another recent survey, nearly 80% of respondents say they struggle to unify real-time and historical data.
Using traditional monitoring methods to make sense of events and incidents within vast hybrid and multicloud environments is time-consuming, manual, and error-prone. Teams need a modern, automated approach to cloud observability that enables answer-driven automation and exploratory analytics to address the needs of IT, development, security, and business users alike.
Enhancements to the Dynatrace platform now enable teams to centralize observability and security data in a data lakehouse, as well as discover and share data insights through new analytics capabilities.
Why traditional monitoring approaches fail to deliver an exploratory analytics platform
Traditional approaches to cloud monitoring cannot keep pace as organizations’ use of multicloud and cloud-native architectures expand. These approaches also lack the context teams need to pinpoint the underlying root cause of IT, development, security, and digital experience issues, let alone shed light on broader business trends. Teams need to move to automated, causal AI-based approaches to cloud observability.
Modern observability with causal AI can identify the precise cause of application or infrastructure issues based on an in-depth and real-time understanding of the relationships between cloud entities. This observability in context integrates application performance and security with business insights based on user data. With answer-driven software intelligence across a massive data set, teams can build, evaluate, and share insights to solve wider problems and explore new projects.
Four factors limit the quality and trustworthiness of traditional approaches to cloud monitoring.
1. Data storage limitations
Today’s traditional monitoring tools often involve a tradeoff between storing much of the available observability, security, and business data—which is costly—and determining which data to store upfront. But making decisions about which data to store in easily accessible hot storage upfront requires IT pros to know which questions they want to ask ahead of time and ensure that data is indexed.
Enter a data lakehouse technology. IT teams don’t need to predetermine the data structure or schema upfront to get the answers they need.
With a data lakehouse, DevSecOps teams can aggregate, store, and centralize structured and unstructured data in one cost-efficient repository without predetermining which data is necessary. Dynatrace Grail enables IT pros to ingest logs, metrics, traces, and other data so they can get a full picture of the events taking place in their hybrid cloud environments. With a schemaless, cost-effective data lakehouse, IT pros are no longer manually sifting through data and alerts to identify the team responsible for the problem. Further, Grail retains all the context of the data once it’s unified and maps it topologically.
2. Data silos
Most organizations have multiple cloud monitoring and application security tools in their environments, given that many are point solutions and don’t solve all problems.
As a result, in multicloud environments, teams manage a tool patchwork that generates multiple data streams that are tricky to integrate without centralization. Development, operations, and security teams have only a limited understanding of an application failure or a security breach until data is centralized and enabled with its full context. When all data is stored in context, teams don’t need to manage storage tiers and wait days to rehydrate, reindex, and query a federated data set.
3. Cloud dependencies
Modern, container-based applications running on multiple clouds have a complex array of dependencies. With Smartscape, the Dynatrace platform provides real-time, auto-discovered, continuously updated topology mapping of all dependencies between data, services, and multicloud entities. As a result, teams across the organization can understand how their digital services are truly behaving and identify the root cause of issues.
4. Lack of platform intelligence
Traditional monitoring solutions use correlation-based machine learning to get probabilistic answers based on statistics. This approach lacks the context, dependency detection, and corresponding data structure to connect the dots on application and infrastructure incidents that enable speedy resolution and auto-remediation. Conversely, causal AI, which Dynatrace calls Davis, uses automated fault-tree analysis to identify root cause in real time. This approach provides precise answers that help teams across the organization to take decisive action, automate processes, and make data-based decisions.
For example, cloud operations professionals can identify problems before they affect users. DevSecOps teams can also build an effective automation practice and conduct security forensics based solely on trustworthy data and AI. Finally, teams can coordinate more effectively using a single source of data intelligence with collaborative analytics capabilities.
From modern observability to an analytics platform
Ultimately, IT, development, security, and business leaders benefit from consolidating data silos on a modern observability platform so they can act on its precise insights. What’s more, teams across the organization have the data intelligence they need to collaborate on any data-driven question that affects the business.
This week at Perform 2023 in Las Vegas, Dynatrace announced a host of enhancements to enable IT teams to move from data in context to insights they can execute confidently. Dynatrace has updated the platform with a variety of capabilities to allow teams to easily discover, share, and collaborate on data insights:
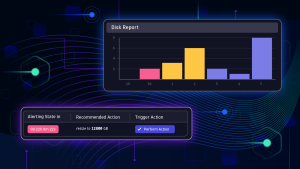
- a new user experience and interface and updated dashboards to more easily visualize trends;
- data Notebooks for petabyte-scale data exploration and analytics for real-time insights;
- a new no-code/low-code user interface and AutomationEngine to build powerful workflow automation; and
- AppEngine to create custom, compliant data-driven apps for answers and automation.
To learn more about the Grail data lakehouse and the new exploratory analytics capabilities, check out our on-demand Perform sessions.


Looking for answers?
Start a new discussion or ask for help in our Q&A forum.
Go to forum