We’ve introduced a major enhancement to Dynatrace database baselining, alerting, and visibility. Many of our customers are interested in understanding the performance of specific SQL statements. They want to know which browser click results in which specific SQL statement or what the impact of a slowdown or error with a specific SQL statement is. Dynatrace now offers exactly this functionality.
Performance and failure analysis of database statements
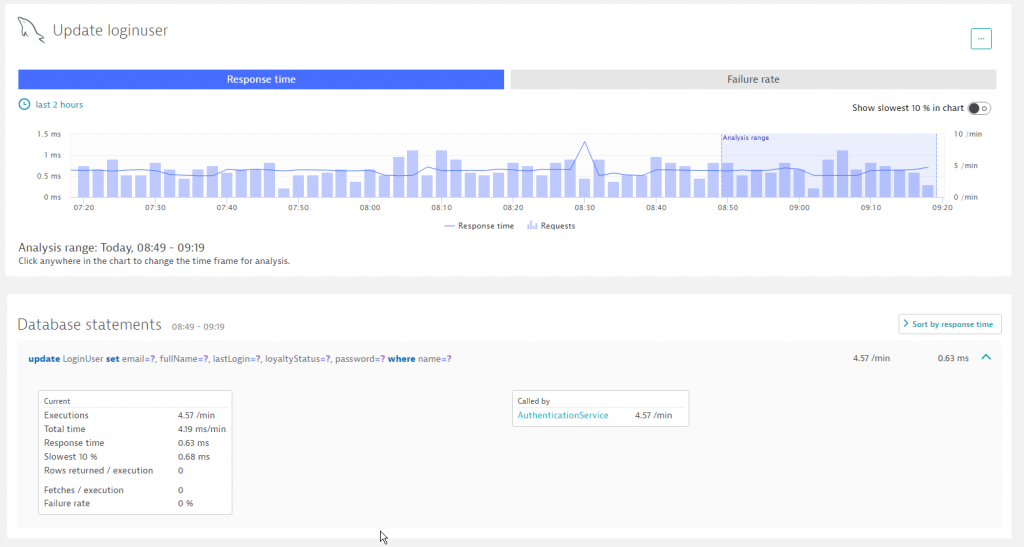
When you open any database Services page you’ll immediately notice a big change. The findings section features specific SQL statements. Dynatrace now automatically analyzes and tracks the performance and failure rate of all important database statements. When statements slow down or begin to experience errors, Dynatrace quickly tells you exactly which statements, tables, or MongoDB collections are impacted by the issue.
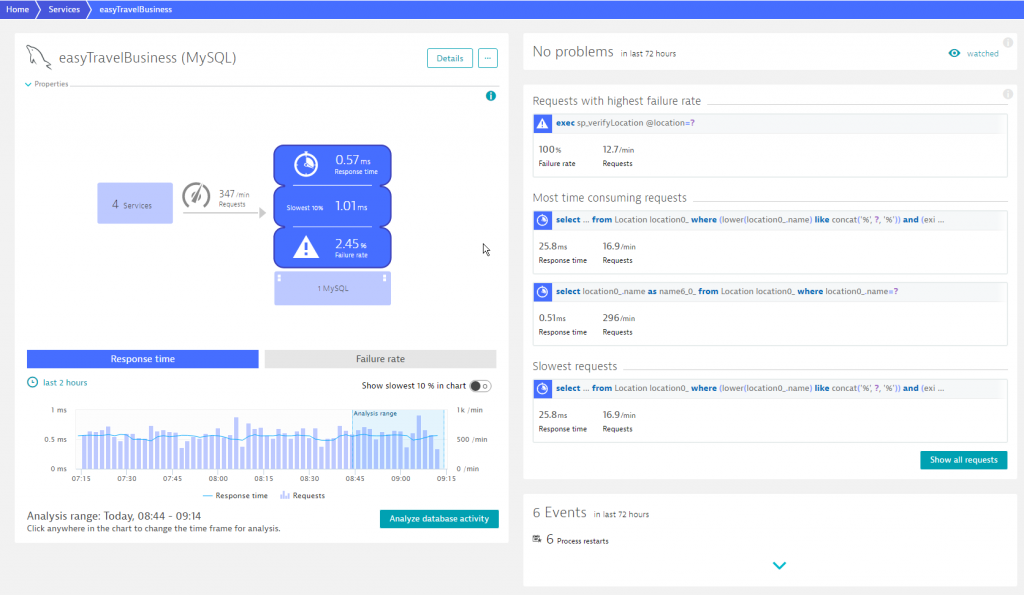
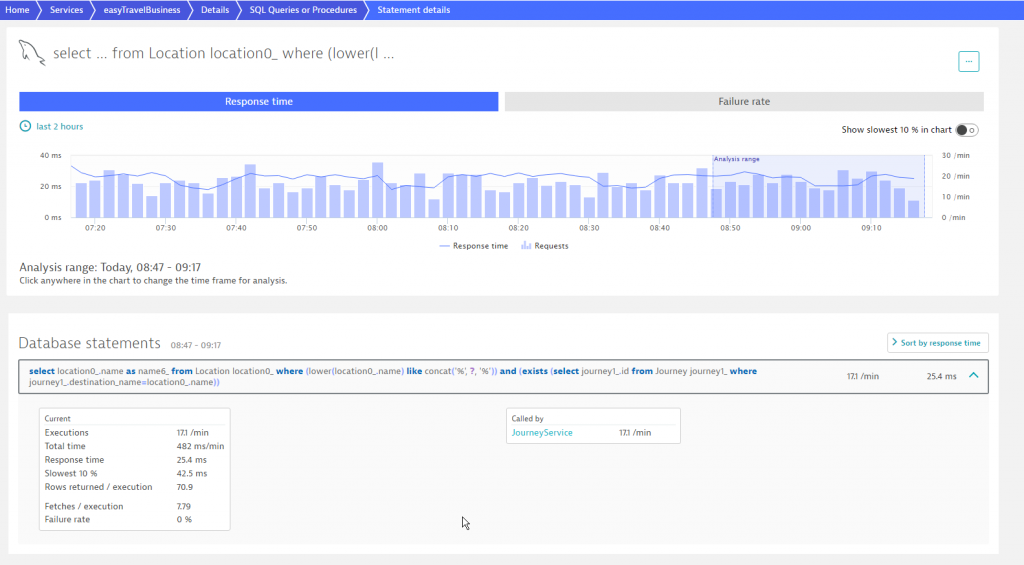
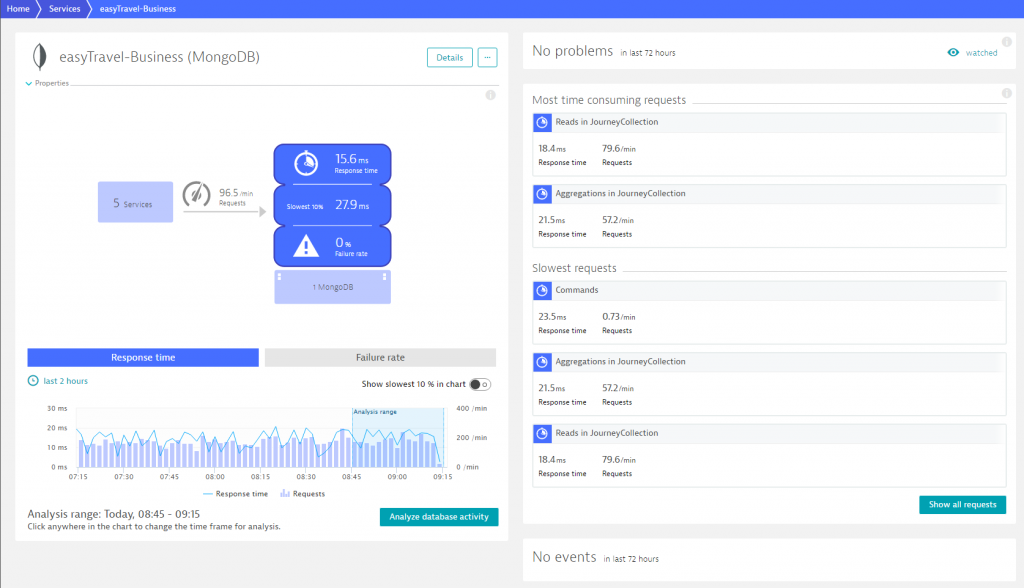 A great benefit of this is that Dynatrace now provides standalone Response time andFailure rate charts for individual SQL statements.
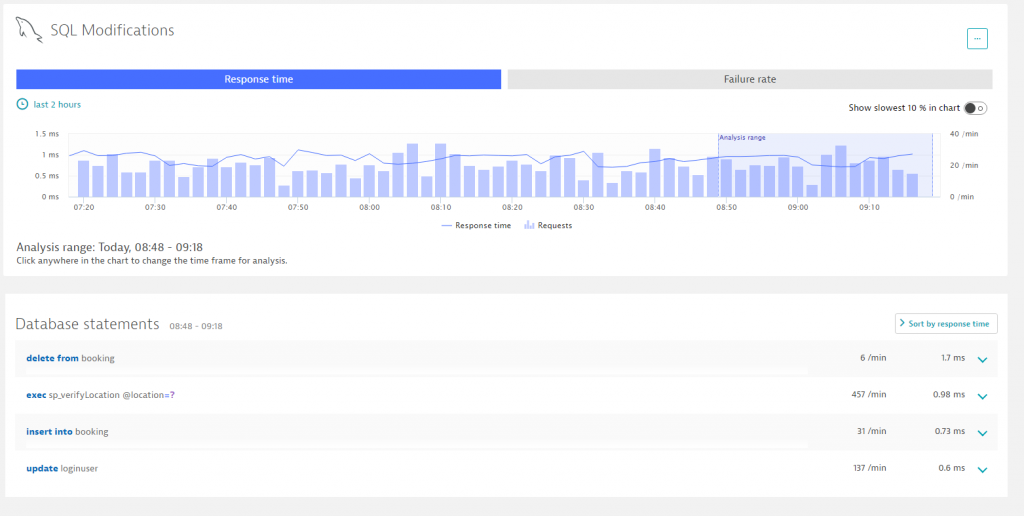
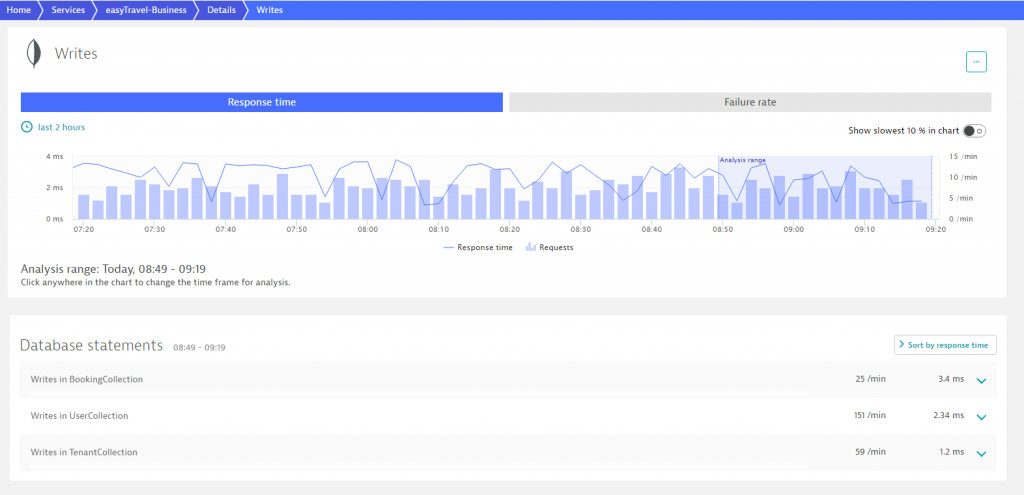
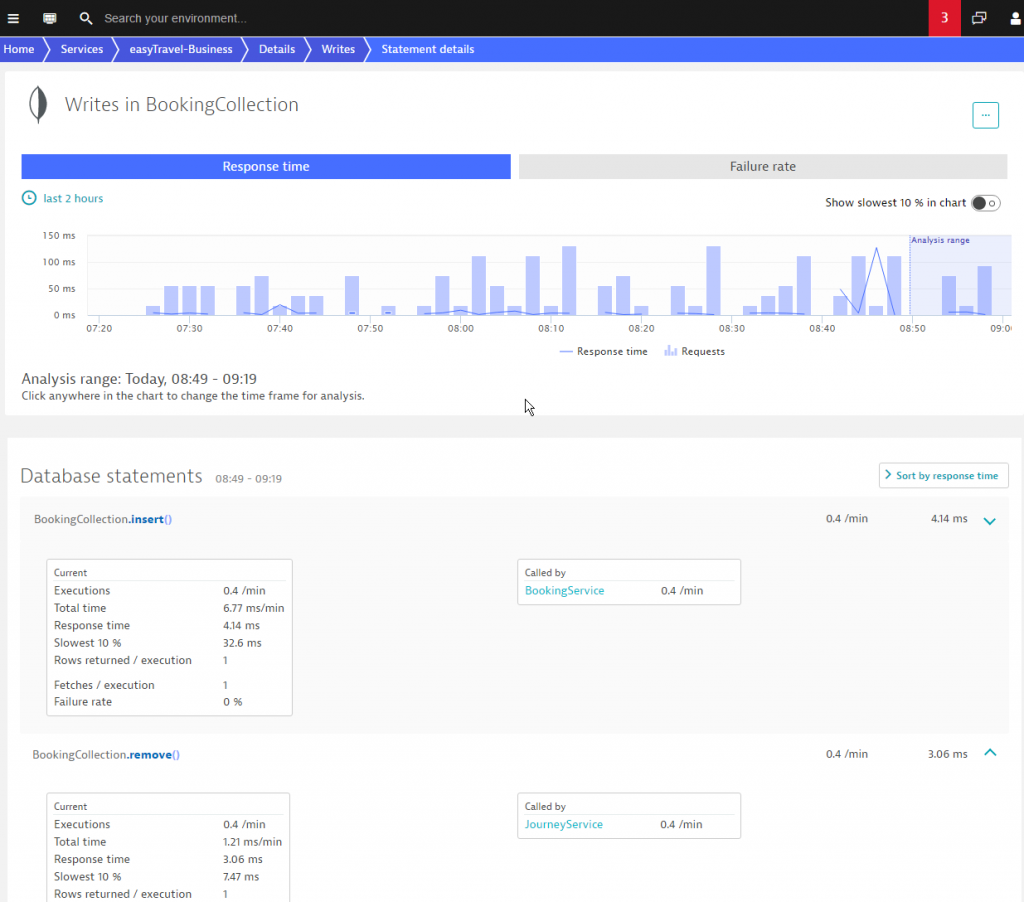
  For instances of write activity on databases it makes sense to look at the table or collection level rather than specific insert statements.
Understand the impact of individual statements
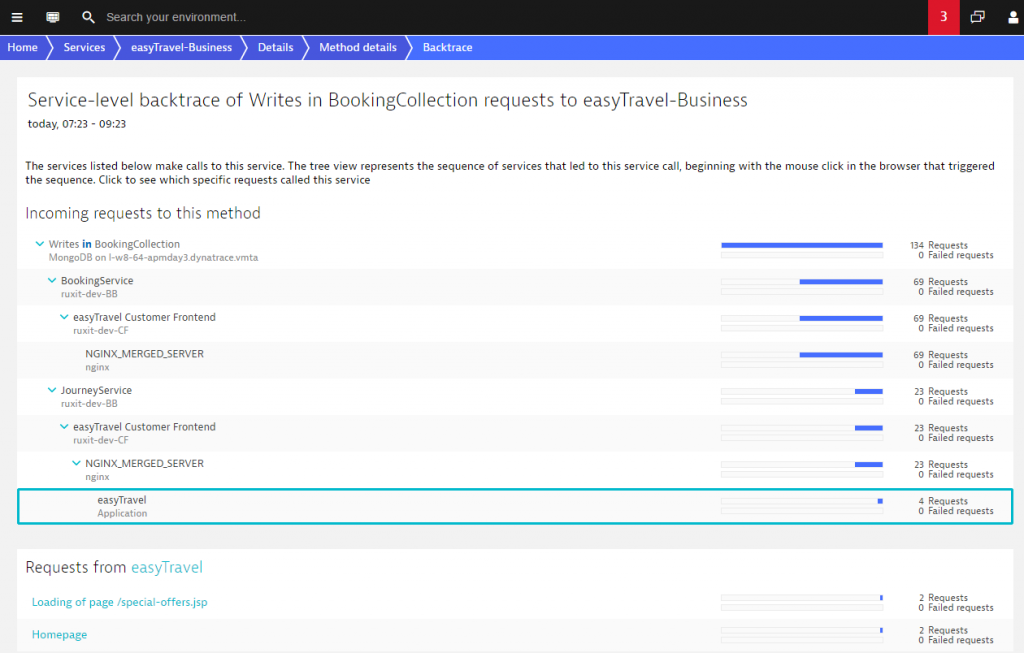
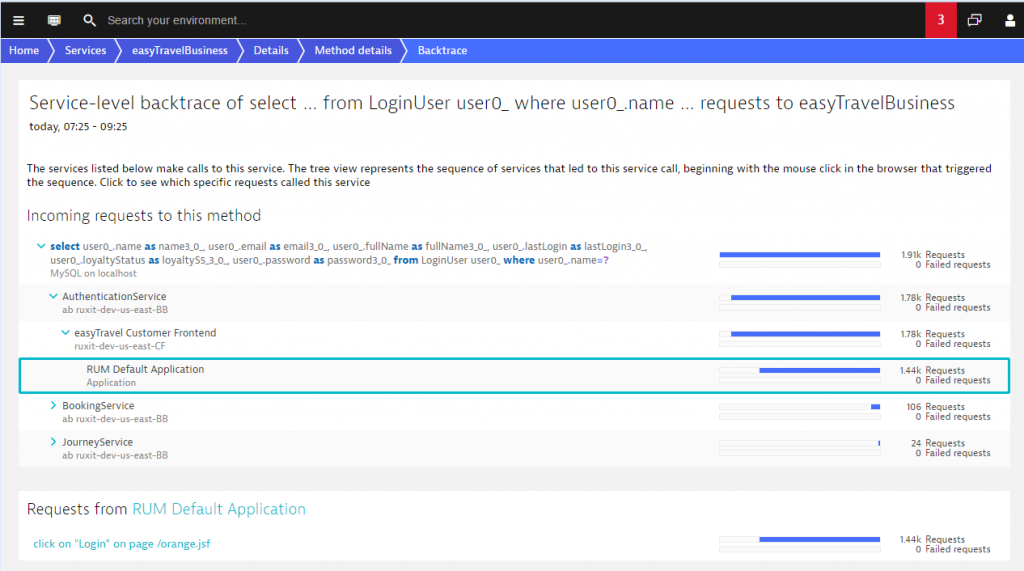
If you want to know which browser click results in a particular SQL statement, or which requests write to a specific table, take advantage of the recently introduced service Backtrace functionality. As you can see below, service backtrace enables you to understand that the vast majority of–but not all–selects to the user table originated from the login click.
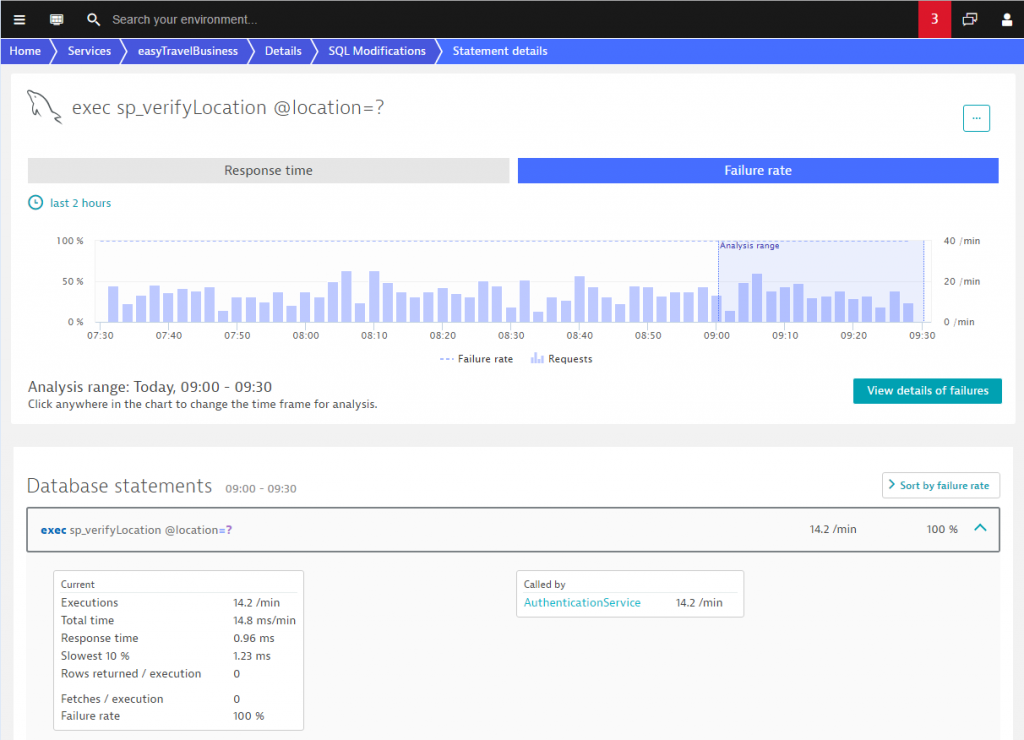
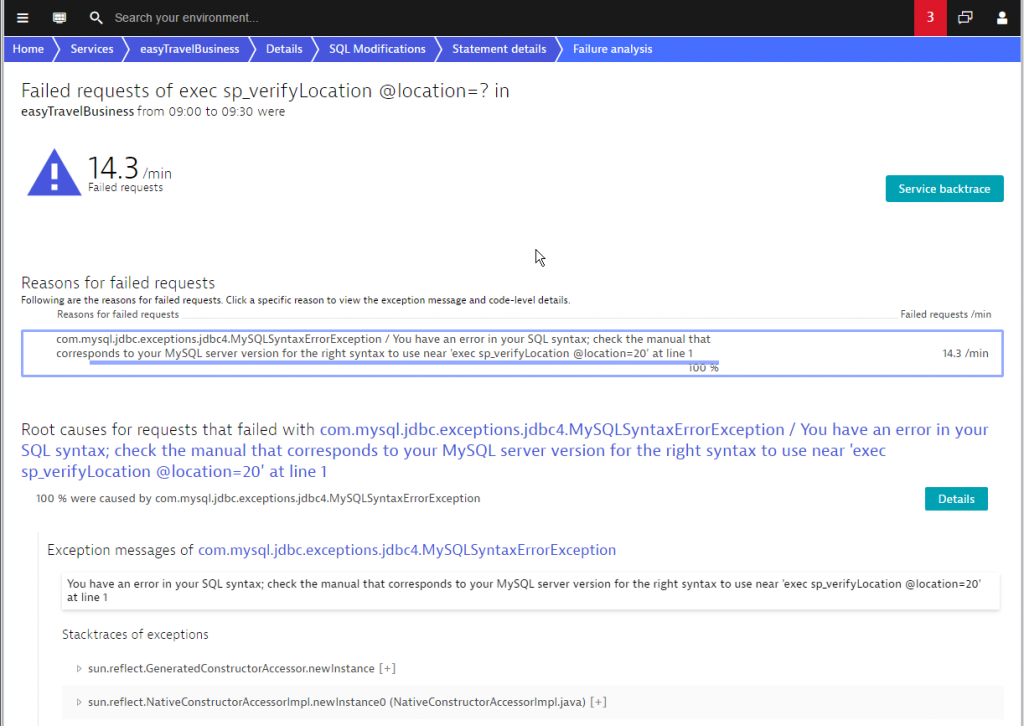
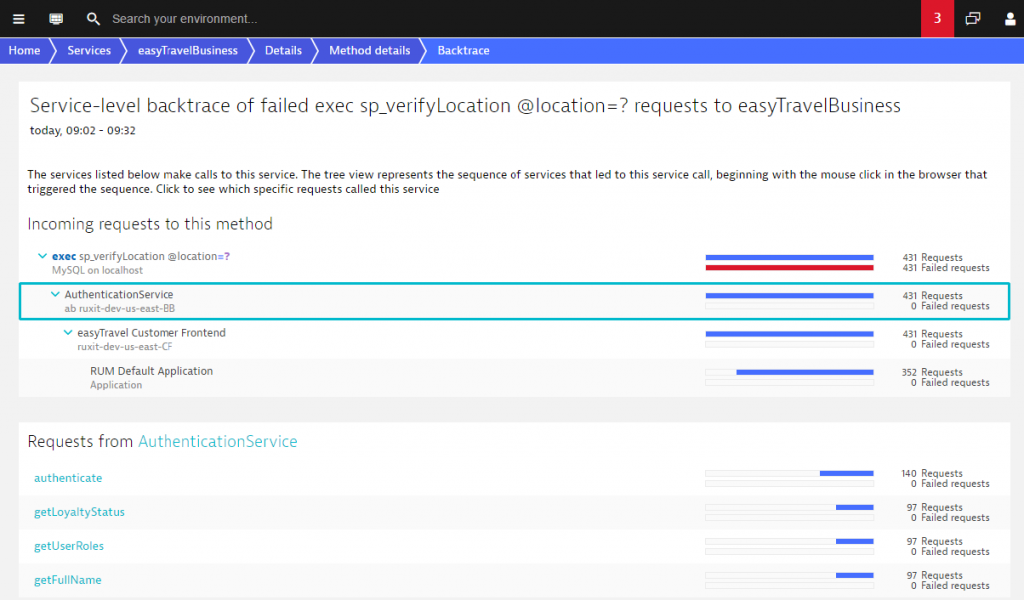
 For failing statements backtrace functionality is even more interesting. It enables you to determine which, if any, user requests failed due to a database error. To do this, go to the failure rate chart of a particular statement and view the details of the failure. As you can see this enables you to understand the errors of a particular statement. By clicking Service backtrace, you can see which requests led up to the failed SQL statement and the initial browser click. In the screenshot below note that although all executions of this particular SQL statement failed, users were not affected by this problem.
Impact and root cause analysis down to the statement and table level
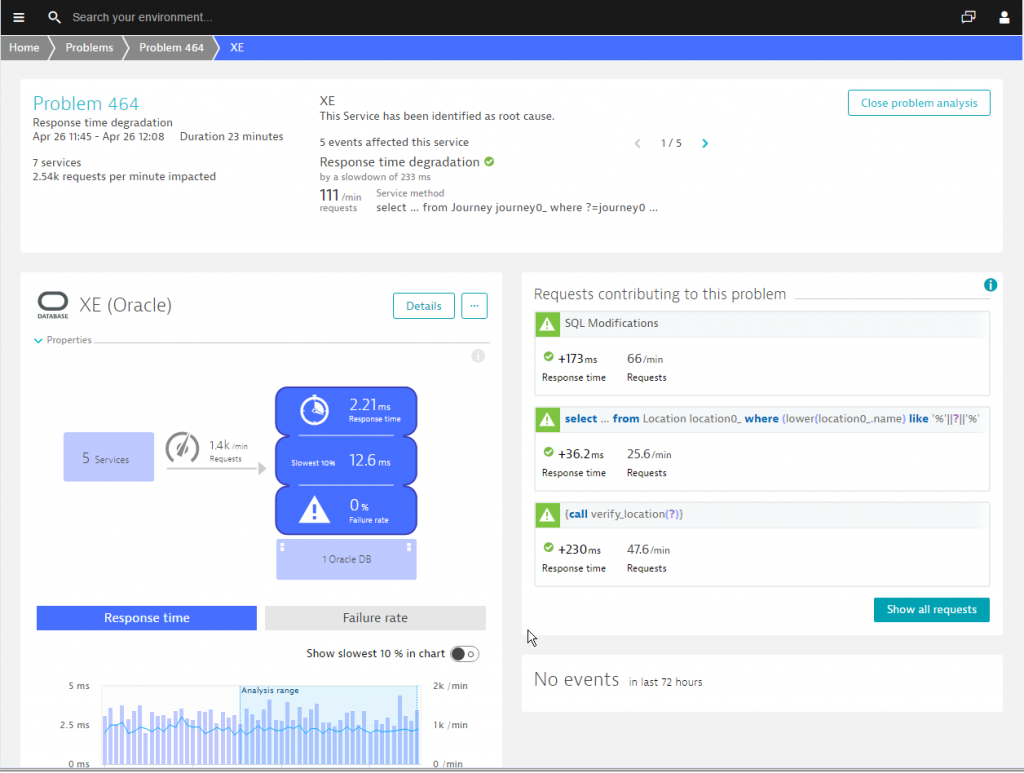
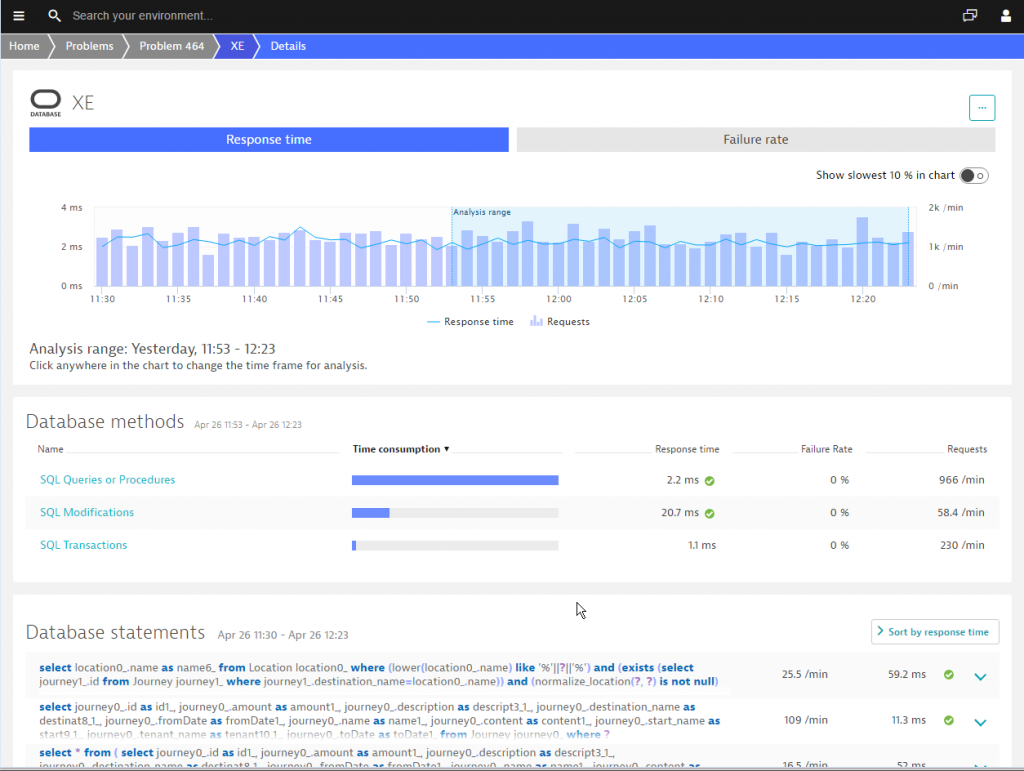
Another enhancement in this area is that Dynatrace now detects exactly which SQL statement is the root cause of each degradation. Looking at the example below you can see that the XE database has been identified as the root cause. But was it the whole database or just some specific statements that slowed down? Was this due to an index issue? Click the Analyze root cause button to see which specific statements are the root cause. Note that in the last screenshot below you can see how a specific SQL statement degraded over time and by how much.


Looking for answers?
Start a new discussion or ask for help in our Q&A forum.
Go to forum