
You may know that your refrigerator or your oven is somehow connected to the cloud. But do you have any idea what is enabling them to do so? Often, these devices are equipped with a Linux-based OS. In that case, it is possible to deploy our well-known Dynatrace OneAgent onto those devices for Full-Stack IoT monitoring. Because of that, those fridges and ovens are viewed as just another machine for Dynatrace. This is why Dynatrace is well positioned when it comes to your IoT project – from End-to-End.
We also understand that we are talking about thousands or millions of these smart IoT devices. When Dynatrace redefined monitoring, we targeted the use case of moving away from big monolithic monitoring, towards monitoring thousands (or millions) of microservices, or even functions in modern, highly scalable and distributed architectures. That investment makes it possible to leverage the power of Dynatrace for your backend, but also for your IoT devices. Why? Because you need to monitor the end-to-end value chain: from IoT device to the backend analytics database.
The statement “We are monitoring our IoT devices already with our IoT platform” leads us to this question: How can Dynatrace complete your IoT platform? IoT platforms such as AWS IoT, Azure IoT Suite or Thingworx can cover you on different aspects, but definitely not end-to-end. On the other hand, those platforms are working with the sensor-data itself, for example, and aren’t monitoring the flow of the data, including the auto-detection of dependencies.
When processing data at the edge – with software like AWS Greengrass, Azure IoT Edge etc. – you can reduce the cost of transmitting IoT data to the cloud and furthermore deal with intermittent connections. You can read more about that in the blogpost “IoT shifts from the cloud to the edge. Dynatrace sees it all.”
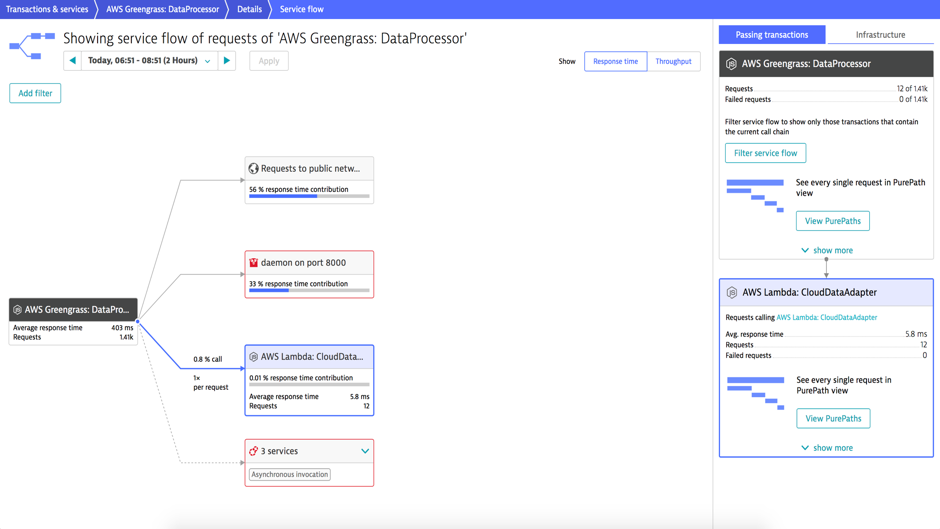
This service flow reflects the end-to-end flow of data from AWS Greengrass via MQTT request to the cloud backend. In this particular case, AWS Greengrass is sending data to an AWS Lambda function. In addition, you can also see the Greengrass daemon and the services that are running on AWS Greengrass.
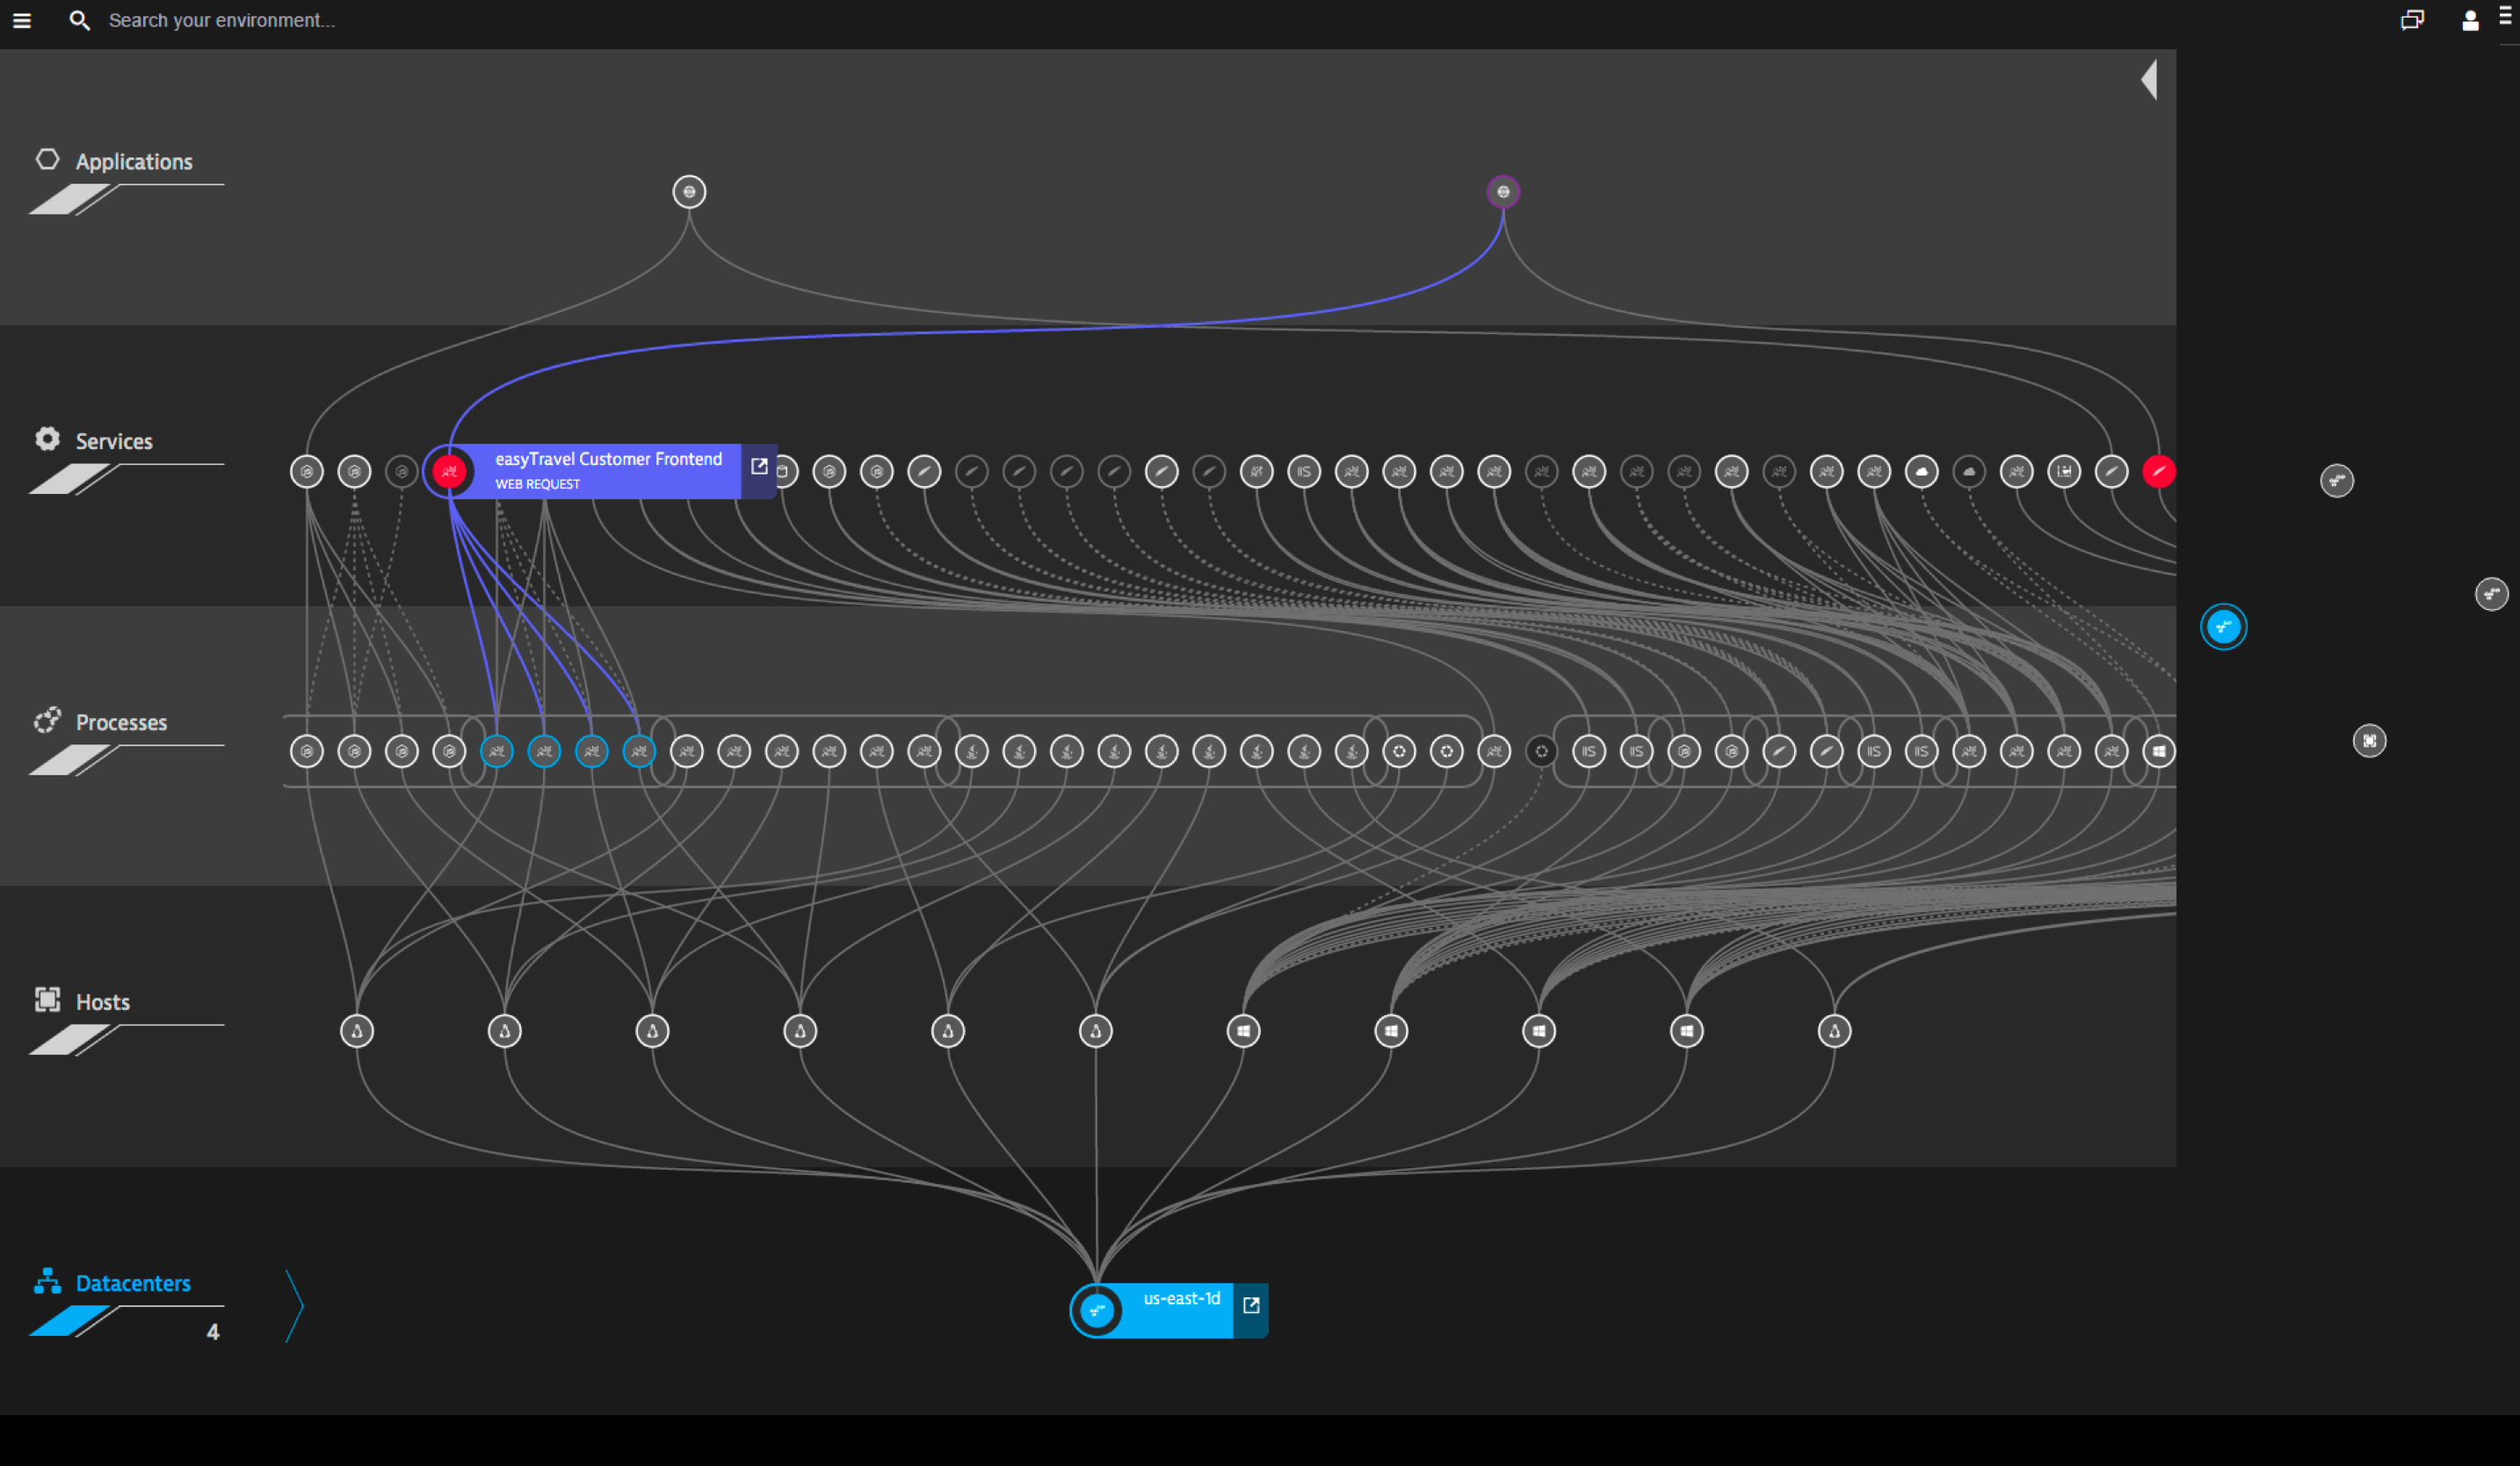
The great benefit of our auto detection is that you can be sure you are getting the complete picture and you won’t miss anything. As those environments are very dynamic and are up- and downscaling all the time, you always know what your environment looks like. Furthermore, our smartscape visualizes all the dependencies for you.
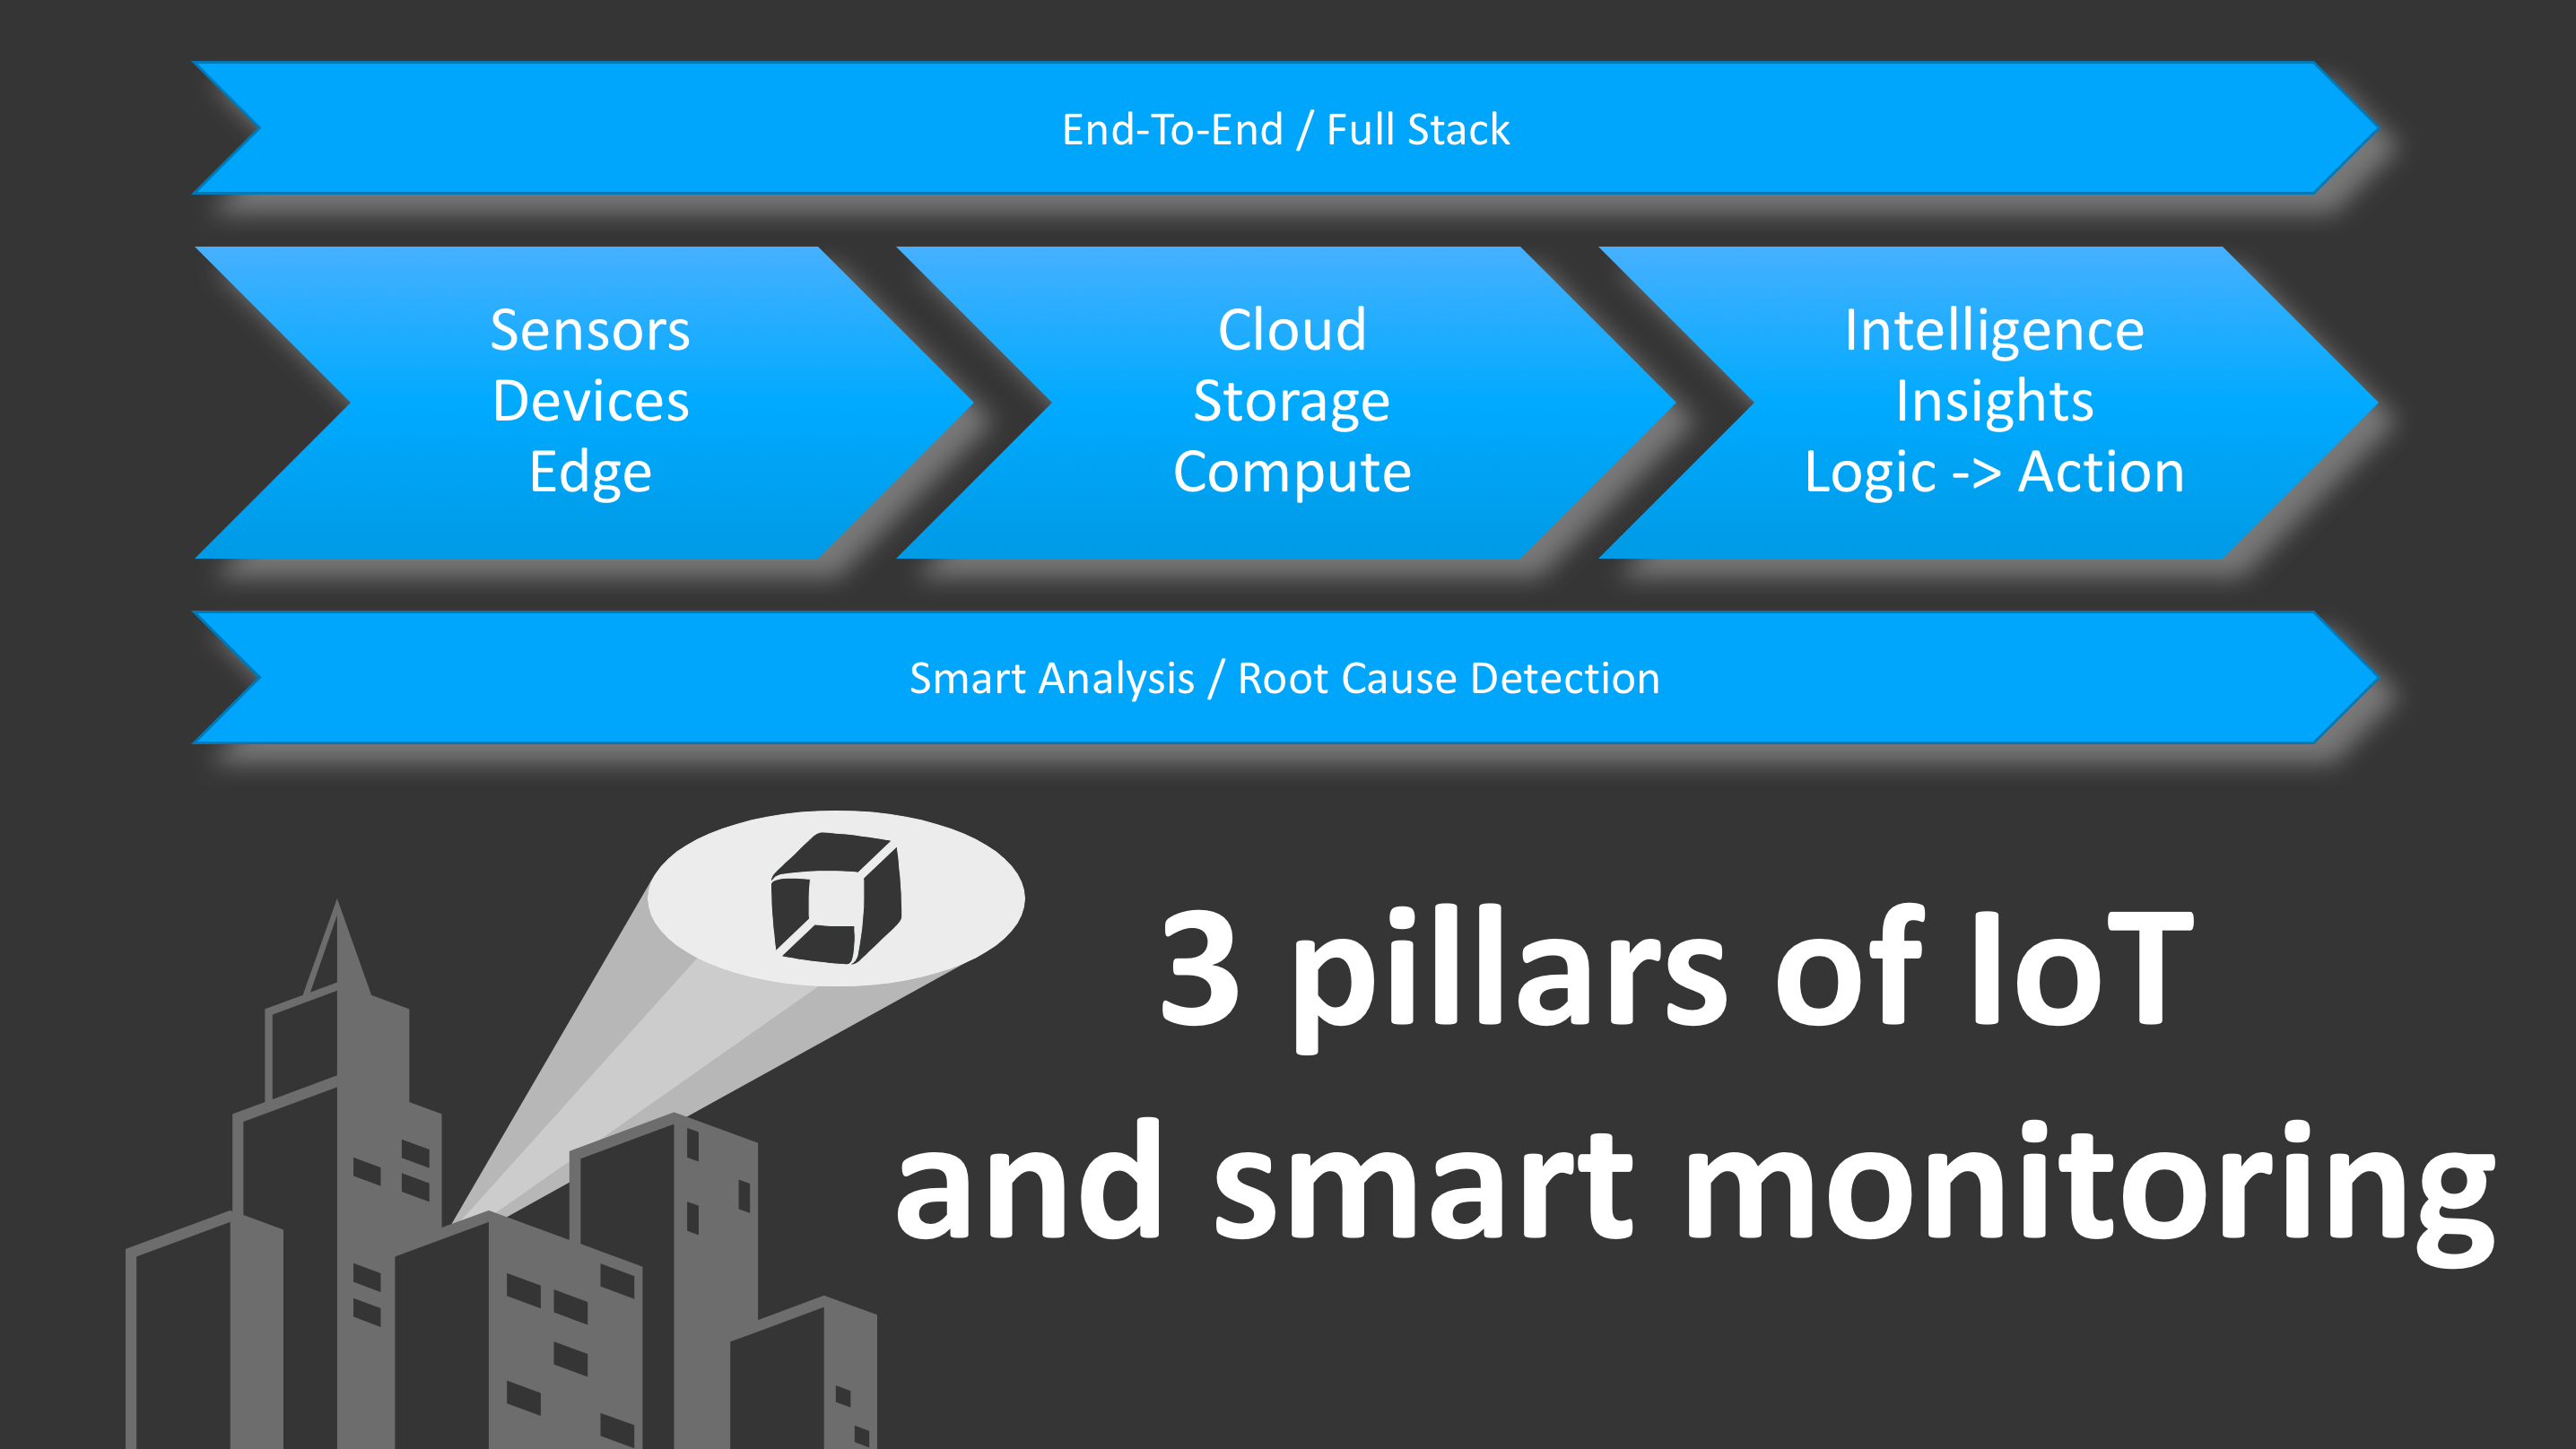
Last but not least: At Dynatrace we see three pillars of IoT and smart monitoring. Those three pillars give you a perfect, final overview of our IoT capabilities. Dynatrace covers you end-to-end and full-stack. Including the field, the cloud and added platforms. Additionally, we are connecting those parts by using our auto detection and pinpointing errors with our Smart Analysis and Root Cause Detection.
Curious to see what a perfect digital experience could look like? Let us show you. Click here for a free 15-day Dynatrace trial.


Looking for answers?
Start a new discussion or ask for help in our Q&A forum.
Go to forum